Saint Elizabeth's Area neighborhood in Wilmington, Delaware (DE), 19805 detailed profile
Settings
X

Business Search - 14 Million verified businesses
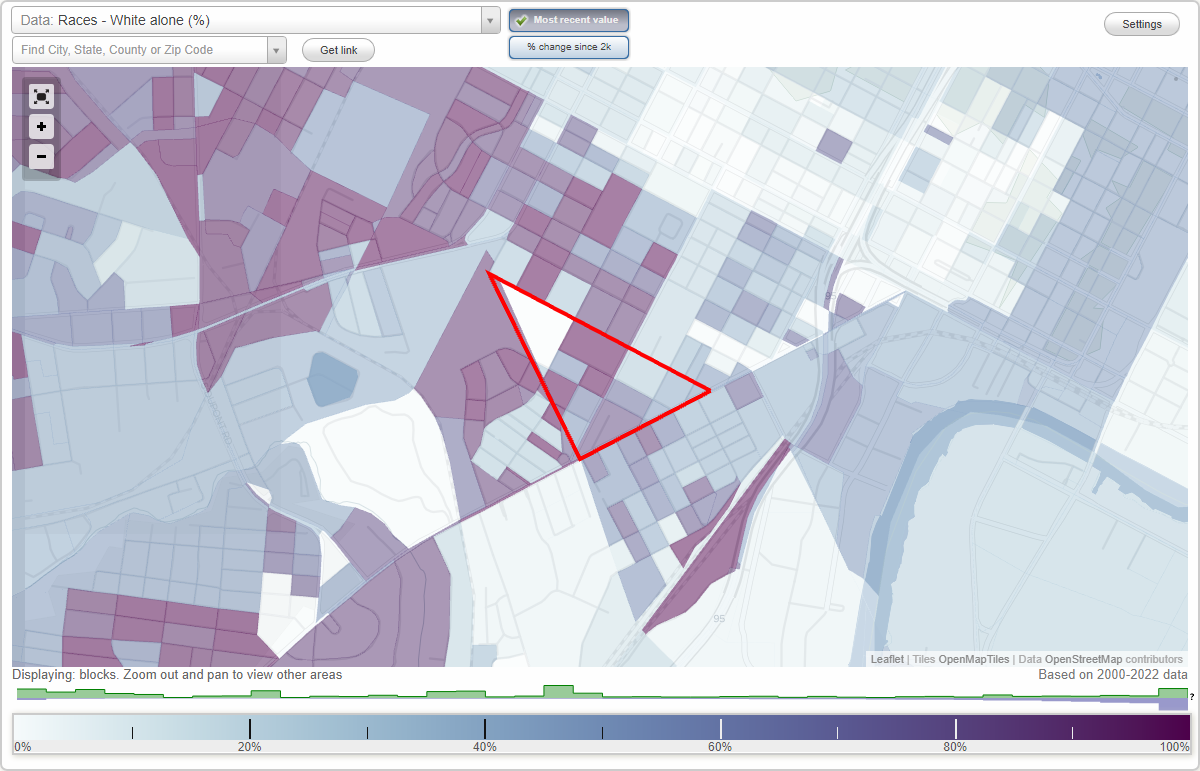
Area: 0.079 square miles
Population: 1,297
Population density:
| Saint Elizabeth's Area: | 16,422 people per square mile |
| Wilmington: | 6,597 people per square mile |

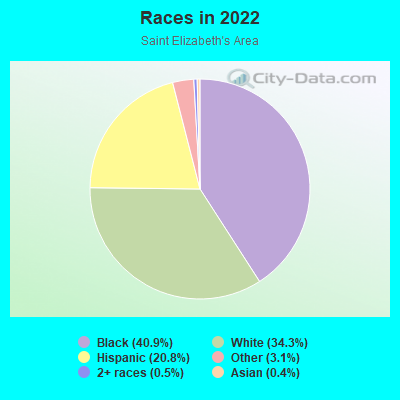
- 54540.9%Black
- 45634.3%White
- 27720.8%Hispanic or Latino
- 413.1%Some other race
- 70.5%Two or more races
- 50.4%Asian
Distribution of median household income
![Distribution of median household income]()
- 112Less than $10,000
- 119$10,000 to $19,999
- 35$20,000 to $29,999
- 107$30,000 to $39,999
- 62$40,000 to $49,999
- 9$50,000 to $59,999
- 33$60,000 to $74,999
- 41$75,000 to $99,999
- 56$100,000 to $124,999
- 42$125,000 to $149,999
- 22$150,000 to $199,999
- 13$200,000 or more

Distribution of owner-occupied house/condo value
![Distribution of owner-occupied house/condo value]()
- 24Less than $50,000
- 105$50,000 to $99,999
- 35$100,000 to $149,999
- 73$150,000 to $199,999
- 28$200,000 to $249,999
- 63$250,000 to $299,999
- 41$300,000 to $399,999
- 85$500,000 to $749,999
- 5$1,000,000 or more

Distribution of rent paid by renters
![Distribution of rent paid by renters]()
- 196$100 to $199
- 37$200 to $299
- 19$400 to $499
- 20$500 to $599
- 13$700 to $799
- 48$800 to $899
- 145$900 to $999
- 78$1,000 to $1,249
- 35$1,250 to $1,499
- 11$1,500 to $1,999

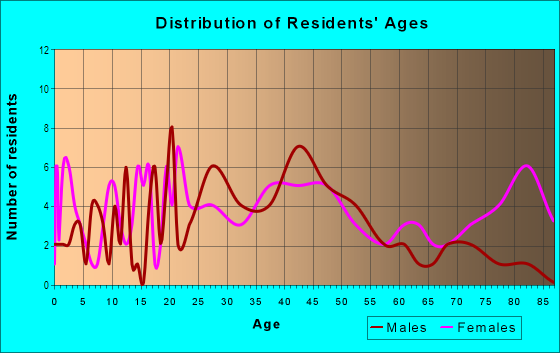
| Males: | 547 |
| Females: | 750 |
Males:
| This neighborhood: | 41.9 years |
| Whole city: | 37.1 years |
| This neighborhood: | 45.0 years |
| Whole city: | 41.1 years |
Average household size:
| Saint Elizabeth's Area: | 5.7 people |
| Wilmington: | 2.1 people |
Percentage of family households:
| Saint Elizabeth's Area: | 48.1% |
| Wilmington: | 32.8% |
| Here: | 15.6% |
| Wilmington: | 20.9% |
Percentage of married-couple families with children (among all households):
| Saint Elizabeth's Area: | 17.4% |
| Wilmington: | 13.2% |
Percentage of single-mother households (among all households):
| Saint Elizabeth's Area: | 34.1% |
| Wilmington: | 24.1% |
Percentage of never married males 15 years old and over:
Percentage of never married females 15 years old and over:
| Saint Elizabeth's Area: | 31.3% |
| Wilmington: | 22.2% |
Percentage of never married females 15 years old and over:
| Saint Elizabeth's Area: | 21.6% |
| city: | 28.6% |
Percentage of people that speak English not well or not at all:
| Saint Elizabeth's Area: | 10.1% |
| Wilmington: | 2.4% |
Percentage of people born in this state:
Percentage of people born in another U.S. state:
Percentage of native residents but born outside the U.S.:
Percentage of foreign born residents:
| Here: | 59.3% |
| Wilmington: | 45.5% |
Percentage of people born in another U.S. state:
| Saint Elizabeth's Area: | 30.8% |
| Wilmington: | 43.0% |
Percentage of native residents but born outside the U.S.:
| Here: | 4.8% |
| city: | 3.5% |
Percentage of foreign born residents:
| Here: | 5.1% |
| Wilmington: | 8.0% |
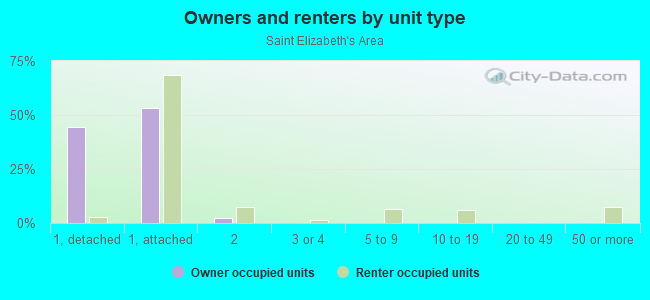
Owner-occupied
Renter-occupied

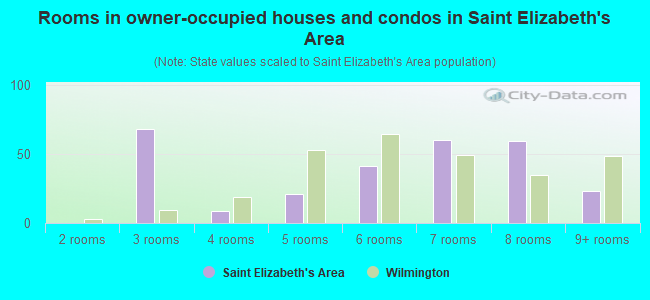
- Rooms in owner-occupied houses and condos in Saint Elizabeth's Area
- 01 room
- 02 rooms
- 683 rooms
- 94 rooms
- 215 rooms
- 416 rooms
- 607 rooms
- 598 rooms
- 239+ rooms
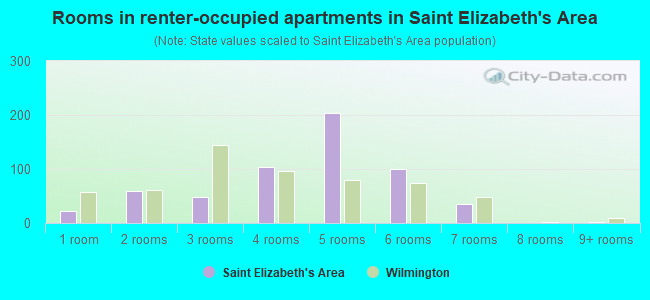
- Rooms in renter-occupied apartments in Saint Elizabeth's Area
- 221 room
- 602 rooms
- 483 rooms
- 1034 rooms
- 2045 rooms
- 1006 rooms
- 367 rooms
- 08 rooms
- 19+ rooms
Owner-occupied
Renter-occupied
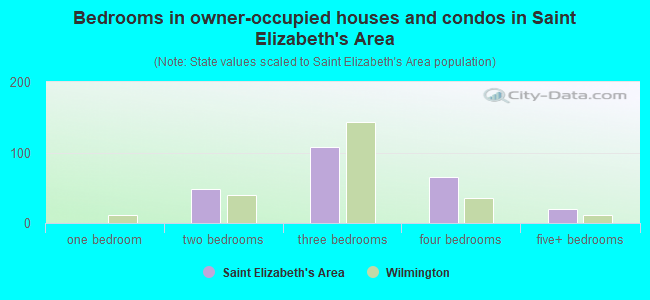
- Bedrooms in owner-occupied houses and condos in Saint Elizabeth's Area
- 0no bedroom
- 01 bedroom
- 482 bedrooms
- 1083 bedrooms
- 654 bedrooms
- 205+ bedrooms
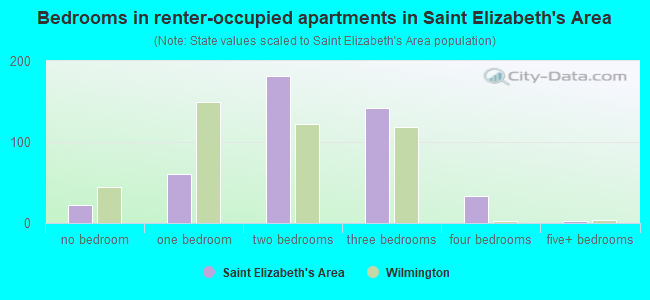
- Bedrooms in renter-occupied apartments in Saint Elizabeth's Area
- 22no bedroom
- 601 bedroom
- 1822 bedrooms
- 1423 bedrooms
- 334 bedrooms
- 35+ bedrooms
Average number of cars or other vehicles available in houses/condos:
Average number of cars or other vehicles available in apartments:
| This neighborhood: | 1.4 |
| Wilmington: | 1.6 |
Average number of cars or other vehicles available in apartments:
| Here: | |
| city: |
Percentage of units with a mortgage:
| Saint Elizabeth's Area: | 62.4% |
| Wilmington: | 67.1% |
Average estimated value of townhouses or other attached units in 2022 (72.2% of all units):
| This neighborhood: | $125,431 |
| Delaware: | $291,415 |
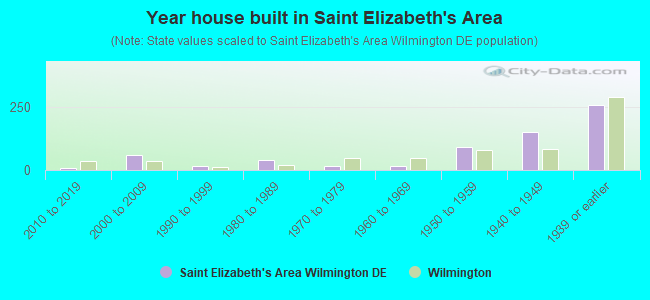
- Year house built in Saint Elizabeth's Area
- 02020 or later
- 62010 to 2019
- 582000 to 2009
- 161990 to 1999
- 381980 to 1989
- 151970 to 1979
- 141960 to 1969
- 911950 to 1959
- 1521940 to 1949
- 2581939 or earlier
City-data.com crime index for city in 2020 (higher means more crime):
| City: | 649.2 |
| U.S. average: | 219.5 |
Travel time to work (commute)
![Travel time to work (commute)]()
- 13Less than 5 minutes
- 585 to 9 minutes
- 20410 to 14 minutes
- 7315 to 19 minutes
- 7620 to 24 minutes
- 4325 to 29 minutes
- 5830 to 34 minutes
- 1135 to 39 minutes
- 1940 to 44 minutes
- 1745 to 59 minutes
- 560 to 89 minutes
- 3690 or more minutes

Means of transportation to work
![Means of transportation to work]()
- 75.7%383Drove a car alone
- 20.6%104Carpooled
- 8.1%41Bus
- 1.6%8Long-distance train or commuter rail
- 4.4%22Walked
- 0.6%3Other means
- 4.5%23Worked at home

Time leaving home to go to work
![Time leaving home to go to work]()
- 812:00 a.m. to 4:59 a.m.
- 225:00 a.m. to 5:29 a.m.
- 145:30 a.m. to 5:59 a.m.
- 336:00 a.m. to 6:29 a.m.
- 466:30 a.m. to 6:59 a.m.
- 1027:00 a.m. to 7:29 a.m.
- 437:30 a.m. to 7:59 a.m.
- 1278:00 a.m. to 8:29 a.m.
- 638:30 a.m. to 8:59 a.m.
- 719:00 a.m. to 9:59 a.m.
- 1010:00 a.m. to 10:59 a.m.
- 6412:00 p.m. to 3:59 p.m.
- 444:00 p.m. to 11:59 p.m.

Occupations of males:
- Percentage of males in management occupations (except farmers):
Here: 3.2% city: 8.8%
- Percentage of males in computer and mathematical occupations:
Here: 1.3% city: 3.9%
- Percentage of males in architecture and engineering occupations:
Here: 19.2% city: 3.0%
- Percentage of males in community and social services occupations:
Here: 2.4% city: 3.6%
- Percentage of males in education, training, and library occupations:
Here: 1.5% city: 2.6%
- Percentage of males in healthcare practitioners and technical occupations:
Here: 1.3% city: 3.8%
- Percentage of males in service occupations:
Here: 17.9% city: 18.7%
- Percentage of males in sales and office occupations:
Here: 9.7% city: 11.8%
- Percentage of males in construction, extraction, and maintenance occupations:
Here: 2.7% city: 6.3%
- Percentage of males in production occupations:
Here: 24.3% city: 5.6%
- Percentage of males in transportation occupations:
Here: 8.6% city: 7.6%
Occupations of females:
- Percentage of females in management occupations (except farmers):
Here: 13.3% city: 10.8%
- Percentage of females in business and financial operations occupations:
Here: 5.9% city: 10.0%
- Percentage of females in computer and mathematical occupations:
Here: 1.0% city: 2.3%
- Percentage of females in community and social services occupations:
Here: 2.2% city: 4.0%
- Percentage of females in healthcare practitioners and technical occupations:
Here: 1.2% city: 8.1%
- Percentage of females in service occupations:
Here: 25.8% city: 21.3%
- Percentage of females in sales and office occupations:
Here: 26.7% city: 21.1%
- Percentage of females in production occupations:
Here: 17.6% city: 2.2%
- Percentage of females in material moving occupations:
Here: 5.2% city: 2.5%
Percentage of people 16-64 in Armed Forces:
| Saint Elizabeth's Area: | 0.6% |
| Wilmington: | 0.4% |
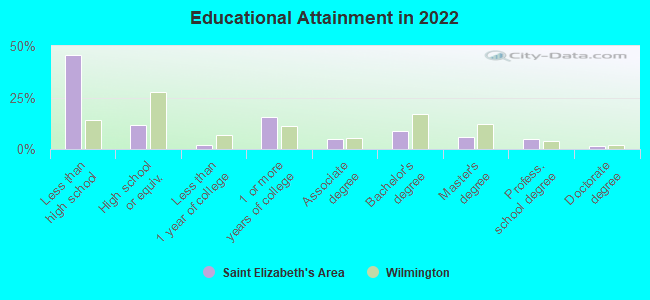
Education in this neighborhood (subdivision or community):
- Percentage of people 3 years and older in K-12 schools:
Saint Elizabeth's Area: 28.1% Wilmington: 16.0%
- Percentage of people 3 years and older in undergraduate colleges:
Saint Elizabeth's Area: 4.5% Wilmington: 3.1%
- Percentage of people 3 years and older in grad. or professional schools:
Saint Elizabeth's Area: 4.1% Wilmington: 2.8%
- Percentage of students K-12 enrolled in private schools:
Saint Elizabeth's Area: 8.2% Wilmington: 8.2%
Percentage of population below poverty level:
| Saint Elizabeth's Area: | 20.1% |
| Wilmington: | 22.2% |
Median year owner moved in (as recorded in 2022):
| Saint Elizabeth's Area: | 2003 |
| Wilmington: | 2010 |
Percentage of married-couple families with both working:
| Saint Elizabeth's Area: | 126.1% |
| Wilmington: | 84.9% |
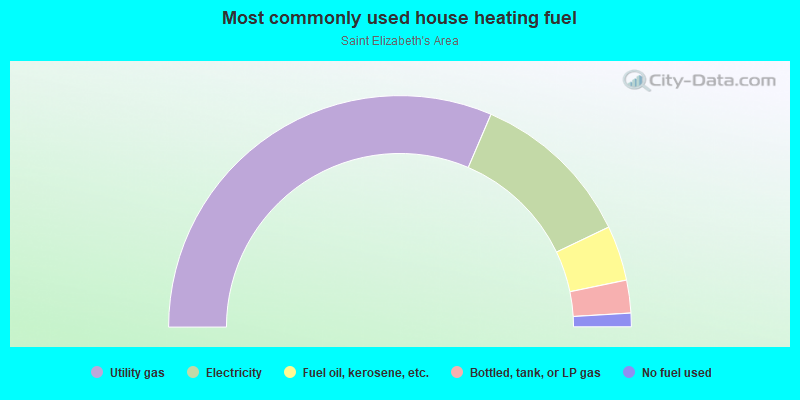
- 62.9%Utility gas
- 22.9%Electricity
- 7.7%Fuel oil, kerosene, etc.
- 4.6%Bottled, tank, or LP gas
- 1.9%No fuel used
Highways in this neighborhood:
Maryland Ave (State Rd 4)
Length: 0.51 miles
Directions: E-W, N-S, SW-NE
Address range: 851 to 1598
Directions: E-W, N-S, SW-NE
Address range: 851 to 1598
Roads and streets:
Cedar St
Length: 0.37 miles
Directions: E-W, SE-NW
Address range: 1201 to 1599
Directions: E-W, SE-NW
Address range: 1201 to 1599
Banning St
Length: 0.36 miles
Directions: E-W, SE-NW
Address range: 1300 to 1898
Directions: E-W, SE-NW
Address range: 1300 to 1898
S Franklin St
Length: 0.16 miles
Direction: SW-NE
Address range: 800 to 1099
Direction: SW-NE
Address range: 800 to 1099
S Rodney St
Length: 0.14 miles
Directions: N-S, SW-NE
Address range: 900 to 1099
Directions: N-S, SW-NE
Address range: 900 to 1099
S Broom St
Length: 0.12 miles
Direction: SW-NE
Address range: 900 to 1099
Direction: SW-NE
Address range: 900 to 1099
St Elizabeth St
Length: 0.11 miles
Directions: E-W, SE-NW
Address range: 1400 to 1499
Directions: E-W, SE-NW
Address range: 1400 to 1499
Oak St
Length: 0.11 miles
Directions: E-W, SE-NW
Address range: 1219 to 1348
Directions: E-W, SE-NW
Address range: 1219 to 1348
S Clayton St
Length: 0.08 miles
Directions: N-S, SW-NE
Address range: 900 to 1010
Directions: N-S, SW-NE
Address range: 900 to 1010