Santa Clara neighborhood in Dayton, Ohio (OH), 45405 detailed profile
Settings
X


Business Search - 14 Million verified businesses
Area: 0.236 square miles
Population: 1,230
Population density:
| Santa Clara: | 5,207 people per square mile |
| Dayton: | 2,437 people per square mile |

- 89973.0%Black
- 13410.9%White
- 1159.3%Hispanic or Latino
- 806.5%Two or more races
- 30.2%Some other race

Distribution of median household income
![Distribution of median household income]()
- 17Less than $10,000
- 84$10,000 to $19,999
- 110$20,000 to $29,999
- 70$30,000 to $39,999
- 36$40,000 to $49,999
- 47$50,000 to $59,999
- 26$60,000 to $74,999
- 64$75,000 to $99,999
- 11$100,000 to $124,999
- 43$125,000 to $149,999
- 18$150,000 to $199,999

Distribution of owner-occupied house/condo value
![Distribution of owner-occupied house/condo value]()
- 156Less than $50,000
- 121$50,000 to $99,999
- 54$100,000 to $149,999
- 29$150,000 to $199,999
- 7$300,000 to $399,999

Distribution of rent paid by renters
![Distribution of rent paid by renters]()
- 27$200 to $299
- 13$300 to $399
- 48$400 to $499
- 116$500 to $599
- 89$600 to $699
- 63$700 to $799
- 38$800 to $899
- 23$900 to $999
- 13$1,000 to $1,249

Median rent in 2022:
| Santa Clara: | $588 |
| Dayton: | $612 |
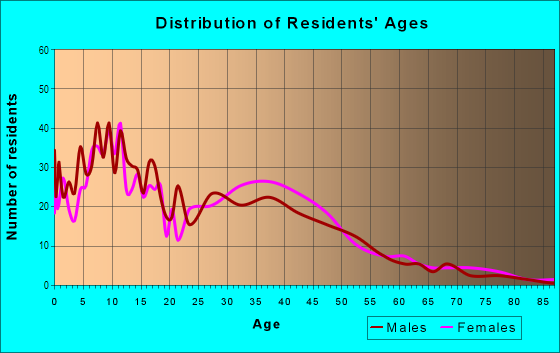
| Males: | 646 |
| Females: | 583 |
Males:
| This neighborhood: | 43.0 years |
| Whole city: | 36.3 years |
| This neighborhood: | 36.2 years |
| Whole city: | 40.2 years |
Average household size:
| Santa Clara: | 2.5 people |
| Dayton: | 1.9 people |
Percentage of family households:
| Santa Clara: | 48.4% |
| Dayton: | 32.6% |
| Here: | 11.2% |
| Dayton: | 24.5% |
Percentage of married-couple families with children (among all households):
| Santa Clara: | 6.6% |
| Dayton: | 19.6% |
Percentage of single-mother households (among all households):
| Santa Clara: | 31.4% |
| Dayton: | 24.9% |
Percentage of never married males 15 years old and over:
Percentage of never married females 15 years old and over:
| Santa Clara: | 26.7% |
| Dayton: | 24.8% |
Percentage of never married females 15 years old and over:
| Santa Clara: | 26.5% |
| city: | 23.3% |
Percentage of people that speak English not well or not at all:
| Santa Clara: | 2.2% |
| Dayton: | 1.6% |
Percentage of people born in this state:
Percentage of people born in another U.S. state:
Percentage of native residents but born outside the U.S.:
Percentage of foreign born residents:
| Here: | 73.5% |
| Dayton: | 68.0% |
Percentage of people born in another U.S. state:
| Santa Clara: | 23.8% |
| Dayton: | 26.4% |
Percentage of native residents but born outside the U.S.:
| Here: | 2.5% |
| city: | 1.7% |
Percentage of foreign born residents:
| Here: | 2.7% |
| Dayton: | 3.8% |

Owner-occupied
Renter-occupied


- Rooms in owner-occupied houses and condos in Santa Clara
- 121 room
- 02 rooms
- 03 rooms
- 34 rooms
- 575 rooms
- 436 rooms
- 547 rooms
- 278 rooms
- 459+ rooms

- Rooms in renter-occupied apartments in Santa Clara
- 231 room
- 162 rooms
- 613 rooms
- 524 rooms
- 685 rooms
- 836 rooms
- 407 rooms
- 128 rooms
- 299+ rooms
Owner-occupied
Renter-occupied

- Bedrooms in owner-occupied houses and condos in Santa Clara
- 12no bedroom
- 311 bedroom
- 642 bedrooms
- 783 bedrooms
- 154 bedrooms
- 315+ bedrooms

- Bedrooms in renter-occupied apartments in Santa Clara
- 23no bedroom
- 351 bedroom
- 882 bedrooms
- 1643 bedrooms
- 264 bedrooms
- 105+ bedrooms
Average number of cars or other vehicles available in houses/condos:
Average number of cars or other vehicles available in apartments:
| This neighborhood: | 1.8 |
| Dayton: | 1.8 |
Average number of cars or other vehicles available in apartments:
| Here: | 1.0 |
| city: | 0.9 |
Percentage of units with a mortgage:
| Santa Clara: | 23.7% |
| Dayton: | 54.7% |
Average estimated value of detached houses in 2022 (56.9% of all units):
| Santa Clara: | $28,293 |
| Dayton: | $96,843 |

- Year house built in Santa Clara
- 02020 or later
- 02010 to 2019
- 182000 to 2009
- 281990 to 1999
- 401980 to 1989
- 71970 to 1979
- 531960 to 1969
- 261950 to 1959
- 941940 to 1949
- 6821939 or earlier

City-data.com crime index for city in 2020 (higher means more crime):
| City: | 559.8 |
| U.S. average: | 219.5 |
Travel time to work (commute)
![Travel time to work (commute)]()
- 7Less than 5 minutes
- 305 to 9 minutes
- 11110 to 14 minutes
- 6215 to 19 minutes
- 12020 to 24 minutes
- 2525 to 29 minutes
- 5230 to 34 minutes
- 635 to 39 minutes
- 3040 to 44 minutes
- 2145 to 59 minutes
- 1060 to 89 minutes
- 3690 or more minutes

Means of transportation to work
![Means of transportation to work]()
- 59.9%330Drove a car alone
- 14.0%77Carpooled
- 10.5%58Bus
- 14.7%81Taxi
- 4.5%25Walked
- 4.5%25Worked at home

Time leaving home to go to work
![Time leaving home to go to work]()
- 1112:00 a.m. to 4:59 a.m.
- 305:00 a.m. to 5:29 a.m.
- 425:30 a.m. to 5:59 a.m.
- 696:00 a.m. to 6:29 a.m.
- 176:30 a.m. to 6:59 a.m.
- 417:00 a.m. to 7:29 a.m.
- 627:30 a.m. to 7:59 a.m.
- 198:00 a.m. to 8:29 a.m.
- 168:30 a.m. to 8:59 a.m.
- 109:00 a.m. to 9:59 a.m.
- 1810:00 a.m. to 10:59 a.m.
- 1511:00 a.m. to 11:59 a.m.
- 5312:00 p.m. to 3:59 p.m.
- 964:00 p.m. to 11:59 p.m.

Occupations of males:
- Percentage of males in management occupations (except farmers):
Here: 4.0% city: 7.5%
- Percentage of males in computer and mathematical occupations:
Here: 2.5% city: 3.2%
- Percentage of males in architecture and engineering occupations:
Here: 9.7% city: 3.4%
- Percentage of males in community and social services occupations:
Here: 2.9% city: 1.8%
- Percentage of males in healthcare practitioners and technical occupations:
Here: 3.7% city: 1.7%
- Percentage of males in service occupations:
Here: 19.2% city: 18.0%
- Percentage of males in sales and office occupations:
Here: 8.1% city: 14.3%
- Percentage of males in construction, extraction, and maintenance occupations:
Here: 7.6% city: 5.2%
- Percentage of males in production occupations:
Here: 17.9% city: 13.4%
- Percentage of males in transportation occupations:
Here: 4.3% city: 8.0%
- Percentage of males in material moving occupations:
Here: 14.1% city: 8.4%
Occupations of females:
- Percentage of females in management occupations (except farmers):
Here: 10.8% city: 6.5%
- Percentage of females in business and financial operations occupations:
Here: 2.2% city: 4.8%
- Percentage of females in computer and mathematical occupations:
Here: 1.7% city: 1.8%
- Percentage of females in education, training, and library occupations:
Here: 5.1% city: 7.0%
- Percentage of females in healthcare practitioners and technical occupations:
Here: 4.2% city: 8.6%
- Percentage of females in service occupations:
Here: 23.0% city: 24.7%
- Percentage of females in sales and office occupations:
Here: 37.0% city: 27.9%
- Percentage of females in production occupations:
Here: 6.1% city: 5.9%
- Percentage of females in transportation occupations:
Here: 8.1% city: 1.6%
- Percentage of females in material moving occupations:
Here: 1.7% city: 2.8%
Education in this neighborhood (subdivision or community):
- Percentage of people 3 years and older in K-12 schools:
Santa Clara: 35.6% Dayton: 12.8%
- Percentage of people 3 years and older in undergraduate colleges:
Santa Clara: 4.3% Dayton: 11.0%
- Percentage of people 3 years and older in grad. or professional schools:
Santa Clara: 2.1% Dayton: 1.3%
- Percentage of students K-12 enrolled in private schools:
Santa Clara: 14.0% Dayton: 31.5%
Percentage of population below poverty level:
| Santa Clara: | 31.5% |
| Dayton: | 25.4% |
Median year owner moved in (as recorded in 2022):
Median year renter moved in (as recorded in 2022):
| Santa Clara: | 1998 |
| Dayton: | 2008 |
Median year renter moved in (as recorded in 2022):
| Santa Clara: | 2010 |
| Dayton: | 2019 |
Percentage of married-couple families with both working:
| Santa Clara: | 172.9% |
| Dayton: | 65.9% |

- 62.1%Utility gas
- 23.4%Electricity
- 8.2%Bottled, tank, or LP gas
- 6.3%No fuel used
Highways in this neighborhood:
State Rte 48 (Main St)
Length: 0.41 miles
Directions: N-S, SE-NW
Address range: 1801 to 2230
Directions: N-S, SE-NW
Address range: 1801 to 2230
Roads and streets:
Delaware Ave
Length: 0.64 miles
Directions: E-W, SW-NE
Address range: 1 to 499
Directions: E-W, SW-NE
Address range: 1 to 499
W Hudson Ave
Length: 0.61 miles
Direction: E-W
Address range: 1 to 299
Direction: E-W
Address range: 1 to 299
Marathon Ave
Length: 0.50 miles
Direction: E-W
Address range: 1 to 298
Direction: E-W
Address range: 1 to 298
Fountain Ave
Length: 0.47 miles
Directions: E-W, SW-NE
Address range: 1 to 299
Directions: E-W, SW-NE
Address range: 1 to 299
Wheatley Ave
Length: 0.46 miles
Direction: N-S
Address range: 800 to 1499
Direction: N-S
Address range: 800 to 1499
W Norman Ave
Length: 0.45 miles
Direction: E-W
Address range: 1 to 199
Direction: E-W
Address range: 1 to 199
Victor Ave
Length: 0.40 miles
Directions: E-W, SW-NE
Address range: 1 to 199
Directions: E-W, SW-NE
Address range: 1 to 199
Santa Clara Ave
Length: 0.33 miles
Direction: E-W
Address range: 1 to 199
Direction: E-W
Address range: 1 to 199
Richmond Ave
Length: 0.33 miles
Direction: N-S
Address range: 800 to 1299
Direction: N-S
Address range: 800 to 1299
Niagara Ave
Length: 0.24 miles
Direction: E-W
Address range: 1 to 199
Direction: E-W
Address range: 1 to 199
Cherry Dr
Length: 0.06 miles
Direction: N-S
Address range: 100 to 199
Direction: N-S
Address range: 100 to 199