Scotch 80's neighborhood in Las Vegas, Nevada (NV), 89102 detailed profile
Settings
X


Business Search - 14 Million verified businesses
Area: 0.187 square miles
Population: 298
Population density:
| Scotch 80's: | 1,596 people per square mile |
| Las Vegas: | 5,792 people per square mile |

- 19365.4%White
- 4013.6%Hispanic or Latino
- 3110.5%Two or more races
- 237.8%Asian
- 51.7%Black
- 31.0%Native Hawaiian and Other
Pacific Islander

Median household income in 2022:
| Scotch 80's: | $140,671 |
| Las Vegas: | $68,905 |
Distribution of median household income
![Distribution of median household income]()
- 7$10,000 to $19,999
- 3$20,000 to $29,999
- 5$30,000 to $39,999
- 3$40,000 to $49,999
- 13$50,000 to $59,999
- 12$60,000 to $74,999
- 10$75,000 to $99,999
- 23$100,000 to $124,999
- 12$125,000 to $149,999
- 20$150,000 to $199,999
- 22$200,000 or more

Distribution of owner-occupied house/condo value
![Distribution of owner-occupied house/condo value]()
- 2Less than $50,000
- 21$200,000 to $249,999
- 8$250,000 to $299,999
- 7$300,000 to $399,999
- 19$400,000 to $499,999
- 16$500,000 to $749,999
- 4$750,000 to $999,999
- 19$1,000,000 or more

Distribution of rent paid by renters
![Distribution of rent paid by renters]()
- 3$1,250 to $1,499
- 12$1,500 to $1,999
- 8$2,000 or more

Median rent in 2022:
| Scotch 80's: | $1,848 |
| Las Vegas: | $1,277 |
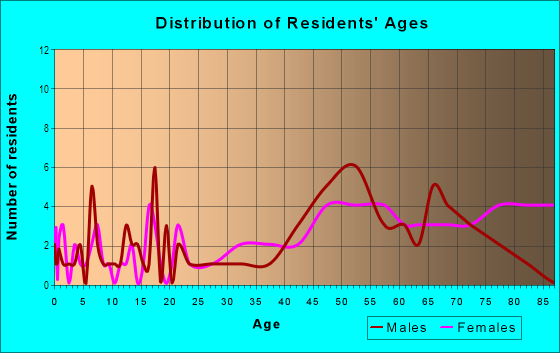
| Males: | 174 |
| Females: | 123 |
Males:
| This neighborhood: | 39.3 years |
| Whole city: | 38.4 years |
| This neighborhood: | 53.9 years |
| Whole city: | 38.9 years |
Average household size:
| Scotch 80's: | 3.2 people |
| Las Vegas: | 2.7 people |
Percentage of family households:
| Scotch 80's: | 40.6% |
| Las Vegas: | 45.8% |
| Here: | 54.7% |
| Las Vegas: | 40.9% |
Percentage of married-couple families with children (among all households):
| Scotch 80's: | 20.0% |
| Las Vegas: | 23.4% |
Percentage of single-mother households (among all households):
| Scotch 80's: | 3.3% |
| Las Vegas: | 10.1% |
Percentage of never married males 15 years old and over:
Percentage of never married females 15 years old and over:
| Scotch 80's: | 27.4% |
| Las Vegas: | 19.7% |
Percentage of never married females 15 years old and over:
| Scotch 80's: | 1.8% |
| city: | 17.0% |
Percentage of people that speak English not well or not at all:
| Scotch 80's: | 1.3% |
| Las Vegas: | 7.0% |
Percentage of people born in this state:
Percentage of people born in another U.S. state:
Percentage of native residents but born outside the U.S.:
Percentage of foreign born residents:
| Here: | 24.5% |
| Las Vegas: | 27.3% |
Percentage of people born in another U.S. state:
| Scotch 80's: | 61.7% |
| Las Vegas: | 49.8% |
Percentage of native residents but born outside the U.S.:
| Here: | 0.0% |
| city: | 1.9% |
Percentage of foreign born residents:
| Here: | 13.8% |
| Las Vegas: | 21.0% |

Owner-occupied
Renter-occupied


- Rooms in owner-occupied houses and condos in Scotch 80's
- 01 room
- 02 rooms
- 03 rooms
- 134 rooms
- 125 rooms
- 106 rooms
- 97 rooms
- 138 rooms
- 189+ rooms

- Rooms in renter-occupied apartments in Scotch 80's
- 01 room
- 02 rooms
- 43 rooms
- 04 rooms
- 05 rooms
- 96 rooms
- 207 rooms
- 88 rooms
- 89+ rooms
Owner-occupied
Renter-occupied

- Bedrooms in owner-occupied houses and condos in Scotch 80's
- 0no bedroom
- 01 bedroom
- 32 bedrooms
- 293 bedrooms
- 304 bedrooms
- 15+ bedrooms

- Bedrooms in renter-occupied apartments in Scotch 80's
- 0no bedroom
- 41 bedroom
- 02 bedrooms
- 113 bedrooms
- 74 bedrooms
- 85+ bedrooms
Average number of cars or other vehicles available in houses/condos:
Average number of cars or other vehicles available in apartments:
| This neighborhood: | 2.1 |
| Las Vegas: | 2.0 |
Average number of cars or other vehicles available in apartments:
| Here: | 2.4 |
| city: | 1.3 |
Percentage of units with a mortgage:
| Scotch 80's: | 69.3% |
| Las Vegas: | 69.3% |
Average estimated value of detached houses in 2022 (100.0% of all units):
| Scotch 80's: | $731,015 |
| Nevada: | $549,327 |

- Year house built in Scotch 80's
- 02020 or later
- 82010 to 2019
- 112000 to 2009
- 121990 to 1999
- 01980 to 1989
- 271970 to 1979
- 211960 to 1969
- 191950 to 1959
- 31940 to 1949
- 41939 or earlier

City-data.com crime index for city in 2020 (higher means more crime):
| City: | 280.7 |
| U.S. average: | 219.5 |
Travel time to work (commute)
![Travel time to work (commute)]()
- 55 to 9 minutes
- 1510 to 14 minutes
- 2315 to 19 minutes
- 1720 to 24 minutes
- 2025 to 29 minutes
- 2330 to 34 minutes
- 140 to 44 minutes
- 445 to 59 minutes
- 560 to 89 minutes
- 290 or more minutes

Means of transportation to work
![Means of transportation to work]()
- 34.9%42Drove a car alone
- 69.8%84Carpooled
- 19.1%23Bus
- 1.7%2Long-distance train or commuter rail
- 6.6%8Bicycle
- 44.9%54Worked at home

Time leaving home to go to work
![Time leaving home to go to work]()
- 112:00 a.m. to 4:59 a.m.
- 15:30 a.m. to 5:59 a.m.
- 46:00 a.m. to 6:29 a.m.
- 67:00 a.m. to 7:29 a.m.
- 177:30 a.m. to 7:59 a.m.
- 238:00 a.m. to 8:29 a.m.
- 98:30 a.m. to 8:59 a.m.
- 99:00 a.m. to 9:59 a.m.
- 1710:00 a.m. to 10:59 a.m.
- 1812:00 p.m. to 3:59 p.m.
- 64:00 p.m. to 11:59 p.m.

Occupations of males:
- Percentage of males in management occupations (except farmers):
Here: 3.2% city: 9.6%
- Percentage of males in business and financial operations occupations:
Here: 22.5% city: 3.6%
- Percentage of males in computer and mathematical occupations:
Here: 6.9% city: 3.4%
- Percentage of males in legal occupations:
Here: 8.3% city: 0.9%
- Percentage of males in education, training, and library occupations:
Here: 9.2% city: 2.5%
- Percentage of males in arts, design, entertainment, sports, and media occupations:
Here: 8.3% city: 2.5%
- Percentage of males in healthcare practitioners and technical occupations:
Here: 3.2% city: 3.3%
- Percentage of males in sales and office occupations:
Here: 30.3% city: 16.6%
Occupations of females:
- Percentage of females in management occupations (except farmers):
Here: 13.3% city: 8.5%
- Percentage of females in healthcare practitioners and technical occupations:
Here: 8.9% city: 7.4%
- Percentage of females in sales and office occupations:
Here: 68.8% city: 30.5%
- Percentage of females in transportation occupations:
Here: 8.9% city: 1.6%
Education in this neighborhood (subdivision or community):
- Percentage of people 3 years and older in K-12 schools:
Scotch 80's: 18.5% Las Vegas: 17.4%
- Percentage of people 3 years and older in undergraduate colleges:
Scotch 80's: 2.0% Las Vegas: 4.2%
- Percentage of people 3 years and older in grad. or professional schools:
Scotch 80's: 0.0% Las Vegas: 1.0%
- Percentage of students K-12 enrolled in private schools:
Scotch 80's: 34.5% Las Vegas: 12.9%
Percentage of population below poverty level:
| Scotch 80's: | 9.6% |
| Las Vegas: | 14.1% |
Median year owner moved in (as recorded in 2022):
Median year renter moved in (as recorded in 2022):
| Scotch 80's: | 2005 |
| Las Vegas: | 2015 |
Median year renter moved in (as recorded in 2022):
| Scotch 80's: | 2017 |
| Las Vegas: | 2020 |
Percentage of married-couple families with both working:
| Scotch 80's: | 170.1% |
| Las Vegas: | 62.0% |

- 63.5%Utility gas
- 36.5%Electricity
Roads and streets:
Bannie Ave
Length: 0.53 miles
Direction: E-W
Address range: 1700 to 2299
Direction: E-W
Address range: 1700 to 2299
Waldman Ave
Length: 0.51 miles
Direction: E-W
Address range: 1600 to 2199
Direction: E-W
Address range: 1600 to 2199
Silver Ave
Length: 0.46 miles
Direction: E-W
Address range: 1700 to 2199
Direction: E-W
Address range: 1700 to 2199
Edgewood Ave
Length: 0.29 miles
Direction: E-W
Address range: 2000 to 2299
Direction: E-W
Address range: 2000 to 2299
Westwood Dr
Length: 0.28 miles
Direction: N-S
Address range: 1236 to 1699
Direction: N-S
Address range: 1236 to 1699
W Oakey Blvd
Length: 0.28 miles
Direction: E-W
Address range: 1911 to 2221
Direction: E-W
Address range: 1911 to 2221
Park Cir
Length: 0.27 miles
Directions: E-W, N-S, SE-NW, SW-NE
Address range: 1200 to 1299
Directions: E-W, N-S, SE-NW, SW-NE
Address range: 1200 to 1299
Birch St
Length: 0.26 miles
Direction: N-S
Address range: 1300 to 1699
Direction: N-S
Address range: 1300 to 1699
Pine St
Length: 0.25 miles
Directions: N-S, SW-NE
Address range: 1400 to 1699
Directions: N-S, SW-NE
Address range: 1400 to 1699
Crescent Dr
Length: 0.15 miles
Directions: E-W, N-S, SE-NW, SW-NE
Address range: 1 to 99
Directions: E-W, N-S, SE-NW, SW-NE
Address range: 1 to 99