Sea Cliff neighborhood in San Francisco, California (CA), 94121, 94129 detailed profile
Settings
X


Business Search - 14 Million verified businesses
Area: 0.143 square miles
Population: 761
Population density:
| Sea Cliff: | 5,322 people per square mile |
| San Francisco: | 17,313 people per square mile |

- 35843.8%White
- 27033.0%Asian
- 607.3%Black
- 546.6%Two or more races
- 516.2%Hispanic or Latino
- 172.1%Some other race
- 40.5%Native Hawaiian and Other
Pacific Islander - 30.4%American Indian

Median household income in 2022:
| Sea Cliff: | $209,189 |
| San Francisco: | $136,692 |
Distribution of median household income
![Distribution of median household income]()
- 11Less than $10,000
- 182$10,000 to $19,999
- 97$20,000 to $29,999
- 63$30,000 to $39,999
- 6$40,000 to $49,999
- 19$50,000 to $59,999
- 29$60,000 to $74,999
- 23$75,000 to $99,999
- 21$100,000 to $124,999
- 25$125,000 to $149,999
- 35$150,000 to $199,999
- 166$200,000 or more

Distribution of owner-occupied house/condo value
![Distribution of owner-occupied house/condo value]()
- 7$100,000 to $149,999
- 7$200,000 to $249,999
- 9$400,000 to $499,999
- 6$500,000 to $749,999
- 36$750,000 to $999,999
- 218$1,000,000 or more

Distribution of rent paid by renters
![Distribution of rent paid by renters]()
- 13$100 to $199
- 128$200 to $299
- 48$400 to $499
- 12$500 to $599
- 67$700 to $799
- 6$800 to $899
- 55$900 to $999
- 27$1,000 to $1,249
- 18$1,250 to $1,499
- 64$1,500 to $1,999
- 52$2,000 or more

Median rent in 2022:
| Sea Cliff: | $2,879 |
| San Francisco: | $2,001 |
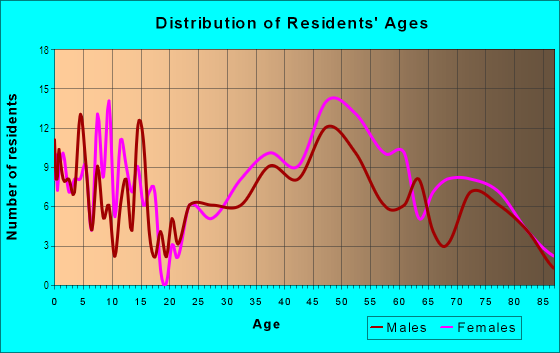
| Males: | 354 |
| Females: | 406 |
Males:
| This neighborhood: | 40.2 years |
| Whole city: | 40.3 years |
| This neighborhood: | 43.4 years |
| Whole city: | 40.5 years |
Average household size:
| Sea Cliff: | 2.6 people |
| San Francisco: | 2.2 people |
Percentage of family households:
| Sea Cliff: | 40.9% |
| San Francisco: | 30.3% |
| Here: | 60.2% |
| San Francisco: | 35.3% |
Percentage of married-couple families with children (among all households):
| Sea Cliff: | 32.0% |
| San Francisco: | 35.9% |
Percentage of single-mother households (among all households):
| Sea Cliff: | 6.0% |
| San Francisco: | 6.0% |
Percentage of never married males 15 years old and over:
Percentage of never married females 15 years old and over:
| Sea Cliff: | 11.0% |
| San Francisco: | 24.6% |
Percentage of never married females 15 years old and over:
| Sea Cliff: | 14.8% |
| city: | 19.9% |
Percentage of people that speak English not well or not at all:
| Sea Cliff: | 4.0% |
| San Francisco: | 10.9% |
Percentage of people born in this state:
Percentage of people born in another U.S. state:
Percentage of native residents but born outside the U.S.:
Percentage of foreign born residents:
| Here: | 47.3% |
| San Francisco: | 40.8% |
Percentage of people born in another U.S. state:
| Sea Cliff: | 27.0% |
| San Francisco: | 23.4% |
Percentage of native residents but born outside the U.S.:
| Here: | 1.4% |
| city: | 2.6% |
Percentage of foreign born residents:
| Here: | 24.4% |
| San Francisco: | 33.2% |

Owner-occupied
Renter-occupied


- Rooms in owner-occupied houses and condos in Sea Cliff
- 01 room
- 02 rooms
- 733 rooms
- 194 rooms
- 205 rooms
- 166 rooms
- 277 rooms
- 448 rooms
- 1189+ rooms

- Rooms in renter-occupied apartments in Sea Cliff
- 181 room
- 692 rooms
- 703 rooms
- 274 rooms
- 205 rooms
- 156 rooms
- 77 rooms
- 108 rooms
- 99+ rooms
Owner-occupied
Renter-occupied

- Bedrooms in owner-occupied houses and condos in Sea Cliff
- 0no bedroom
- 731 bedroom
- 122 bedrooms
- 723 bedrooms
- 854 bedrooms
- 565+ bedrooms

- Bedrooms in renter-occupied apartments in Sea Cliff
- 64no bedroom
- 861 bedroom
- 432 bedrooms
- 103 bedrooms
- 54 bedrooms
- 305+ bedrooms
Average number of cars or other vehicles available in houses/condos:
Average number of cars or other vehicles available in apartments:
| This neighborhood: | |
| San Francisco: |
Average number of cars or other vehicles available in apartments:
| Here: | 1.2 |
| city: | 0.8 |
Percentage of units with a mortgage:
| Sea Cliff: | 57.8% |
| San Francisco: | 62.3% |

- Year house built in Sea Cliff
- 02020 or later
- 372010 to 2019
- 122000 to 2009
- 91990 to 1999
- 2281980 to 1989
- 61970 to 1979
- 121960 to 1969
- 141950 to 1959
- 541940 to 1949
- 2241939 or earlier

City-data.com crime index for city in 2020 (higher means more crime):
| City: | 387.4 |
| U.S. average: | 219.5 |
Travel time to work (commute)
![Travel time to work (commute)]()
- 5Less than 5 minutes
- 105 to 9 minutes
- 1010 to 14 minutes
- 4315 to 19 minutes
- 3020 to 24 minutes
- 2825 to 29 minutes
- 5130 to 34 minutes
- 735 to 39 minutes
- 1940 to 44 minutes
- 2345 to 59 minutes
- 2360 to 89 minutes
- 290 or more minutes

Means of transportation to work
![Means of transportation to work]()
- 53.5%198Drove a car alone
- 3.2%12Carpooled
- 9.2%34Bus
- 0.5%2Subway or elevated rail
- 2.7%10Light rail, streetcar or trolley
- 1.9%7Taxi
- 6.8%25Bicycle
- 2.7%10Walked
- 0.8%3Other means
- 35.4%131Worked at home

Time leaving home to go to work
![Time leaving home to go to work]()
- 712:00 a.m. to 4:59 a.m.
- 105:00 a.m. to 5:29 a.m.
- 35:30 a.m. to 5:59 a.m.
- 76:00 a.m. to 6:29 a.m.
- 256:30 a.m. to 6:59 a.m.
- 297:00 a.m. to 7:29 a.m.
- 287:30 a.m. to 7:59 a.m.
- 548:00 a.m. to 8:29 a.m.
- 268:30 a.m. to 8:59 a.m.
- 279:00 a.m. to 9:59 a.m.
- 1410:00 a.m. to 10:59 a.m.
- 111:00 a.m. to 11:59 a.m.
- 1612:00 p.m. to 3:59 p.m.
- 74:00 p.m. to 11:59 p.m.

Occupations of males:
- Percentage of males in management occupations (except farmers):
Here: 30.0% city: 17.2%
- Percentage of males in business and financial operations occupations:
Here: 4.3% city: 8.9%
- Percentage of males in computer and mathematical occupations:
Here: 5.9% city: 14.6%
- Percentage of males in life, physical, and social science occupations:
Here: 3.5% city: 2.4%
- Percentage of males in legal occupations:
Here: 3.6% city: 2.5%
- Percentage of males in education, training, and library occupations:
Here: 1.5% city: 3.4%
- Percentage of males in arts, design, entertainment, sports, and media occupations:
Here: 7.7% city: 4.9%
- Percentage of males in healthcare practitioners and technical occupations:
Here: 9.8% city: 3.2%
- Percentage of males in service occupations:
Here: 9.7% city: 11.8%
- Percentage of males in sales and office occupations:
Here: 17.8% city: 13.5%
- Percentage of males in material moving occupations:
Here: 2.5% city: 1.8%
Occupations of females:
- Percentage of females in management occupations (except farmers):
Here: 35.8% city: 15.8%
- Percentage of females in business and financial operations occupations:
Here: 11.2% city: 11.5%
- Percentage of females in computer and mathematical occupations:
Here: 4.6% city: 5.1%
- Percentage of females in legal occupations:
Here: 1.7% city: 3.0%
- Percentage of females in education, training, and library occupations:
Here: 6.0% city: 7.1%
- Percentage of females in arts, design, entertainment, sports, and media occupations:
Here: 5.4% city: 5.1%
- Percentage of females in healthcare practitioners and technical occupations:
Here: 8.7% city: 8.4%
- Percentage of females in service occupations:
Here: 5.1% city: 15.4%
- Percentage of females in sales and office occupations:
Here: 16.0% city: 19.3%
- Percentage of females in transportation occupations:
Here: 5.1% city: 0.8%
Education in this neighborhood (subdivision or community):
- Percentage of people 3 years and older in K-12 schools:
Sea Cliff: 17.5% San Francisco: 9.7%
- Percentage of people 3 years and older in undergraduate colleges:
Sea Cliff: 3.7% San Francisco: 4.8%
- Percentage of people 3 years and older in grad. or professional schools:
Sea Cliff: 2.2% San Francisco: 2.6%
- Percentage of students K-12 enrolled in private schools:
Sea Cliff: 88.4% San Francisco: 36.5%
Percentage of population below poverty level:
| Sea Cliff: | 3.7% |
| San Francisco: | 10.4% |
Median year renter moved in (as recorded in 2022):
| Sea Cliff: | 2012 |
| San Francisco: | 2019 |
Percentage of married-couple families with both working:
| Sea Cliff: | 66.3% |
| San Francisco: | 75.9% |

- 64.6%Utility gas
- 25.3%Electricity
- 7.1%Bottled, tank, or LP gas
- 1.6%No fuel used
- 1.4%Other fuel
Roads and streets:
el Camino del Mar
Length: 0.78 miles
Directions: E-W, N-S, SE-NW, SW-NE
Address range: 100 to 799
Directions: E-W, N-S, SE-NW, SW-NE
Address range: 100 to 799
Lake St
Length: 0.52 miles
Directions: E-W, N-S, SE-NW, SW-NE
Address range: 2633 to 2999
Directions: E-W, N-S, SE-NW, SW-NE
Address range: 2633 to 2999
Sea Cliff Ave
Length: 0.50 miles
Directions: E-W, N-S, SW-NE
Address range: 1 to 499
Directions: E-W, N-S, SW-NE
Address range: 1 to 499
California St
Length: 0.30 miles
Direction: E-W
Address range: 6600 to 6999
Direction: E-W
Address range: 6600 to 6999
25th Ave
Length: 0.25 miles
Directions: E-W, N-S, SE-NW, SW-NE
Address range: 1 to 99
Directions: E-W, N-S, SE-NW, SW-NE
Address range: 1 to 99
28th Ave
Length: 0.24 miles
Directions: N-S, SE-NW
Address range: 100 to 299
Directions: N-S, SE-NW
Address range: 100 to 299
30th Ave
Length: 0.18 miles
Direction: N-S
Address range: 100 to 299
Direction: N-S
Address range: 100 to 299
29th Ave
Length: 0.18 miles
Direction: N-S
Address range: 100 to 299
Direction: N-S
Address range: 100 to 299
McLaren Ave
Length: 0.13 miles
Direction: E-W
Address range: 1 to 99
Direction: E-W
Address range: 1 to 99
Easement
Length: 0.11 miles
Directions: E-W, SE-NW, SW-NE
Directions: E-W, SE-NW, SW-NE
26th Ave
Length: 0.10 miles
Directions: N-S, SE-NW
Address range: 1 to 99
Directions: N-S, SE-NW
Address range: 1 to 99
Sea View Ter (Seaview Ter)
Length: 0.10 miles
Direction: E-W
Address range: 1 to 99
Direction: E-W
Address range: 1 to 99
27th Ave
Length: 0.10 miles
Directions: N-S, SE-NW
Address range: 1 to 99
Directions: N-S, SE-NW
Address range: 1 to 99
Scenic Way
Length: 0.07 miles
Direction: E-W
Address range: 1 to 99
Direction: E-W
Address range: 1 to 99
32nd Ave
Length: 0.05 miles
Direction: N-S
Address range: 200 to 299
Direction: N-S
Address range: 200 to 299
31st Ave
Length: 0.04 miles
Direction: N-S
Address range: 200 to 299
Direction: N-S
Address range: 200 to 299