Shadow Valley Condominiums neighborhood in High Point, North Carolina (NC), 27262 detailed profile
Settings
X


Business Search - 14 Million verified businesses
Area: 0.011 square miles
Population: 11
Population density:
| Shadow Valley Condominiums: | 1,027 people per square mile |
| High Point: | 2,331 people per square mile |

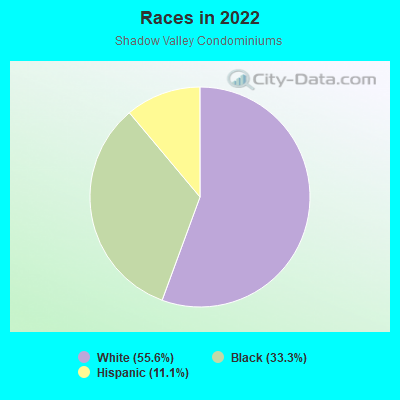
- 555.6%White
- 333.3%Black
- 111.1%Hispanic or Latino
Median household income in 2022:
| Shadow Valley Condominiums: | $78,472 |
| High Point: | $63,930 |
Distribution of median household income
![Distribution of median household income]()
- 1Less than $10,000
- 1$10,000 to $19,999
- 1$20,000 to $29,999
- 1$30,000 to $39,999
- 1$40,000 to $49,999
- 1$50,000 to $59,999
- 1$60,000 to $74,999
- 1$75,000 to $99,999
- 1$100,000 to $124,999
- 1$125,000 to $149,999
- 1$150,000 to $199,999
- 1$200,000 or more

Distribution of owner-occupied house/condo value
![Distribution of owner-occupied house/condo value]()
- 1$100,000 to $149,999
- 1$150,000 to $199,999
- 1$200,000 to $249,999
- 1$250,000 to $299,999
- 1$300,000 to $399,999
- 1$400,000 to $499,999
- 1$500,000 to $749,999
- 1$1,000,000 or more

Distribution of rent paid by renters
![Distribution of rent paid by renters]()
- 1$500 to $599
- 1$600 to $699
- 1$800 to $899
- 1$900 to $999
- 1$1,000 to $1,249
- 1$1,250 to $1,499
- 1$1,500 to $1,999

Median rent in 2022:
| Shadow Valley Condominiums: | $914 |
| High Point: | $903 |
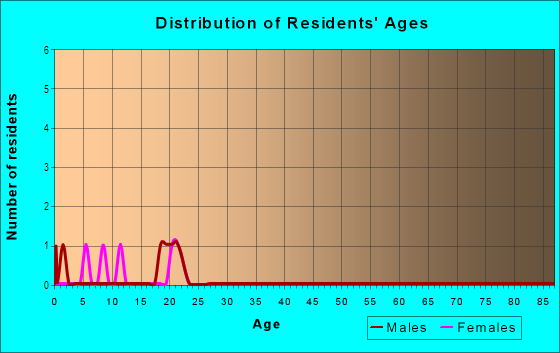
| Males: | 3 |
| Females: | 7 |
Males:
| This neighborhood: | 55.6 years |
| Whole city: | 38.7 years |
| This neighborhood: | 47.1 years |
| Whole city: | 39.1 years |
Average household size:
| Shadow Valley Condominiums: | 29.0 people |
| High Point: | 2.3 people |
Percentage of family households:
| Shadow Valley Condominiums: | 35.6% |
| High Point: | 44.6% |
| Here: | 41.0% |
| High Point: | 44.9% |
Percentage of married-couple families with children (among all households):
| Shadow Valley Condominiums: | 15.5% |
| High Point: | 26.6% |
Percentage of single-mother households (among all households):
| Shadow Valley Condominiums: | 33.1% |
| High Point: | 11.0% |
Percentage of never married males 15 years old and over:
Percentage of never married females 15 years old and over:
| Shadow Valley Condominiums: | 8.0% |
| High Point: | 16.8% |
Percentage of never married females 15 years old and over:
| Shadow Valley Condominiums: | 18.6% |
| city: | 19.7% |
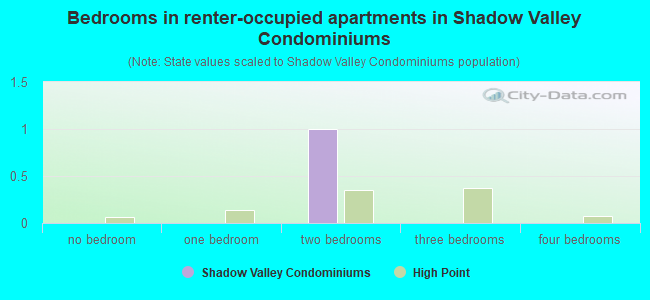
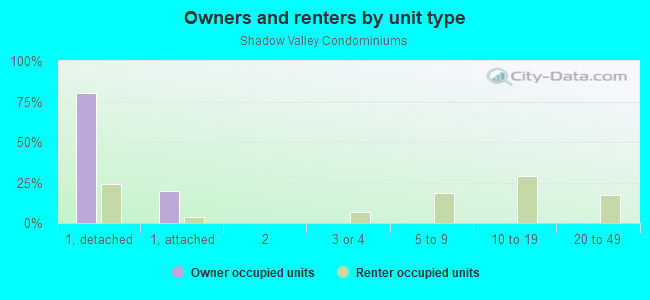
- Bedrooms in renter-occupied apartments in Shadow Valley Condominiums
- 0no bedroom
- 01 bedroom
- 12 bedrooms
- 03 bedrooms
- 04 bedrooms
- 05+ bedrooms
Average number of cars or other vehicles available in houses/condos:
Average number of cars or other vehicles available in apartments:
| This neighborhood: | 2.1 |
| High Point: | 2.0 |
Average number of cars or other vehicles available in apartments:
| Here: | 1.2 |
| city: | 1.4 |
Percentage of units with a mortgage:
| Shadow Valley Condominiums: | 68.3% |
| High Point: | 65.9% |
Housing prices:
- Average estimated value of detached houses in 2022 (40.0% of all units):
Shadow Valley Condominiums: $366,247 High Point: $217,224
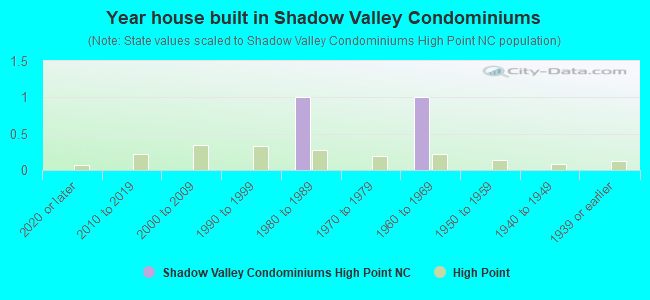
- Year house built in Shadow Valley Condominiums
- 02020 or later
- 02010 to 2019
- 02000 to 2009
- 01990 to 1999
- 11980 to 1989
- 01970 to 1979
- 11960 to 1969
- 01950 to 1959
- 01940 to 1949
- 01939 or earlier
City-data.com crime index for city in 2020 (higher means more crime):
| City: | 329.1 |
| U.S. average: | 219.5 |
Means of transportation to work
![Means of transportation to work]()
- 78.8%5Drove a car alone

Occupations of males:
- Percentage of males in management occupations (except farmers):
Here: 9.0% city: 11.2%
- Percentage of males in business and financial operations occupations:
Here: 8.6% city: 4.4%
- Percentage of males in computer and mathematical occupations:
Here: 3.5% city: 3.5%
- Percentage of males in architecture and engineering occupations:
Here: 3.0% city: 3.7%
- Percentage of males in healthcare practitioners and technical occupations:
Here: 15.8% city: 2.8%
- Percentage of males in service occupations:
Here: 7.4% city: 11.2%
- Percentage of males in sales and office occupations:
Here: 15.5% city: 17.9%
- Percentage of males in construction, extraction, and maintenance occupations:
Here: 2.8% city: 7.1%
- Percentage of males in transportation occupations:
Here: 15.5% city: 6.2%
- Percentage of males in material moving occupations:
Here: 12.8% city: 7.7%
Occupations of females:
- Percentage of females in management occupations (except farmers):
Here: 12.0% city: 9.0%
- Percentage of females in business and financial operations occupations:
Here: 20.7% city: 7.7%
- Percentage of females in healthcare practitioners and technical occupations:
Here: 20.1% city: 9.1%
- Percentage of females in service occupations:
Here: 20.3% city: 20.7%
- Percentage of females in sales and office occupations:
Here: 16.8% city: 25.2%
- Percentage of females in production occupations:
Here: 10.1% city: 5.0%
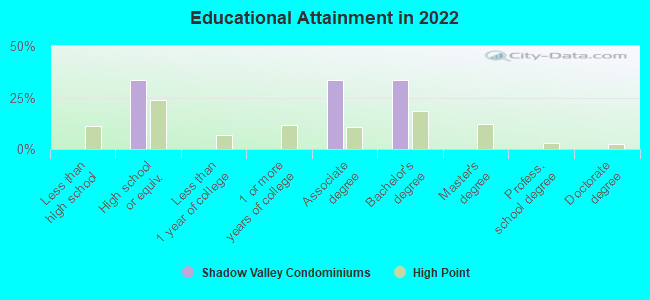
Education in this neighborhood (subdivision or community):
- Percentage of people 3 years and older in K-12 schools:
Shadow Valley Condominiums: 0.0% High Point: 16.8%
- Percentage of people 3 years and older in undergraduate colleges:
Shadow Valley Condominiums: 0.0% High Point: 9.4%
- Percentage of people 3 years and older in grad. or professional schools:
Shadow Valley Condominiums: 0.0% High Point: 1.0%
Median year owner moved in (as recorded in 2022):
Median year renter moved in (as recorded in 2022):
| Shadow Valley Condominiums: | 2006 |
| High Point: | 2012 |
Median year renter moved in (as recorded in 2022):
| Shadow Valley Condominiums: | 2015 |
| High Point: | 2019 |
Percentage of married-couple families with both working:
| Shadow Valley Condominiums: | 100.0% |
| High Point: | 69.4% |
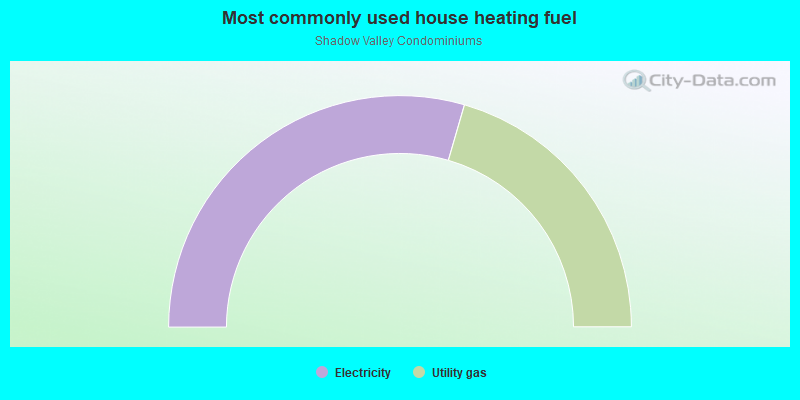
- 59.0%Electricity
- 41.0%Utility gas