Shalimar neighborhood in Tempe, Arizona (AZ), 85282 detailed profile
Settings
X


Business Search - 14 Million verified businesses
Area: 0.249 square miles
Population: 984
Population density:
| Shalimar: | 3,955 people per square mile |
| Tempe: | 4,641 people per square mile |

- 78774.2%White
- 847.9%Hispanic or Latino
- 736.9%Asian
- 545.1%American Indian
- 272.5%Two or more races
- 242.3%Some other race
- 111.0%Black

Median household income in 2022:
| Shalimar: | $89,033 |
| Tempe: | $76,007 |
Distribution of median household income
![Distribution of median household income]()
- 9Less than $10,000
- 12$10,000 to $19,999
- 13$20,000 to $29,999
- 14$30,000 to $39,999
- 54$40,000 to $49,999
- 78$50,000 to $59,999
- 47$60,000 to $74,999
- 45$75,000 to $99,999
- 43$100,000 to $124,999
- 19$125,000 to $149,999
- 111$150,000 to $199,999
- 52$200,000 or more

Distribution of owner-occupied house/condo value
![Distribution of owner-occupied house/condo value]()
- 7Less than $50,000
- 6$50,000 to $99,999
- 33$150,000 to $199,999
- 32$200,000 to $249,999
- 6$250,000 to $299,999
- 110$300,000 to $399,999
- 106$400,000 to $499,999
- 90$500,000 to $749,999
- 17$750,000 to $999,999
- 3$1,000,000 or more

Distribution of rent paid by renters
![Distribution of rent paid by renters]()
- 2Less than $100
- 6$700 to $799
- 8$800 to $899
- 14$900 to $999
- 17$1,000 to $1,249
- 5$1,250 to $1,499
- 28$1,500 to $1,999
- 77$2,000 or more

Median rent in 2022:
| Shalimar: | $1,683 |
| Tempe: | $1,566 |
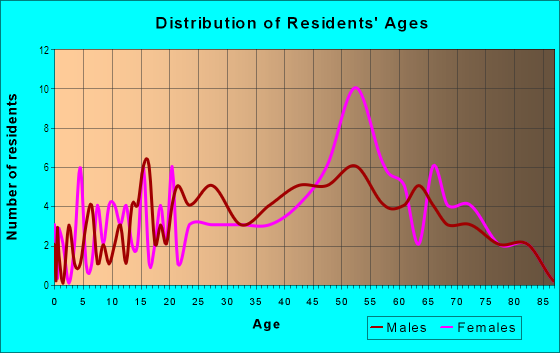
| Males: | 470 |
| Females: | 514 |
Males:
| This neighborhood: | 42.3 years |
| Whole city: | 28.9 years |
| This neighborhood: | 44.9 years |
| Whole city: | 30.5 years |
Average household size:
| Shalimar: | 2.4 people |
| Tempe: | 2.3 people |
Percentage of family households:
| Shalimar: | 41.0% |
| Tempe: | 36.3% |
| Here: | 68.0% |
| Tempe: | 32.6% |
Percentage of married-couple families with children (among all households):
| Shalimar: | 45.8% |
| Tempe: | 26.9% |
Percentage of single-mother households (among all households):
| Shalimar: | 5.2% |
| Tempe: | 8.3% |
Percentage of never married males 15 years old and over:
Percentage of never married females 15 years old and over:
| Shalimar: | 8.6% |
| Tempe: | 32.9% |
Percentage of never married females 15 years old and over:
| Shalimar: | 6.9% |
| city: | 21.7% |
Percentage of people that speak English not well or not at all:
| Shalimar: | 0.4% |
| Tempe: | 2.0% |
Percentage of people born in this state:
Percentage of people born in another U.S. state:
Percentage of native residents but born outside the U.S.:
Percentage of foreign born residents:
| Here: | 39.8% |
| Tempe: | 39.3% |
Percentage of people born in another U.S. state:
| Shalimar: | 45.2% |
| Tempe: | 46.0% |
Percentage of native residents but born outside the U.S.:
| Here: | 2.0% |
| city: | 1.8% |
Percentage of foreign born residents:
| Here: | 13.0% |
| Tempe: | 12.9% |

Owner-occupied
Renter-occupied


- Rooms in owner-occupied houses and condos in Shalimar
- 11 room
- 22 rooms
- 33 rooms
- 794 rooms
- 425 rooms
- 1396 rooms
- 267 rooms
- 418 rooms
- 579+ rooms

- Rooms in renter-occupied apartments in Shalimar
- 31 room
- 72 rooms
- 83 rooms
- 194 rooms
- 155 rooms
- 266 rooms
- 107 rooms
- 158 rooms
- 129+ rooms
Owner-occupied
Renter-occupied

- Bedrooms in owner-occupied houses and condos in Shalimar
- 1no bedroom
- 21 bedroom
- 1532 bedrooms
- 1333 bedrooms
- 864 bedrooms
- 165+ bedrooms

- Bedrooms in renter-occupied apartments in Shalimar
- 3no bedroom
- 111 bedroom
- 242 bedrooms
- 263 bedrooms
- 104 bedrooms
- 25+ bedrooms
Average number of cars or other vehicles available in houses/condos:
Average number of cars or other vehicles available in apartments:
| This neighborhood: | 1.7 |
| Tempe: | 2.0 |
Average number of cars or other vehicles available in apartments:
| Here: | 2.0 |
| city: | 1.6 |
Percentage of units with a mortgage:
| Shalimar: | 54.4% |
| Tempe: | 69.2% |
Housing prices:
- Average estimated value of detached houses in 2022 (56.4% of all units):
Shalimar: $441,351 Tempe: $535,475
- Average estimated value of townhouses or other attached units in 2022 (43.4% of all units):
This neighborhood: $382,078 city: $325,212

- Year house built in Shalimar
- 02020 or later
- 82010 to 2019
- 52000 to 2009
- 51990 to 1999
- 811980 to 1989
- 2371970 to 1979
- 1861960 to 1969
- 81950 to 1959
- 01940 to 1949
- 01939 or earlier

City-data.com crime index for city in 2020 (higher means more crime):
| City: | 347.1 |
| U.S. average: | 219.5 |
Travel time to work (commute)
![Travel time to work (commute)]()
- 6Less than 5 minutes
- 315 to 9 minutes
- 5710 to 14 minutes
- 12015 to 19 minutes
- 8520 to 24 minutes
- 2425 to 29 minutes
- 3330 to 34 minutes
- 435 to 39 minutes
- 1040 to 44 minutes
- 2245 to 59 minutes
- 2560 to 89 minutes
- 290 or more minutes

Means of transportation to work
![Means of transportation to work]()
- 86.3%382Drove a car alone
- 1.1%5Carpooled
- 1.6%7Bus
- 2.0%9Light rail, streetcar or trolley
- 1.1%5Motorcycle
- 2.0%9Bicycle
- 3.2%14Walked
- 1.8%8Other means
- 9.9%44Worked at home

Time leaving home to go to work
![Time leaving home to go to work]()
- 4912:00 a.m. to 4:59 a.m.
- 135:00 a.m. to 5:29 a.m.
- 325:30 a.m. to 5:59 a.m.
- 356:00 a.m. to 6:29 a.m.
- 306:30 a.m. to 6:59 a.m.
- 557:00 a.m. to 7:29 a.m.
- 287:30 a.m. to 7:59 a.m.
- 458:00 a.m. to 8:29 a.m.
- 258:30 a.m. to 8:59 a.m.
- 199:00 a.m. to 9:59 a.m.
- 1010:00 a.m. to 10:59 a.m.
- 111:00 a.m. to 11:59 a.m.
- 2212:00 p.m. to 3:59 p.m.
- 424:00 p.m. to 11:59 p.m.

Occupations of males:
- Percentage of males in management occupations (except farmers):
Here: 11.8% city: 10.2%
- Percentage of males in business and financial operations occupations:
Here: 31.2% city: 6.5%
- Percentage of males in computer and mathematical occupations:
Here: 5.2% city: 8.4%
- Percentage of males in architecture and engineering occupations:
Here: 12.6% city: 5.0%
- Percentage of males in community and social services occupations:
Here: 2.6% city: 1.1%
- Percentage of males in education, training, and library occupations:
Here: 5.8% city: 6.1%
- Percentage of males in healthcare practitioners and technical occupations:
Here: 5.2% city: 2.8%
- Percentage of males in service occupations:
Here: 4.9% city: 14.4%
- Percentage of males in sales and office occupations:
Here: 13.8% city: 19.0%
- Percentage of males in transportation occupations:
Here: 4.3% city: 3.9%
- Percentage of males in material moving occupations:
Here: 2.6% city: 3.5%
Occupations of females:
- Percentage of females in management occupations (except farmers):
Here: 18.4% city: 7.5%
- Percentage of females in business and financial operations occupations:
Here: 15.7% city: 9.3%
- Percentage of females in computer and mathematical occupations:
Here: 3.4% city: 3.3%
- Percentage of females in architecture and engineering occupations:
Here: 2.5% city: 0.9%
- Percentage of females in life, physical, and social science occupations:
Here: 2.2% city: 1.5%
- Percentage of females in education, training, and library occupations:
Here: 9.5% city: 12.0%
- Percentage of females in arts, design, entertainment, sports, and media occupations:
Here: 10.4% city: 3.1%
- Percentage of females in healthcare practitioners and technical occupations:
Here: 16.3% city: 7.4%
- Percentage of females in service occupations:
Here: 5.6% city: 18.9%
- Percentage of females in sales and office occupations:
Here: 18.5% city: 26.9%
- Percentage of females in material moving occupations:
Here: 1.5% city: 1.4%
Education in this neighborhood (subdivision or community):
- Percentage of people 3 years and older in K-12 schools:
Shalimar: 11.1% Tempe: 12.5%
- Percentage of people 3 years and older in undergraduate colleges:
Shalimar: 2.5% Tempe: 15.4%
- Percentage of people 3 years and older in grad. or professional schools:
Shalimar: 2.5% Tempe: 6.3%
- Percentage of students K-12 enrolled in private schools:
Shalimar: 23.4% Tempe: 9.2%
Percentage of population below poverty level:
| Shalimar: | 8.7% |
| Tempe: | 15.0% |
Median year owner moved in (as recorded in 2022):
Median year renter moved in (as recorded in 2022):
| Shalimar: | 2001 |
| Tempe: | 2013 |
Median year renter moved in (as recorded in 2022):
| Shalimar: | 2016 |
| Tempe: | 2022 |
Percentage of married-couple families with both working:
| Shalimar: | 71.0% |
| Tempe: | 77.6% |

- 65.3%Electricity
- 28.2%Utility gas
- 2.0%Other fuel
- 1.4%No fuel used
- 1.2%Fuel oil, kerosene, etc.
- 1.1%Solar energy
- 0.8%Bottled, tank, or LP gas
Roads and streets:
E Golf Ave
Length: 0.49 miles
Directions: E-W, SW-NE
Address range: 2032 to 2199
Directions: E-W, SW-NE
Address range: 2032 to 2199
E Southern Ave
Length: 0.47 miles
Direction: E-W
Address range: 2030 to 2199
Direction: E-W
Address range: 2030 to 2199
S Fairway Dr
Length: 0.45 miles
Directions: E-W, N-S, SE-NW, SW-NE
Address range: 2800 to 3199
Directions: E-W, N-S, SE-NW, SW-NE
Address range: 2800 to 3199
S Price Rd
Length: 0.38 miles
Direction: N-S
Address range: 2873 to 3299
Direction: N-S
Address range: 2873 to 3299
E Balboa Dr
Length: 0.37 miles
Directions: E-W, SW-NE
Address range: 2074 to 2199
Directions: E-W, SW-NE
Address range: 2074 to 2199
S Bala Dr
Length: 0.27 miles
Directions: N-S, SW-NE
Address range: 2800 to 2999
Directions: N-S, SW-NE
Address range: 2800 to 2999
E Cairo Dr
Length: 0.18 miles
Directions: E-W, SW-NE
Address range: 2100 to 2199
Directions: E-W, SW-NE
Address range: 2100 to 2199
S River Dr
Length: 0.13 miles
Directions: N-S, SW-NE
Address range: 2700 to 3299
Directions: N-S, SW-NE
Address range: 2700 to 3299
E Geneva Dr
Length: 0.12 miles
Directions: E-W, SW-NE
Address range: 2100 to 2199
Directions: E-W, SW-NE
Address range: 2100 to 2199
S Fairfield Dr
Length: 0.12 miles
Directions: N-S, SW-NE
Address range: 3100 to 3299
Directions: N-S, SW-NE
Address range: 3100 to 3299
E Huntington Dr
Length: 0.08 miles
Direction: E-W
Address range: 2100 to 2199
Direction: E-W
Address range: 2100 to 2199
S Hansen Cir
Length: 0.07 miles
Directions: N-S, SE-NW
Address range: 3100 to 3132
Directions: N-S, SE-NW
Address range: 3100 to 3132
S Golf Dr
Length: 0.03 miles
Directions: N-S, SW-NE
Address range: 3100 to 3199
Directions: N-S, SW-NE
Address range: 3100 to 3199
E Cairo Cir
Length: 0.03 miles
Direction: E-W
Address range: 2100 to 2199
Direction: E-W
Address range: 2100 to 2199
S Golf Ave
Length: 0.02 miles
Direction: SE-NW
Address range: 3100 to 3129
Direction: SE-NW
Address range: 3100 to 3129