Sherman Avenue neighborhood in Springfield, Missouri (MO), 65802 detailed profile
Settings
X


Business Search - 14 Million verified businesses
Area: 0.228 square miles
Population: 691
Population density:
| Sherman Avenue: | 3,027 people per square mile |
| Springfield: | 2,325 people per square mile |

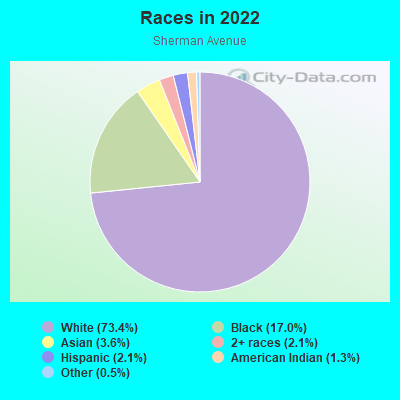
- 55673.4%White
- 12917.0%Black
- 273.6%Asian
- 162.1%Two or more races
- 162.1%Hispanic or Latino
- 101.3%American Indian
- 40.5%Some other race
Distribution of median household income
![Distribution of median household income]()
- 62Less than $10,000
- 37$10,000 to $19,999
- 32$20,000 to $29,999
- 28$30,000 to $39,999
- 25$40,000 to $49,999
- 23$50,000 to $59,999
- 23$60,000 to $74,999
- 21$75,000 to $99,999
- 7$100,000 to $124,999
- 12$125,000 to $149,999
- 4$150,000 to $199,999
- 84$200,000 or more

Distribution of owner-occupied house/condo value
![Distribution of owner-occupied house/condo value]()
- 29$50,000 to $99,999
- 47$100,000 to $149,999
- 24$150,000 to $199,999
- 99$200,000 to $249,999
- 18$300,000 to $399,999
- 4$400,000 to $499,999

Distribution of rent paid by renters
![Distribution of rent paid by renters]()
- 11$200 to $299
- 5$300 to $399
- 23$400 to $499
- 24$500 to $599
- 88$600 to $699
- 28$700 to $799
- 23$800 to $899
- 12$900 to $999
- 10$1,000 to $1,249
- 22$2,000 or more

Median rent in 2022:
| Sherman Avenue: | $671 |
| Springfield: | $736 |
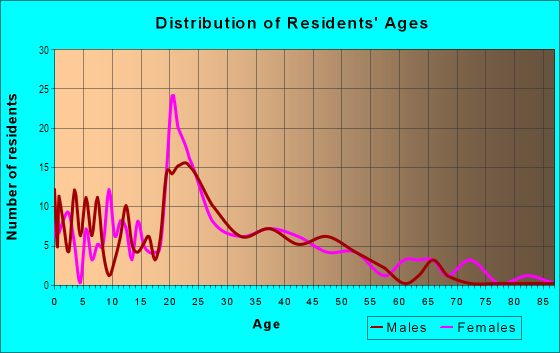
| Males: | 441 |
| Females: | 249 |
Males:
| This neighborhood: | 37.0 years |
| Whole city: | 31.4 years |
| This neighborhood: | 35.5 years |
| Whole city: | 36.2 years |
Average household size:
| Sherman Avenue: | 1.9 people |
| Springfield: | 28.0 people |
Percentage of family households:
| Sherman Avenue: | 19.9% |
| Springfield: | 34.9% |
| Here: | 31.1% |
| Springfield: | 32.5% |
Percentage of married-couple families with children (among all households):
| Sherman Avenue: | 14.1% |
| Springfield: | 22.1% |
Percentage of single-mother households (among all households):
| Sherman Avenue: | 5.4% |
| Springfield: | 19.0% |
Percentage of never married males 15 years old and over:
Percentage of never married females 15 years old and over:
| Sherman Avenue: | 40.2% |
| Springfield: | 21.8% |
Percentage of never married females 15 years old and over:
| Sherman Avenue: | 17.3% |
| city: | 19.1% |
Percentage of people that speak English not well or not at all:
| Sherman Avenue: | 0.0% |
| Springfield: | 0.7% |
Percentage of people born in this state:
Percentage of people born in another U.S. state:
Percentage of native residents but born outside the U.S.:
Percentage of foreign born residents:
| Here: | 58.3% |
| Springfield: | 57.7% |
Percentage of people born in another U.S. state:
| Sherman Avenue: | 37.5% |
| Springfield: | 36.1% |
Percentage of native residents but born outside the U.S.:
| Here: | 1.2% |
| city: | 1.0% |
Percentage of foreign born residents:
| Here: | 3.0% |
| Springfield: | 5.2% |
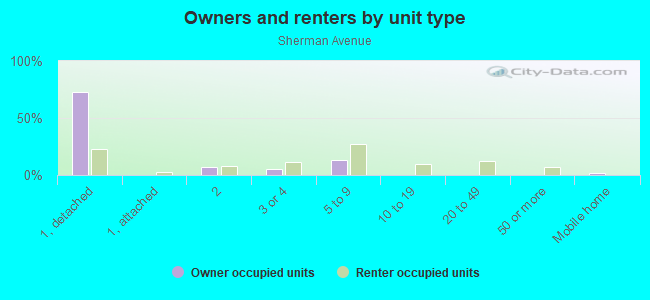
Owner-occupied
Renter-occupied

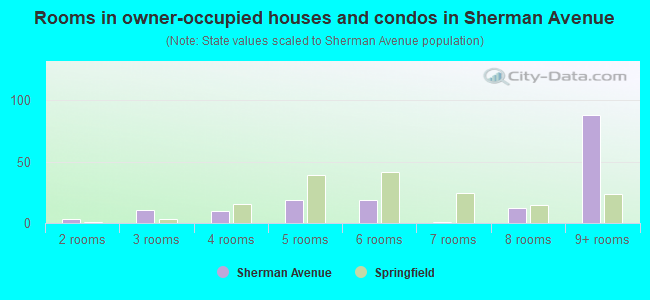
- Rooms in owner-occupied houses and condos in Sherman Avenue
- 01 room
- 32 rooms
- 113 rooms
- 104 rooms
- 195 rooms
- 196 rooms
- 17 rooms
- 128 rooms
- 889+ rooms
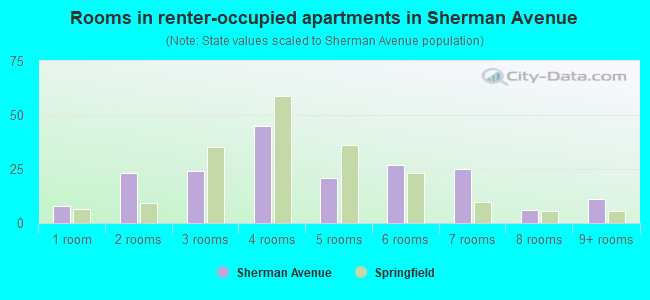
- Rooms in renter-occupied apartments in Sherman Avenue
- 81 room
- 232 rooms
- 243 rooms
- 454 rooms
- 215 rooms
- 276 rooms
- 257 rooms
- 68 rooms
- 119+ rooms
Owner-occupied
Renter-occupied
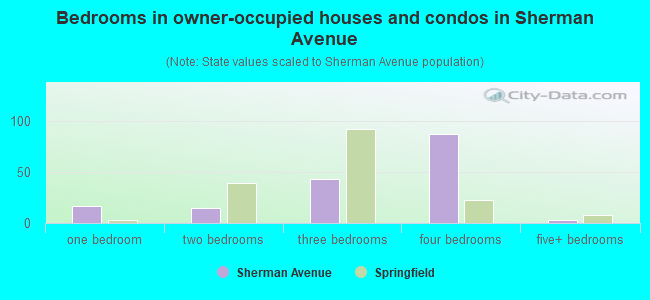
- Bedrooms in owner-occupied houses and condos in Sherman Avenue
- 0no bedroom
- 171 bedroom
- 152 bedrooms
- 433 bedrooms
- 874 bedrooms
- 35+ bedrooms
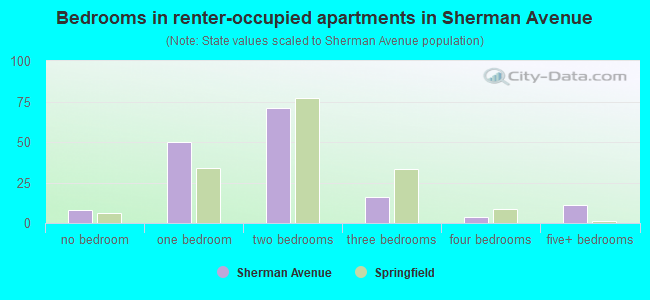
- Bedrooms in renter-occupied apartments in Sherman Avenue
- 8no bedroom
- 501 bedroom
- 712 bedrooms
- 163 bedrooms
- 44 bedrooms
- 115+ bedrooms
Average number of cars or other vehicles available in houses/condos:
Average number of cars or other vehicles available in apartments:
| This neighborhood: | |
| Springfield: |
Average number of cars or other vehicles available in apartments:
| Here: | 1.0 |
| city: | 1.2 |
Percentage of units with a mortgage:
| Sherman Avenue: | 60.7% |
| Springfield: | 58.6% |
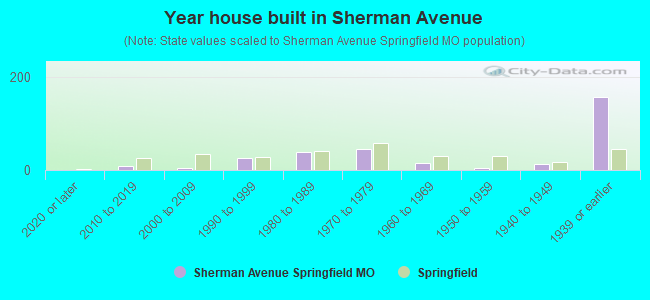
- Year house built in Sherman Avenue
- 02020 or later
- 82010 to 2019
- 52000 to 2009
- 261990 to 1999
- 381980 to 1989
- 451970 to 1979
- 161960 to 1969
- 51950 to 1959
- 131940 to 1949
- 1561939 or earlier
City-data.com crime index for city in 2020 (higher means more crime):
| City: | 751.2 |
| U.S. average: | 219.5 |
Travel time to work (commute)
![Travel time to work (commute)]()
- 28Less than 5 minutes
- 935 to 9 minutes
- 6910 to 14 minutes
- 11615 to 19 minutes
- 7820 to 24 minutes
- 1025 to 29 minutes
- 230 to 34 minutes
- 235 to 39 minutes
- 540 to 44 minutes
- 545 to 59 minutes
- 1090 or more minutes

Means of transportation to work
![Means of transportation to work]()
- 88.0%405Drove a car alone
- 8.0%37Carpooled
- 2.2%10Bus
- 4.8%22Taxi
- 5.9%27Walked
- 1.1%5Worked at home

Time leaving home to go to work
![Time leaving home to go to work]()
- 1812:00 a.m. to 4:59 a.m.
- 205:30 a.m. to 5:59 a.m.
- 266:00 a.m. to 6:29 a.m.
- 56:30 a.m. to 6:59 a.m.
- 487:00 a.m. to 7:29 a.m.
- 457:30 a.m. to 7:59 a.m.
- 268:00 a.m. to 8:29 a.m.
- 388:30 a.m. to 8:59 a.m.
- 289:00 a.m. to 9:59 a.m.
- 1010:00 a.m. to 10:59 a.m.
- 311:00 a.m. to 11:59 a.m.
- 7112:00 p.m. to 3:59 p.m.
- 764:00 p.m. to 11:59 p.m.

Occupations of males:
- Percentage of males in management occupations (except farmers):
Here: 2.3% city: 8.4%
- Percentage of males in community and social services occupations:
Here: 4.7% city: 2.6%
- Percentage of males in education, training, and library occupations:
Here: 9.3% city: 3.6%
- Percentage of males in service occupations:
Here: 15.8% city: 17.4%
- Percentage of males in sales and office occupations:
Here: 35.8% city: 19.3%
- Percentage of males in production occupations:
Here: 1.6% city: 8.4%
- Percentage of males in transportation occupations:
Here: 21.2% city: 5.7%
- Percentage of males in material moving occupations:
Here: 7.5% city: 6.6%
Occupations of females:
- Percentage of females in management occupations (except farmers):
Here: 65.5% city: 7.4%
- Percentage of females in business and financial operations occupations:
Here: 3.7% city: 6.6%
- Percentage of females in education, training, and library occupations:
Here: 3.7% city: 9.3%
- Percentage of females in arts, design, entertainment, sports, and media occupations:
Here: 4.2% city: 2.0%
- Percentage of females in service occupations:
Here: 7.1% city: 22.2%
- Percentage of females in sales and office occupations:
Here: 15.1% city: 29.8%
- Percentage of females in material moving occupations:
Here: 4.3% city: 2.6%
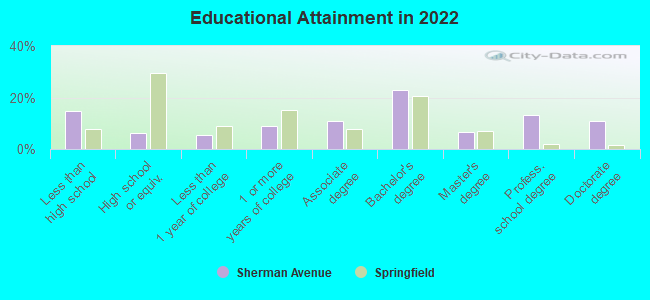
Education in this neighborhood (subdivision or community):
- Percentage of people 3 years and older in K-12 schools:
Sherman Avenue: 14.9% Springfield: 11.9%
- Percentage of people 3 years and older in undergraduate colleges:
Sherman Avenue: 21.3% Springfield: 9.9%
- Percentage of people 3 years and older in grad. or professional schools:
Sherman Avenue: 0.7% Springfield: 2.0%
- Percentage of students K-12 enrolled in private schools:
Sherman Avenue: 2.9% Springfield: 13.8%
Percentage of population below poverty level:
| Sherman Avenue: | 24.7% |
| Springfield: | 20.2% |
Median year renter moved in (as recorded in 2022):
| Sherman Avenue: | 2015 |
| Springfield: | 2020 |
Percentage of married-couple families with both working:
| Sherman Avenue: | 102.0% |
| Springfield: | 58.0% |
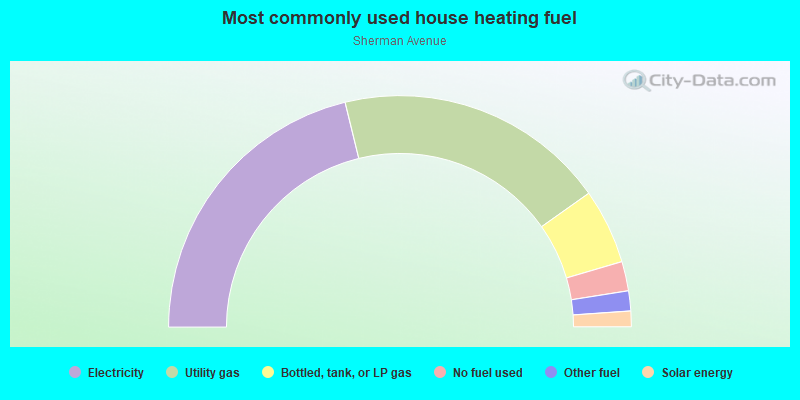
- 42.4%Electricity
- 38.0%Utility gas
- 10.5%Bottled, tank, or LP gas
- 4.1%No fuel used
- 2.8%Other fuel
- 2.2%Solar energy
Roads and streets:
N Sherman Ave
Length: 0.46 miles
Directions: E-W, N-S, SE-NW, SW-NE
Address range: 900 to 1399
Directions: E-W, N-S, SE-NW, SW-NE
Address range: 900 to 1399
N Hampton Ave
Length: 0.32 miles
Directions: E-W, N-S
Address range: 900 to 1299
Directions: E-W, N-S
Address range: 900 to 1299
E Lynn St
Length: 0.31 miles
Direction: E-W
Address range: 850 to 1099
Direction: E-W
Address range: 850 to 1099
E Central St
Length: 0.29 miles
Direction: E-W
Address range: 900 to 1134
Direction: E-W
Address range: 900 to 1134
E Webster St
Length: 0.26 miles
Direction: E-W
Address range: 850 to 1099
Direction: E-W
Address range: 850 to 1099
N Texas Ave
Length: 0.24 miles
Directions: E-W, N-S
Address range: 900 to 1399
Directions: E-W, N-S
Address range: 900 to 1399
E Pythian St
Length: 0.23 miles
Directions: E-W, N-S, SW-NE
Address range: 900 to 1134
Directions: E-W, N-S, SW-NE
Address range: 900 to 1134
E Calhoun St
Length: 0.22 miles
Directions: E-W, SW-NE
Address range: 850 to 1022
Directions: E-W, SW-NE
Address range: 850 to 1022
E Scott (E Scott St)
Length: 0.14 miles
Directions: E-W, N-S, SW-NE
Address range: 900 to 1099
Directions: E-W, N-S, SW-NE
Address range: 900 to 1099
N Florence Ave
Length: 0.12 miles
Direction: N-S
Address range: 900 to 999
Direction: N-S
Address range: 900 to 999
E Scott St
Length: 0.12 miles
Direction: E-W
Address range: 1100 to 1175
Direction: E-W
Address range: 1100 to 1175
N Frisco Ave
Length: 0.10 miles
Directions: N-S, SW-NE
Address range: 1300 to 1399
Directions: N-S, SW-NE
Address range: 1300 to 1399
Railroad features:
Burlington Northern Santa Fe RR
Length: 0.37 miles
Directions: N-S, SW-NE
Directions: N-S, SW-NE