Sherwood Village (Sherwood) neighborhood in Hatboro, Pennsylvania (PA), 19040 detailed profile
Settings
X


Business Search - 14 Million verified businesses
Area: 0.120 square miles
Population: 428
Population density:
| Sherwood Village (Sherwood): | 3,556 people per square mile |
| Hatboro: | 5,770 people per square mile |

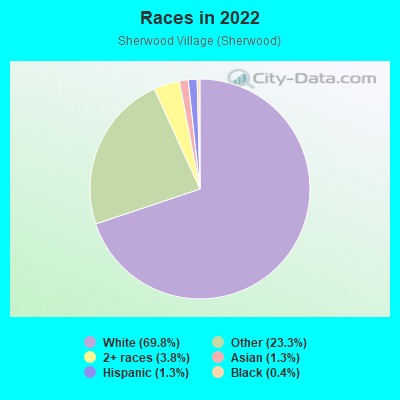
- 31469.8%White
- 10523.3%Some other race
- 173.8%Two or more races
- 61.3%Asian
- 61.3%Hispanic or Latino
- 20.4%Black
Median household income in 2022:
| Sherwood Village (Sherwood): | $111,569 |
| Hatboro: | $106,318 |
Distribution of median household income
![Distribution of median household income]()
- 3Less than $10,000
- 9$10,000 to $19,999
- 16$20,000 to $29,999
- 5$30,000 to $39,999
- 6$40,000 to $49,999
- 6$50,000 to $59,999
- 7$60,000 to $74,999
- 9$75,000 to $99,999
- 9$100,000 to $124,999
- 8$125,000 to $149,999
- 26$150,000 to $199,999
- 29$200,000 or more

Distribution of owner-occupied house/condo value
![Distribution of owner-occupied house/condo value]()
- 7Less than $50,000
- 4$50,000 to $99,999
- 4$100,000 to $149,999
- 3$150,000 to $199,999
- 2$200,000 to $249,999
- 8$250,000 to $299,999
- 41$300,000 to $399,999
- 23$400,000 to $499,999
- 29$500,000 to $749,999
- 5$750,000 to $999,999
- 2$1,000,000 or more

Distribution of rent paid by renters
![Distribution of rent paid by renters]()
- 2$600 to $699
- 1$1,000 to $1,249
- 2$1,250 to $1,499
- 5$1,500 to $1,999
- 2$2,000 or more

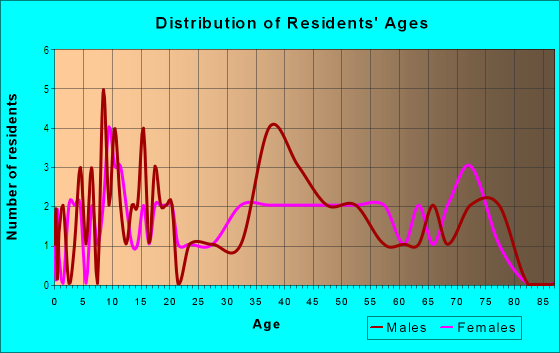
| Males: | 222 |
| Females: | 206 |
Males:
| This neighborhood: | 54.3 years |
| Whole city: | 36.6 years |
| This neighborhood: | 48.7 years |
| Whole city: | 35.7 years |
Average household size:
| Sherwood Village (Sherwood): | 10.9 people |
| Hatboro: | 2.6 people |
Percentage of family households:
| Sherwood Village (Sherwood): | 54.1% |
| Hatboro: | 49.3% |
| Here: | 67.2% |
| Hatboro: | 50.7% |
Percentage of married-couple families with children (among all households):
| Sherwood Village (Sherwood): | 20.4% |
| Hatboro: | 29.3% |
Percentage of single-mother households (among all households):
| Sherwood Village (Sherwood): | 3.3% |
| Hatboro: | 5.0% |
Percentage of never married males 15 years old and over:
Percentage of never married females 15 years old and over:
| Sherwood Village (Sherwood): | 12.1% |
| Hatboro: | 17.5% |
Percentage of never married females 15 years old and over:
| Sherwood Village (Sherwood): | 21.0% |
| borough: | 17.6% |
Percentage of people that speak English not well or not at all:
| Sherwood Village (Sherwood): | 1.7% |
| Hatboro: | 2.7% |
Percentage of people born in this state:
Percentage of people born in another U.S. state:
Percentage of native residents but born outside the U.S.:
Percentage of foreign born residents:
| Here: | 77.4% |
| Hatboro: | 76.8% |
Percentage of people born in another U.S. state:
| Sherwood Village (Sherwood): | 8.4% |
| Hatboro: | 13.9% |
Percentage of native residents but born outside the U.S.:
| Here: | 0.7% |
| borough: | 0.7% |
Percentage of foreign born residents:
| Here: | 13.5% |
| Hatboro: | 8.5% |
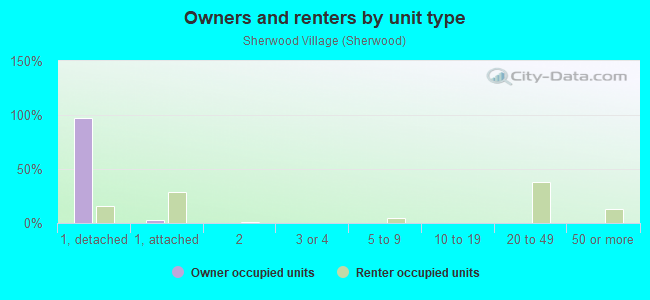
Owner-occupied
Renter-occupied

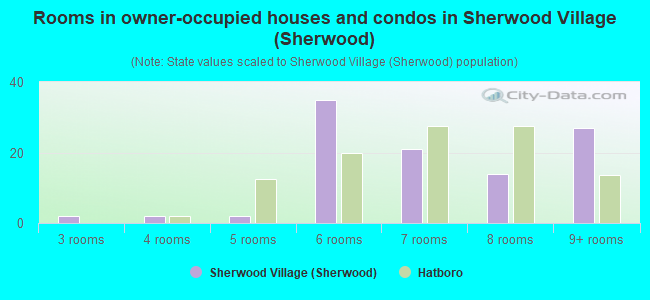
- Rooms in owner-occupied houses and condos in Sherwood Village <
> - 01 room
- 02 rooms
- 23 rooms
- 24 rooms
- 25 rooms
- 356 rooms
- 217 rooms
- 148 rooms
- 279+ rooms
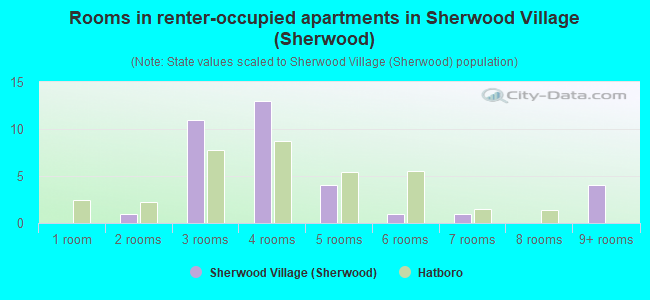
- Rooms in renter-occupied apartments in Sherwood Village <
> - 01 room
- 12 rooms
- 113 rooms
- 134 rooms
- 45 rooms
- 16 rooms
- 17 rooms
- 08 rooms
- 49+ rooms
Owner-occupied
Renter-occupied
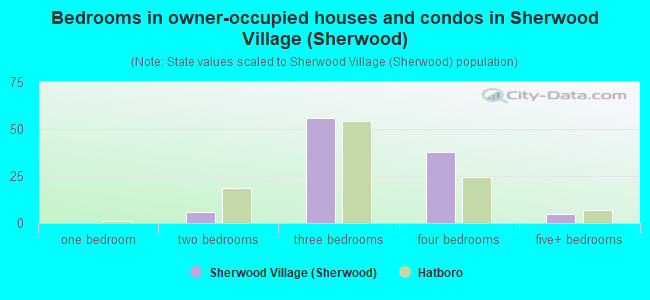
- Bedrooms in owner-occupied houses and condos in Sherwood Village <
> - 0no bedroom
- 01 bedroom
- 62 bedrooms
- 563 bedrooms
- 384 bedrooms
- 55+ bedrooms
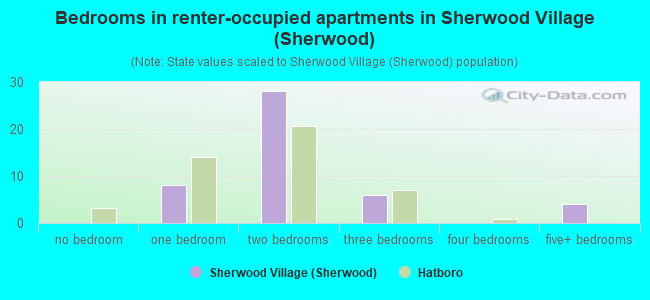
- Bedrooms in renter-occupied apartments in Sherwood Village <
> - 0no bedroom
- 81 bedroom
- 282 bedrooms
- 63 bedrooms
- 04 bedrooms
- 45+ bedrooms
Average number of cars or other vehicles available in houses/condos:
Average number of cars or other vehicles available in apartments:
| This neighborhood: | 2.6 |
| Hatboro: | 2.3 |
Average number of cars or other vehicles available in apartments:
| Here: | |
| borough: |
Percentage of units with a mortgage:
| Sherwood Village (Sherwood): | 60.7% |
| Hatboro: | 83.6% |
Average estimated value of detached houses in 2022 (99.0% of all units):
| Sherwood Village (Sherwood): | $439,766 |
| Pennsylvania: | $317,202 |
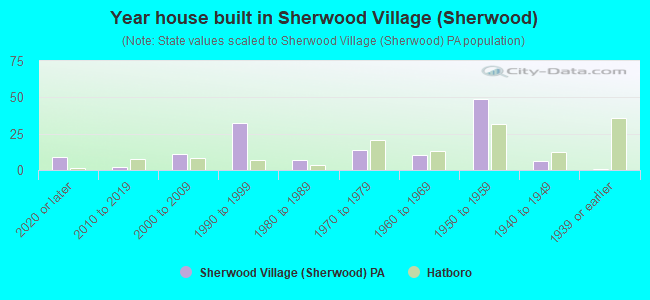
- Year house built in Sherwood Village <
> - 92020 or later
- 22010 to 2019
- 112000 to 2009
- 321990 to 1999
- 71980 to 1989
- 141970 to 1979
- 101960 to 1969
- 491950 to 1959
- 61940 to 1949
- 11939 or earlier
City-data.com crime index for borough in 2020 (higher means more crime):
| City: | 20.0 |
| U.S. average: | 219.5 |
Travel time to work (commute)
![Travel time to work (commute)]()
- 3Less than 5 minutes
- 155 to 9 minutes
- 1110 to 14 minutes
- 2815 to 19 minutes
- 1320 to 24 minutes
- 725 to 29 minutes
- 1530 to 34 minutes
- 835 to 39 minutes
- 940 to 44 minutes
- 1345 to 59 minutes
- 1860 to 89 minutes
- 190 or more minutes

Means of transportation to work
![Means of transportation to work]()
- 79.8%161Drove a car alone
- 2.5%5Carpooled
- 1.0%2Subway or elevated rail
- 1.5%3Long-distance train or commuter rail
- 1.5%3Bicycle
- 12.9%26Worked at home

Time leaving home to go to work
![Time leaving home to go to work]()
- 312:00 a.m. to 4:59 a.m.
- 75:00 a.m. to 5:29 a.m.
- 115:30 a.m. to 5:59 a.m.
- 136:00 a.m. to 6:29 a.m.
- 126:30 a.m. to 6:59 a.m.
- 347:00 a.m. to 7:29 a.m.
- 157:30 a.m. to 7:59 a.m.
- 118:00 a.m. to 8:29 a.m.
- 98:30 a.m. to 8:59 a.m.
- 39:00 a.m. to 9:59 a.m.
- 710:00 a.m. to 10:59 a.m.
- 612:00 p.m. to 3:59 p.m.
- 34:00 p.m. to 11:59 p.m.

Occupations of males:
- Percentage of males in management occupations (except farmers):
Here: 7.4% borough: 11.2%
- Percentage of males in business and financial operations occupations:
Here: 21.4% borough: 4.5%
- Percentage of males in computer and mathematical occupations:
Here: 12.6% borough: 5.6%
- Percentage of males in architecture and engineering occupations:
Here: 1.9% borough: 0.4%
- Percentage of males in healthcare practitioners and technical occupations:
Here: 3.8% borough: 4.1%
- Percentage of males in service occupations:
Here: 12.5% borough: 12.8%
- Percentage of males in sales and office occupations:
Here: 17.6% borough: 18.0%
- Percentage of males in construction, extraction, and maintenance occupations:
Here: 7.2% borough: 7.1%
- Percentage of males in production occupations:
Here: 4.2% borough: 3.1%
- Percentage of males in transportation occupations:
Here: 5.9% borough: 5.3%
- Percentage of males in material moving occupations:
Here: 3.8% borough: 3.6%
Occupations of females:
- Percentage of females in management occupations (except farmers):
Here: 7.2% borough: 8.0%
- Percentage of females in business and financial operations occupations:
Here: 8.2% borough: 9.0%
- Percentage of females in computer and mathematical occupations:
Here: 1.5% borough: 2.5%
- Percentage of females in architecture and engineering occupations:
Here: 3.8% borough: 1.8%
- Percentage of females in life, physical, and social science occupations:
Here: 1.4% borough: 1.0%
- Percentage of females in community and social services occupations:
Here: 2.8% borough: 4.5%
- Percentage of females in education, training, and library occupations:
Here: 8.1% borough: 6.7%
- Percentage of females in arts, design, entertainment, sports, and media occupations:
Here: 1.4% borough: 1.8%
- Percentage of females in healthcare practitioners and technical occupations:
Here: 21.6% borough: 16.5%
- Percentage of females in service occupations:
Here: 18.6% borough: 15.8%
- Percentage of females in sales and office occupations:
Here: 18.5% borough: 28.7%
- Percentage of females in production occupations:
Here: 2.1% borough: 0.3%
- Percentage of females in transportation occupations:
Here: 4.4% borough: 0.0%
Percentage of people 16-64 in Armed Forces:
| Sherwood Village (Sherwood): | 0.1% |
| Hatboro: | 0.0% |
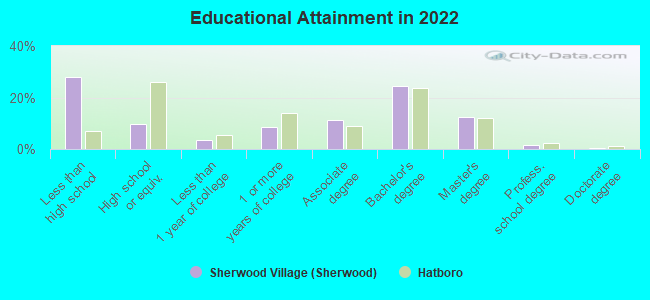
Education in this neighborhood (subdivision or community):
- Percentage of people 3 years and older in K-12 schools:
Sherwood Village (Sherwood): 18.2% Hatboro: 15.9%
- Percentage of people 3 years and older in undergraduate colleges:
Sherwood Village (Sherwood): 5.0% Hatboro: 3.4%
- Percentage of people 3 years and older in grad. or professional schools:
Sherwood Village (Sherwood): 2.4% Hatboro: 1.2%
- Percentage of students K-12 enrolled in private schools:
Sherwood Village (Sherwood): 25.0% Hatboro: 4.6%
Percentage of population below poverty level:
| Sherwood Village (Sherwood): | 1.2% |
| Hatboro: | 7.9% |
Median year owner moved in (as recorded in 2022):
| Sherwood Village (Sherwood): | 2002 |
| Hatboro: | 2010 |
Percentage of married-couple families with both working:
| Sherwood Village (Sherwood): | 92.8% |
| Hatboro: | 73.8% |
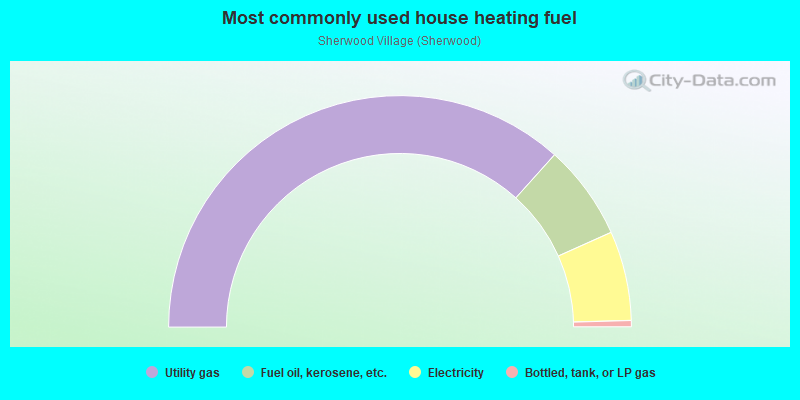
- 73.3%Utility gas
- 13.3%Fuel oil, kerosene, etc.
- 12.5%Electricity
- 0.9%Bottled, tank, or LP gas
Roads and streets:
W County Line Rd
Length: 0.57 miles
Direction: SE-NW
Address range: 437 to 1557
Direction: SE-NW
Address range: 437 to 1557
Roads and streets:
W County Line Rd
Length: 0.57 miles
Direction: SE-NW
Address range: 437 to 1557
Direction: SE-NW
Address range: 437 to 1557
Sherwood Ln
Length: 0.41 miles
Directions: E-W, SE-NW
Address range: 500 to 599
Directions: E-W, SE-NW
Address range: 500 to 599
Winding Rd
Length: 0.30 miles
Directions: E-W, N-S, SE-NW, SW-NE
Address range: 600 to 699
Directions: E-W, N-S, SE-NW, SW-NE
Address range: 600 to 699
Maple Ave
Length: 0.20 miles
Direction: SW-NE
Address range: 1 to 33
Direction: SW-NE
Address range: 1 to 33
Latchstring Ln
Length: 0.19 miles
Direction: SW-NE
Address range: 1 to 699
Direction: SW-NE
Address range: 1 to 699
Buckman Dr
Length: 0.16 miles
Direction: SE-NW
Address range: 501 to 599
Direction: SE-NW
Address range: 501 to 599
Springbrook Ln
Length: 0.11 miles
Direction: SE-NW
Address range: 400 to 499
Direction: SE-NW
Address range: 400 to 499