Silverland neighborhood in San Jose, California (CA), 95135 detailed profile
Settings
X


Business Search - 14 Million verified businesses
Area: 0.128 square miles
Population: 647
Population density:
| Silverland: | 5,066 people per square mile |
| San Jose: | 5,554 people per square mile |

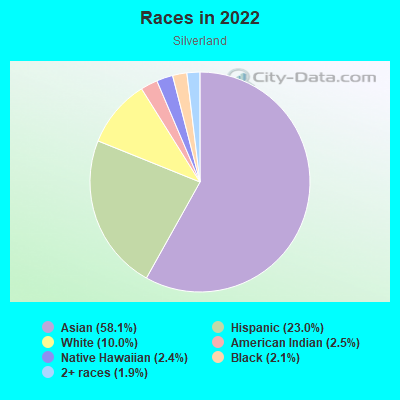
- 39358.1%Asian
- 15623.0%Hispanic or Latino
- 6810.0%White
- 172.5%American Indian
- 162.4%Native Hawaiian and Other
Pacific Islander - 142.1%Black
- 131.9%Two or more races
Median household income in 2022:
| Silverland: | $157,702 |
| San Jose: | $133,835 |
Distribution of median household income
![Distribution of median household income]()
- 7Less than $10,000
- 6$10,000 to $19,999
- 10$20,000 to $29,999
- 8$30,000 to $39,999
- 4$40,000 to $49,999
- 5$50,000 to $59,999
- 4$60,000 to $74,999
- 13$75,000 to $99,999
- 28$100,000 to $124,999
- 26$125,000 to $149,999
- 26$150,000 to $199,999
- 63$200,000 or more

Distribution of owner-occupied house/condo value
![Distribution of owner-occupied house/condo value]()
- 2$50,000 to $99,999
- 2$150,000 to $199,999
- 2$250,000 to $299,999
- 1$300,000 to $399,999
- 4$500,000 to $749,999
- 19$750,000 to $999,999
- 127$1,000,000 or more

Distribution of rent paid by renters
![Distribution of rent paid by renters]()
- 10$500 to $599
- 2$700 to $799
- 18$1,500 to $1,999
- 31$2,000 or more

Median rent in 2022:
| Silverland: | $2,360 |
| San Jose: | $2,001 |
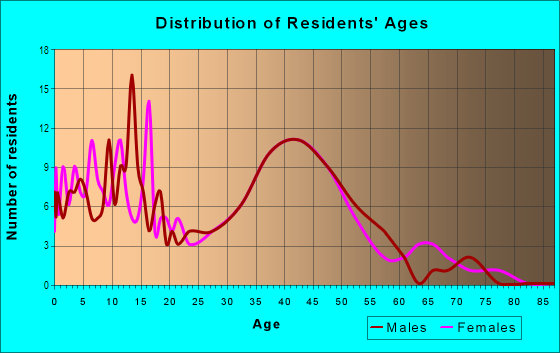
| Males: | 335 |
| Females: | 312 |
Males:
| This neighborhood: | 43.8 years |
| Whole city: | 37.6 years |
| This neighborhood: | 45.6 years |
| Whole city: | 39.1 years |
Average household size:
| Silverland: | 3.7 people |
| San Jose: | 2.9 people |
Percentage of family households:
| Silverland: | 49.0% |
| San Jose: | 49.9% |
| Here: | 75.5% |
| San Jose: | 53.0% |
Percentage of married-couple families with children (among all households):
| Silverland: | 25.3% |
| San Jose: | 25.8% |
Percentage of single-mother households (among all households):
| Silverland: | 0.3% |
| San Jose: | 5.2% |
Percentage of never married males 15 years old and over:
Percentage of never married females 15 years old and over:
| Silverland: | 19.2% |
| San Jose: | 20.9% |
Percentage of never married females 15 years old and over:
| Silverland: | 7.4% |
| city: | 16.7% |
Percentage of people that speak English not well or not at all:
| Silverland: | 6.2% |
| San Jose: | 11.4% |
Percentage of people born in this state:
Percentage of people born in another U.S. state:
Percentage of native residents but born outside the U.S.:
Percentage of foreign born residents:
| Here: | 39.5% |
| San Jose: | 46.1% |
Percentage of people born in another U.S. state:
| Silverland: | 5.8% |
| San Jose: | 10.4% |
Percentage of native residents but born outside the U.S.:
| Here: | 2.4% |
| city: | 1.7% |
Percentage of foreign born residents:
| Here: | 52.3% |
| San Jose: | 41.8% |

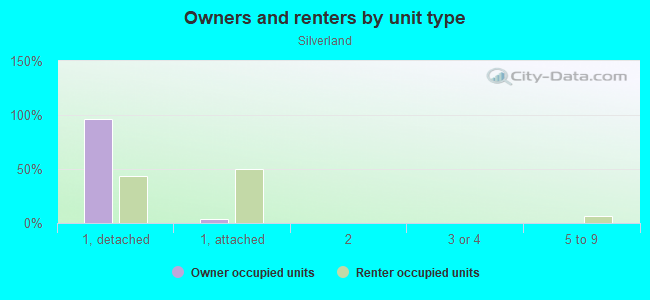
Owner-occupied
Renter-occupied


- Rooms in owner-occupied houses and condos in Silverland
- 21 room
- 52 rooms
- 63 rooms
- 74 rooms
- 175 rooms
- 496 rooms
- 427 rooms
- 208 rooms
- 99+ rooms
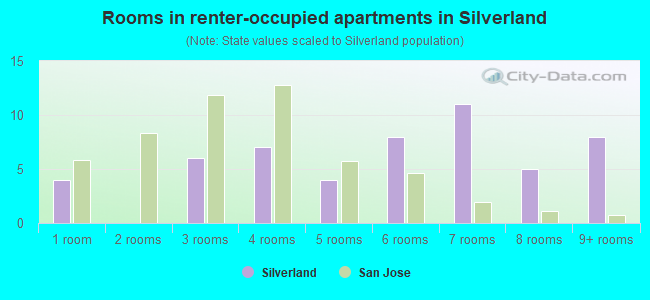
- Rooms in renter-occupied apartments in Silverland
- 41 room
- 02 rooms
- 63 rooms
- 74 rooms
- 45 rooms
- 86 rooms
- 117 rooms
- 58 rooms
- 89+ rooms
Owner-occupied
Renter-occupied

- Bedrooms in owner-occupied houses and condos in Silverland
- 2no bedroom
- 111 bedroom
- 12 bedrooms
- 643 bedrooms
- 694 bedrooms
- 105+ bedrooms

- Bedrooms in renter-occupied apartments in Silverland
- 4no bedroom
- 31 bedroom
- 202 bedrooms
- 73 bedrooms
- 324 bedrooms
- 15+ bedrooms
Average number of cars or other vehicles available in houses/condos:
Average number of cars or other vehicles available in apartments:
| This neighborhood: | 2.5 |
| San Jose: | 2.3 |
Average number of cars or other vehicles available in apartments:
| Here: | 2.8 |
| city: | 1.6 |
Percentage of units with a mortgage:
| Silverland: | 70.1% |
| San Jose: | 66.9% |
Average estimated value of detached houses in 2022 (97.7% of all units):
| Silverland: | $1,425,945 |
| San Jose: | $1,532,815 |

- Year house built in Silverland
- 02020 or later
- 52010 to 2019
- 02000 to 2009
- 171990 to 1999
- 581980 to 1989
- 481970 to 1979
- 531960 to 1969
- 171950 to 1959
- 21940 to 1949
- 01939 or earlier
City-data.com crime index for city in 2020 (higher means more crime):
| City: | 268.4 |
| U.S. average: | 219.5 |
Travel time to work (commute)
![Travel time to work (commute)]()
- 6Less than 5 minutes
- 115 to 9 minutes
- 1910 to 14 minutes
- 11915 to 19 minutes
- 17520 to 24 minutes
- 8225 to 29 minutes
- 20530 to 34 minutes
- 2135 to 39 minutes
- 8140 to 44 minutes
- 2645 to 59 minutes
- 4960 to 89 minutes
- 2490 or more minutes

Means of transportation to work
![Means of transportation to work]()
- 81.3%232Drove a car alone
- 5.6%16Carpooled
- 2.8%8Bus
- 1.1%3Subway or elevated rail
- 2.5%7Long-distance train or commuter rail
- 8.4%24Other means
- 8.4%24Worked at home

Time leaving home to go to work
![Time leaving home to go to work]()
- 2612:00 a.m. to 4:59 a.m.
- 205:00 a.m. to 5:29 a.m.
- 265:30 a.m. to 5:59 a.m.
- 816:00 a.m. to 6:29 a.m.
- 986:30 a.m. to 6:59 a.m.
- 1157:00 a.m. to 7:29 a.m.
- 887:30 a.m. to 7:59 a.m.
- 1528:00 a.m. to 8:29 a.m.
- 578:30 a.m. to 8:59 a.m.
- 1349:00 a.m. to 9:59 a.m.
- 3210:00 a.m. to 10:59 a.m.
- 2911:00 a.m. to 11:59 a.m.
- 4812:00 p.m. to 3:59 p.m.
- 134:00 p.m. to 11:59 p.m.

Occupations of males:
- Percentage of males in management occupations (except farmers):
Here: 3.9% city: 13.0%
- Percentage of males in business and financial operations occupations:
Here: 3.6% city: 4.6%
- Percentage of males in computer and mathematical occupations:
Here: 10.0% city: 13.6%
- Percentage of males in architecture and engineering occupations:
Here: 22.1% city: 10.2%
- Percentage of males in life, physical, and social science occupations:
Here: 1.9% city: 1.1%
- Percentage of males in community and social services occupations:
Here: 1.5% city: 0.8%
- Percentage of males in arts, design, entertainment, sports, and media occupations:
Here: 4.9% city: 1.8%
- Percentage of males in healthcare practitioners and technical occupations:
Here: 1.1% city: 2.0%
- Percentage of males in service occupations:
Here: 3.2% city: 12.7%
- Percentage of males in sales and office occupations:
Here: 22.5% city: 12.8%
- Percentage of males in construction, extraction, and maintenance occupations:
Here: 2.9% city: 7.8%
- Percentage of males in production occupations:
Here: 9.3% city: 5.5%
- Percentage of males in transportation occupations:
Here: 2.4% city: 3.6%
- Percentage of males in material moving occupations:
Here: 8.6% city: 3.1%
Occupations of females:
- Percentage of females in management occupations (except farmers):
Here: 7.4% city: 11.0%
- Percentage of females in business and financial operations occupations:
Here: 10.9% city: 8.6%
- Percentage of females in computer and mathematical occupations:
Here: 3.2% city: 5.4%
- Percentage of females in education, training, and library occupations:
Here: 12.6% city: 8.1%
- Percentage of females in arts, design, entertainment, sports, and media occupations:
Here: 4.2% city: 2.0%
- Percentage of females in healthcare practitioners and technical occupations:
Here: 17.9% city: 6.8%
- Percentage of females in service occupations:
Here: 13.8% city: 21.7%
- Percentage of females in sales and office occupations:
Here: 24.7% city: 22.0%
- Percentage of females in production occupations:
Here: 7.9% city: 4.0%
Percentage of people 16-64 in Armed Forces:
| Silverland: | 0.9% |
| San Jose: | 0.0% |
Education in this neighborhood (subdivision or community):
- Percentage of people 3 years and older in K-12 schools:
Silverland: 11.5% San Jose: 16.1%
- Percentage of people 3 years and older in undergraduate colleges:
Silverland: 5.1% San Jose: 6.5%
- Percentage of people 3 years and older in grad. or professional schools:
Silverland: 2.4% San Jose: 2.0%
- Percentage of students K-12 enrolled in private schools:
Silverland: 73.6% San Jose: 14.9%
Percentage of population below poverty level:
| Silverland: | 5.3% |
| San Jose: | 9.0% |
Median year owner moved in (as recorded in 2022):
Median year renter moved in (as recorded in 2022):
| Silverland: | 2003 |
| San Jose: | 2008 |
Median year renter moved in (as recorded in 2022):
| Silverland: | 2007 |
| San Jose: | 2020 |
Percentage of married-couple families with both working:
| Silverland: | 81.1% |
| San Jose: | 72.5% |
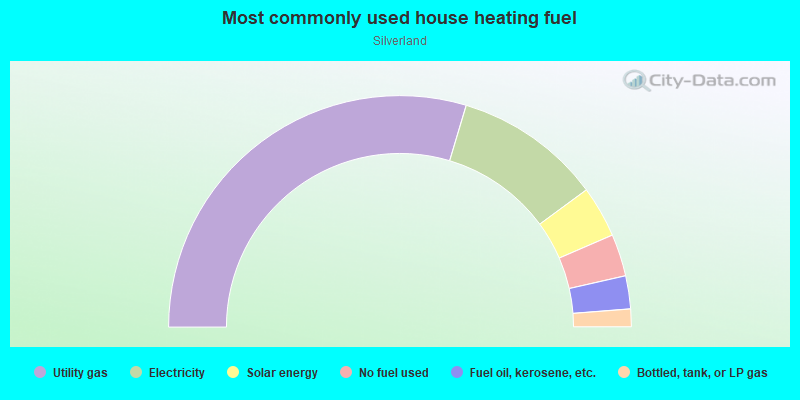
- 59.3%Utility gas
- 20.6%Electricity
- 7.2%Solar energy
- 5.9%No fuel used
- 4.6%Fuel oil, kerosene, etc.
- 2.5%Bottled, tank, or LP gas
Roads and streets:
Aborn Rd
Length: 0.41 miles
Direction: E-W
Address range: 2929 to 3099
Direction: E-W
Address range: 2929 to 3099
Riedel Rd
Length: 0.25 miles
Directions: E-W, SW-NE
Address range: 2800 to 2899
Directions: E-W, SW-NE
Address range: 2800 to 2899
Silverland Dr
Length: 0.22 miles
Direction: E-W
Address range: 2900 to 3025
Direction: E-W
Address range: 2900 to 3025
Foxboro Pl
Length: 0.16 miles
Direction: N-S
Address range: 3200 to 3299
Direction: N-S
Address range: 3200 to 3299
Silverland Ct
Length: 0.13 miles
Directions: E-W, SW-NE
Address range: 2900 to 2999
Directions: E-W, SW-NE
Address range: 2900 to 2999
Terra Cotta Dr
Length: 0.13 miles
Direction: N-S
Address range: 3200 to 3261
Direction: N-S
Address range: 3200 to 3261
Urzi Dr
Length: 0.12 miles
Direction: N-S
Address range: 3200 to 3299
Direction: N-S
Address range: 3200 to 3299
Haddon Way
Length: 0.08 miles
Directions: N-S, SE-NW
Address range: 3200 to 3299
Directions: N-S, SE-NW
Address range: 3200 to 3299
Trellis Pl
Length: 0.08 miles
Direction: N-S
Address range: 3200 to 3299
Direction: N-S
Address range: 3200 to 3299
Riedel Ct
Length: 0.07 miles
Direction: E-W
Address range: 2800 to 2999
Direction: E-W
Address range: 2800 to 2999
Urzi Ct
Length: 0.06 miles
Direction: E-W
Address range: 2800 to 2899
Direction: E-W
Address range: 2800 to 2899
Goldridge Ct
Length: 0.06 miles
Direction: N-S
Address range: 3200 to 3299
Direction: N-S
Address range: 3200 to 3299
Magnum Dr
Length: 0.06 miles
Direction: E-W
Address range: 2900 to 2996
Direction: E-W
Address range: 2900 to 2996
Brown Hill Ct
Length: 0.06 miles
Direction: N-S
Address range: 3200 to 3299
Direction: N-S
Address range: 3200 to 3299
Yellow Leaf Ct
Length: 0.06 miles
Direction: N-S
Address range: 3200 to 3299
Direction: N-S
Address range: 3200 to 3299
Terra Cotta Ct
Length: 0.06 miles
Direction: E-W
Address range: 3100 to 3199
Direction: E-W
Address range: 3100 to 3199
Vermilion Ct
Length: 0.06 miles
Direction: E-W
Address range: 3100 to 3199
Direction: E-W
Address range: 3100 to 3199
Greenland Way
Length: 0.05 miles
Direction: N-S
Direction: N-S
Blue Creek Ct
Length: 0.03 miles
Direction: N-S
Address range: 3200 to 3299
Direction: N-S
Address range: 3200 to 3299
Redglen Ct
Length: 0.03 miles
Direction: N-S
Address range: 3200 to 3299
Direction: N-S
Address range: 3200 to 3299