Sonoma neighborhood in Ennis, Texas (TX), 75119 detailed profile
Settings
X


Business Search - 14 Million verified businesses
Area: 0.332 square miles
Population: 37
Population density:
| Sonoma: | 112 people per square mile |
| Ennis: | 1,151 people per square mile |

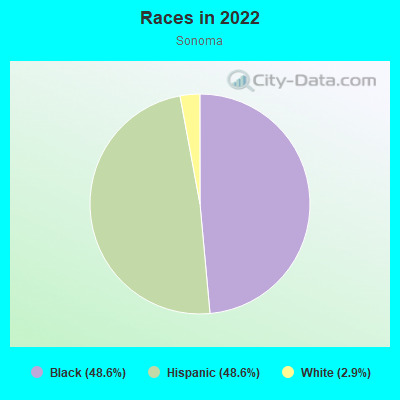
- 1748.6%Black
- 1748.6%Hispanic or Latino
- 12.9%White
Median household income in 2022:
| Sonoma: | $40,913 |
| Ennis: | $73,176 |
Distribution of median household income
![Distribution of median household income]()
- 1Less than $10,000
- 5$10,000 to $19,999
- 5$20,000 to $29,999
- 3$30,000 to $39,999
- 2$40,000 to $49,999
- 1$50,000 to $59,999
- 1$60,000 to $74,999
- 5$75,000 to $99,999
- 1$100,000 to $124,999
- 6$125,000 to $149,999
- 1$150,000 to $199,999
- 1$200,000 or more

Distribution of owner-occupied house/condo value
![Distribution of owner-occupied house/condo value]()
- 2Less than $50,000
- 3$50,000 to $99,999
- 5$100,000 to $149,999
- 3$150,000 to $199,999
- 2$200,000 to $249,999
- 6$250,000 to $299,999
- 1$400,000 to $499,999
- 1$500,000 to $749,999

Distribution of rent paid by renters
![Distribution of rent paid by renters]()
- 2$500 to $599
- 6$600 to $699
- 5$700 to $799
- 1$800 to $899
- 4$900 to $999
- 1$1,000 to $1,249
- 1$1,500 to $1,999

Median rent in 2022:
| Sonoma: | $700 |
| Ennis: | $951 |
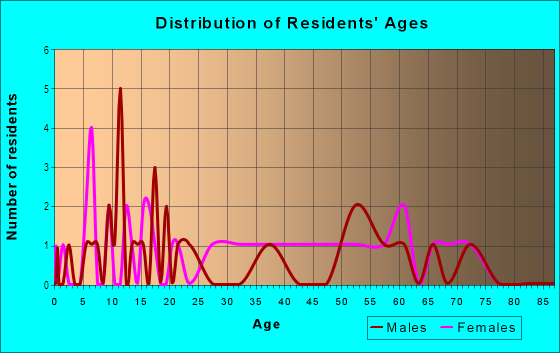
| Males: | 15 |
| Females: | 22 |
Males:
| This neighborhood: | 30.9 years |
| Whole city: | 29.8 years |
| This neighborhood: | 38.5 years |
| Whole city: | 37.2 years |
Average household size:
| Sonoma: | 25.0 people |
| Ennis: | 2.8 people |
Percentage of family households:
| Sonoma: | 66.6% |
| Ennis: | 61.0% |
| Here: | 49.3% |
| Ennis: | 51.7% |
Percentage of married-couple families with children (among all households):
| Sonoma: | 36.9% |
| Ennis: | 22.5% |
Percentage of single-mother households (among all households):
| Sonoma: | 4.7% |
| Ennis: | 11.5% |
Percentage of never married males 15 years old and over:
Percentage of never married females 15 years old and over:
| Sonoma: | 10.9% |
| Ennis: | 17.6% |
Percentage of never married females 15 years old and over:
| Sonoma: | 13.0% |
| city: | 13.0% |
Percentage of people that speak English not well or not at all:
| Sonoma: | 5.7% |
| Ennis: | 6.5% |
Percentage of people born in this state:
Percentage of people born in another U.S. state:
Percentage of native residents but born outside the U.S.:
Percentage of foreign born residents:
| Here: | 65.8% |
| Ennis: | 69.7% |
Percentage of people born in another U.S. state:
| Sonoma: | 16.7% |
| Ennis: | 13.6% |
Percentage of native residents but born outside the U.S.:
| Here: | 0.0% |
| city: | 0.2% |
Percentage of foreign born residents:
| Here: | 17.5% |
| Ennis: | 16.5% |
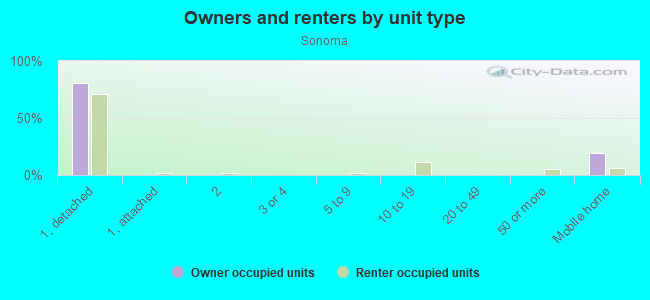
Owner-occupied
Renter-occupied

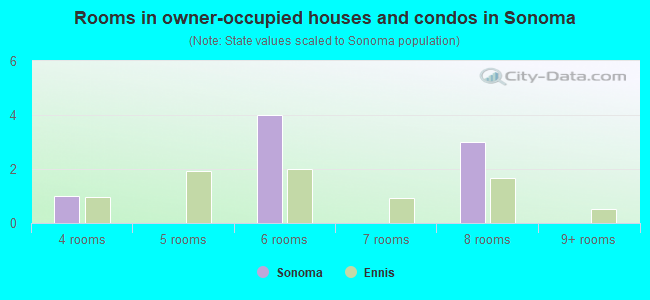
- Rooms in owner-occupied houses and condos in Sonoma
- 01 room
- 02 rooms
- 03 rooms
- 14 rooms
- 05 rooms
- 46 rooms
- 07 rooms
- 38 rooms
- 09+ rooms
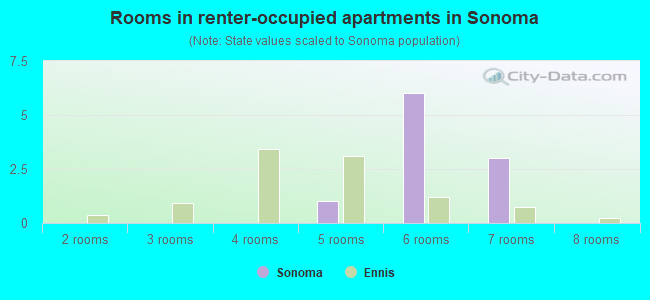
- Rooms in renter-occupied apartments in Sonoma
- 01 room
- 02 rooms
- 03 rooms
- 04 rooms
- 15 rooms
- 66 rooms
- 37 rooms
- 08 rooms
- 09+ rooms
Owner-occupied
Renter-occupied
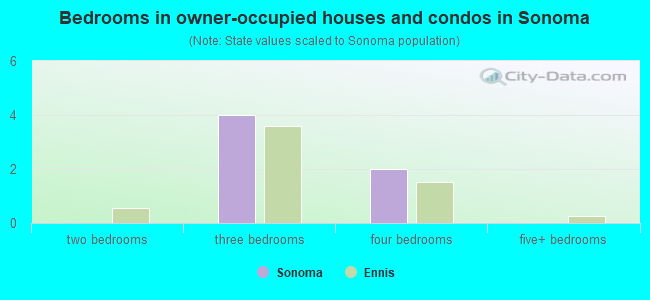
- Bedrooms in owner-occupied houses and condos in Sonoma
- 0no bedroom
- 01 bedroom
- 02 bedrooms
- 43 bedrooms
- 24 bedrooms
- 05+ bedrooms
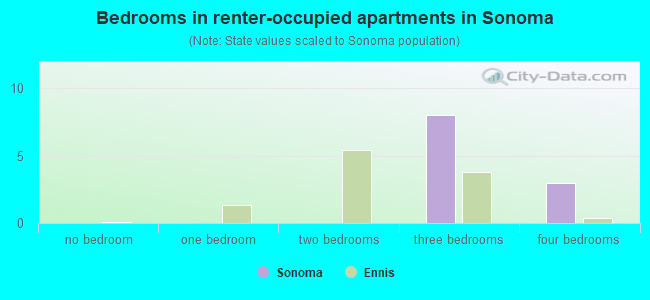
- Bedrooms in renter-occupied apartments in Sonoma
- 0no bedroom
- 01 bedroom
- 02 bedrooms
- 83 bedrooms
- 34 bedrooms
- 05+ bedrooms
Average number of cars or other vehicles available in houses/condos:
Average number of cars or other vehicles available in apartments:
| This neighborhood: | 1.8 |
| Ennis: | 2.3 |
Average number of cars or other vehicles available in apartments:
| Here: | 1.7 |
| city: | 1.5 |
Percentage of units with a mortgage:
| Sonoma: | 57.6% |
| Ennis: | 61.0% |
Housing prices:
- Average estimated value of detached houses in 2022 (90.0% of all units):
Sonoma: $673,847 Texas: $369,058
- Average estimated value of mobile home in 2022 (5.0% of all units):
Sonoma: $71,504 Texas: $124,413
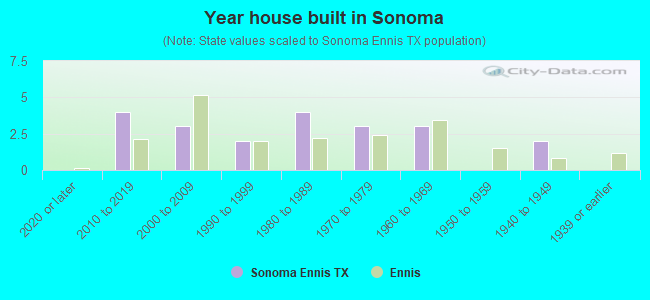
- Year house built in Sonoma
- 02020 or later
- 42010 to 2019
- 32000 to 2009
- 21990 to 1999
- 41980 to 1989
- 31970 to 1979
- 31960 to 1969
- 01950 to 1959
- 21940 to 1949
- 01939 or earlier
City-data.com crime index for city in 2020 (higher means more crime):
| City: | 183.4 |
| U.S. average: | 219.5 |
Travel time to work (commute)
![Travel time to work (commute)]()
- 9Less than 5 minutes
- 25 to 9 minutes
- 710 to 14 minutes
- 315 to 19 minutes
- 320 to 24 minutes
- 125 to 29 minutes
- 230 to 34 minutes
- 460 to 89 minutes
- 190 or more minutes

Means of transportation to work
![Means of transportation to work]()
- 85.8%15Drove a car alone
- 5.7%1Carpooled

Time leaving home to go to work
![Time leaving home to go to work]()
- 212:00 a.m. to 4:59 a.m.
- 25:00 a.m. to 5:29 a.m.
- 15:30 a.m. to 5:59 a.m.
- 46:00 a.m. to 6:29 a.m.
- 36:30 a.m. to 6:59 a.m.
- 57:00 a.m. to 7:29 a.m.
- 27:30 a.m. to 7:59 a.m.
- 28:00 a.m. to 8:29 a.m.
- 88:30 a.m. to 8:59 a.m.
- 19:00 a.m. to 9:59 a.m.
- 110:00 a.m. to 10:59 a.m.
- 24:00 p.m. to 11:59 p.m.

Occupations of males:
- Percentage of males in management occupations (except farmers):
Here: 16.0% city: 9.1%
- Percentage of males in business and financial operations occupations:
Here: 10.0% city: 2.5%
- Percentage of males in architecture and engineering occupations:
Here: 6.6% city: 1.4%
- Percentage of males in life, physical, and social science occupations:
Here: 1.6% city: 1.1%
- Percentage of males in education, training, and library occupations:
Here: 6.5% city: 1.6%
- Percentage of males in service occupations:
Here: 12.2% city: 9.8%
- Percentage of males in sales and office occupations:
Here: 25.8% city: 16.3%
- Percentage of males in construction, extraction, and maintenance occupations:
Here: 11.3% city: 16.7%
- Percentage of males in production occupations:
Here: 2.8% city: 12.4%
- Percentage of males in material moving occupations:
Here: 23.0% city: 7.6%
Occupations of females:
- Percentage of females in management occupations (except farmers):
Here: 39.9% city: 11.7%
- Percentage of females in computer and mathematical occupations:
Here: 2.5% city: 0.5%
- Percentage of females in community and social services occupations:
Here: 4.0% city: 0.8%
- Percentage of females in legal occupations:
Here: 4.9% city: 0.5%
- Percentage of females in education, training, and library occupations:
Here: 4.9% city: 7.9%
- Percentage of females in healthcare practitioners and technical occupations:
Here: 14.6% city: 8.9%
- Percentage of females in service occupations:
Here: 35.7% city: 29.0%
- Percentage of females in sales and office occupations:
Here: 39.9% city: 24.7%
- Percentage of females in construction, extraction, and maintenance occupations:
Here: 9.6% city: 1.3%
- Percentage of females in production occupations:
Here: 14.7% city: 6.5%
- Percentage of females in material moving occupations:
Here: 1.9% city: 1.5%
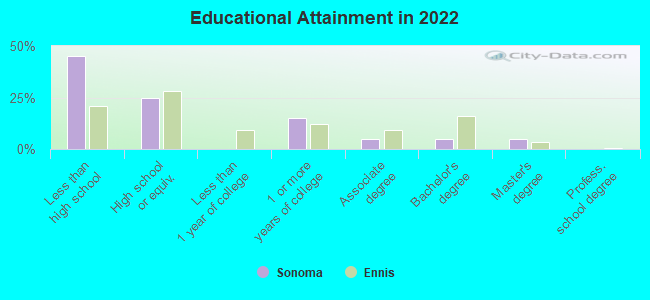
Education in this neighborhood (subdivision or community):
- Percentage of people 3 years and older in K-12 schools:
Sonoma: 11.1% Ennis: 20.0%
- Percentage of people 3 years and older in undergraduate colleges:
Sonoma: 0.0% Ennis: 4.2%
- Percentage of people 3 years and older in grad. or professional schools:
Sonoma: 0.0% Ennis: 0.5%
- Percentage of students K-12 enrolled in private schools:
Sonoma: 0.0% Ennis: 1.0%
Percentage of population below poverty level:
| Sonoma: | 12.4% |
| Ennis: | 11.5% |
Median year owner moved in (as recorded in 2022):
Median year renter moved in (as recorded in 2022):
| Sonoma: | 2005 |
| Ennis: | 2009 |
Median year renter moved in (as recorded in 2022):
| Sonoma: | 2017 |
| Ennis: | 2017 |
Percentage of married-couple families with both working:
| Sonoma: | 139.4% |
| Ennis: | 69.8% |
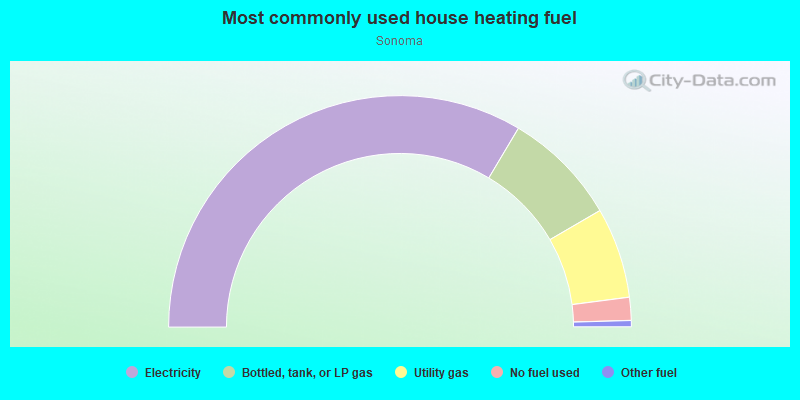
- 67.2%Electricity
- 16.1%Bottled, tank, or LP gas
- 12.7%Utility gas
- 3.2%No fuel used
- 0.9%Other fuel
Limited-access highways (interstate or state) in this neighborhood:
I- 45
Length: 0.24 miles
Direction: SE-NW
Direction: SE-NW
Highways in this neighborhood:
E Ennis Ave (State Hwy 34)
Length: 0.65 miles
Direction: SW-NE
Address range: 1205 to 2199
Direction: SW-NE
Address range: 1205 to 2199
Roads and streets:
Centenial Ave
Length: 0.46 miles
Directions: E-W, SE-NW
Address range: 200 to 499
Directions: E-W, SE-NW
Address range: 200 to 499
Old Telico Rd
Length: 0.40 miles
Directions: E-W, SW-NE
Address range: 500 to 699
Directions: E-W, SW-NE
Address range: 500 to 699
Highland Dr
Length: 0.40 miles
Directions: N-S, SE-NW
Address range: 100 to 599
Directions: N-S, SE-NW
Address range: 100 to 599
S Sonama Trl
Length: 0.37 miles
Direction: SE-NW
Direction: SE-NW
Brannon Dr
Length: 0.35 miles
Direction: SE-NW
Address range: 100 to 407
Direction: SE-NW
Address range: 100 to 407
Lumpkin Ave
Length: 0.25 miles
Direction: SE-NW
Address range: 100 to 411
Direction: SE-NW
Address range: 100 to 411
Golden Spike Rd
Length: 0.21 miles
Directions: E-W, SW-NE
Address range: 1500 to 1698
Directions: E-W, SW-NE
Address range: 1500 to 1698
Jupiter Ln
Length: 0.20 miles
Directions: SE-NW, SW-NE
Address range: 1600 to 1899
Directions: SE-NW, SW-NE
Address range: 1600 to 1899
Dolfie Ln
Length: 0.17 miles
Direction: SW-NE
Direction: SW-NE
Length: 0.16 miles
Directions: E-W, SE-NW
Directions: E-W, SE-NW
Baker St
Length: 0.16 miles
Direction: SE-NW
Address range: 100 to 299
Direction: SE-NW
Address range: 100 to 299
Arleta Ln
Length: 0.15 miles
Direction: SW-NE
Address range: 300 to 699
Direction: SW-NE
Address range: 300 to 699
Loma Alta Ln
Length: 0.15 miles
Direction: SW-NE
Address range: 600 to 699
Direction: SW-NE
Address range: 600 to 699
Cooper Ln
Length: 0.15 miles
Direction: SW-NE
Address range: 600 to 630
Direction: SW-NE
Address range: 600 to 630
Hill Ln
Length: 0.15 miles
Direction: SW-NE
Direction: SW-NE
Carrol Ave
Length: 0.13 miles
Directions: E-W, SE-NW, SW-NE
Address range: 400 to 599
Directions: E-W, SE-NW, SW-NE
Address range: 400 to 599
Pacific Ave
Length: 0.13 miles
Direction: SW-NE
Address range: 1500 to 1699
Direction: SW-NE
Address range: 1500 to 1699
Sonny Ave
Length: 0.10 miles
Direction: SW-NE
Address range: 500 to 599
Direction: SW-NE
Address range: 500 to 599
Richard Ave
Length: 0.10 miles
Direction: SW-NE
Address range: 500 to 599
Direction: SW-NE
Address range: 500 to 599
Kim Ave
Length: 0.10 miles
Directions: N-S, SW-NE
Address range: 500 to 599
Directions: N-S, SW-NE
Address range: 500 to 599
N Sonoma Trl
Length: 0.05 miles
Direction: SE-NW
Direction: SE-NW