South Avenue neighborhood in Poughkeepsie, New York (NY), 12601 detailed profile
Settings
X


Business Search - 14 Million verified businesses
Area: 0.104 square miles
Population: 502
Population density:
| South Avenue: | 4,833 people per square mile |
| Poughkeepsie: | 6,165 people per square mile |

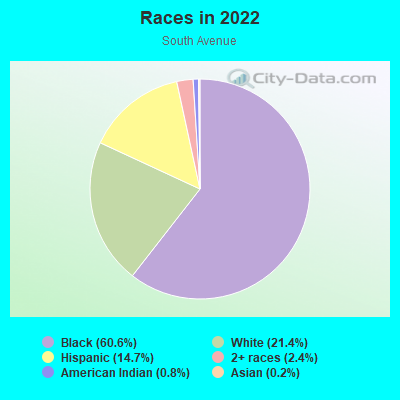
- 30660.6%Black
- 10821.4%White
- 7414.7%Hispanic or Latino
- 122.4%Two or more races
- 40.8%American Indian
- 10.2%Asian
Median household income in 2022:
| South Avenue: | $50,391 |
| Poughkeepsie: | $53,875 |
Distribution of median household income
![Distribution of median household income]()
- 25Less than $10,000
- 16$10,000 to $19,999
- 38$20,000 to $29,999
- 21$30,000 to $39,999
- 30$40,000 to $49,999
- 45$50,000 to $59,999
- 7$60,000 to $74,999
- 21$75,000 to $99,999
- 13$100,000 to $124,999
- 20$125,000 to $149,999
- 7$150,000 to $199,999
- 31$200,000 or more

Distribution of owner-occupied house/condo value
![Distribution of owner-occupied house/condo value]()
- 14Less than $50,000
- 10$50,000 to $99,999
- 4$100,000 to $149,999
- 16$150,000 to $199,999
- 25$200,000 to $249,999
- 2$250,000 to $299,999
- 13$300,000 to $399,999
- 7$500,000 to $749,999
- 7$750,000 to $999,999
- 1$1,000,000 or more

Distribution of rent paid by renters
![Distribution of rent paid by renters]()
- 6$200 to $299
- 25$500 to $599
- 11$600 to $699
- 3$700 to $799
- 8$800 to $899
- 10$900 to $999
- 48$1,000 to $1,249
- 47$1,250 to $1,499
- 29$1,500 to $1,999
- 27$2,000 or more

Median rent in 2022:
| South Avenue: | $1,257 |
| Poughkeepsie: | $1,083 |
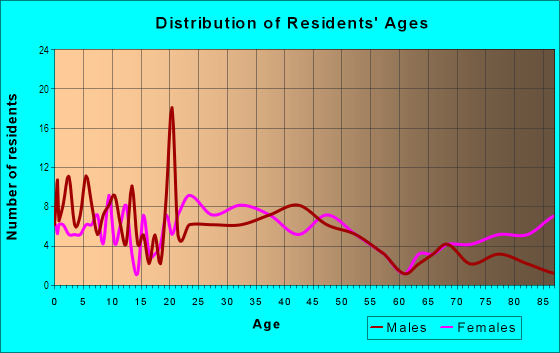
| Males: | 162 |
| Females: | 340 |
Males:
| This neighborhood: | 43.9 years |
| Whole city: | 34.9 years |
| This neighborhood: | 41.1 years |
| Whole city: | 40.6 years |
Average household size:
| South Avenue: | 2.3 people |
| Poughkeepsie: | 2.3 people |
Percentage of family households:
| South Avenue: | 27.8% |
| Poughkeepsie: | 37.5% |
| Here: | 23.1% |
| Poughkeepsie: | 25.8% |
Percentage of married-couple families with children (among all households):
| South Avenue: | 27.9% |
| Poughkeepsie: | 19.0% |
Percentage of single-mother households (among all households):
| South Avenue: | 15.0% |
| Poughkeepsie: | 22.3% |
Percentage of never married males 15 years old and over:
Percentage of never married females 15 years old and over:
| South Avenue: | 2.6% |
| Poughkeepsie: | 21.0% |
Percentage of never married females 15 years old and over:
| South Avenue: | 28.4% |
| city: | 23.5% |
Percentage of people that speak English not well or not at all:
| South Avenue: | 0.6% |
| Poughkeepsie: | 5.2% |
Percentage of people born in this state:
Percentage of people born in another U.S. state:
Percentage of native residents but born outside the U.S.:
Percentage of foreign born residents:
| Here: | 70.2% |
| Poughkeepsie: | 68.3% |
Percentage of people born in another U.S. state:
| South Avenue: | 21.1% |
| Poughkeepsie: | 13.1% |
Percentage of native residents but born outside the U.S.:
| Here: | 2.3% |
| city: | 2.7% |
Percentage of foreign born residents:
| Here: | 6.5% |
| Poughkeepsie: | 15.8% |
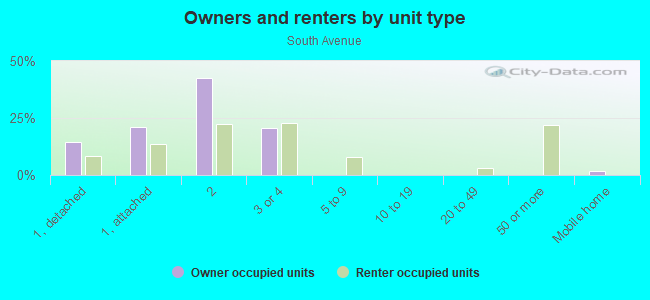
Owner-occupied
Renter-occupied

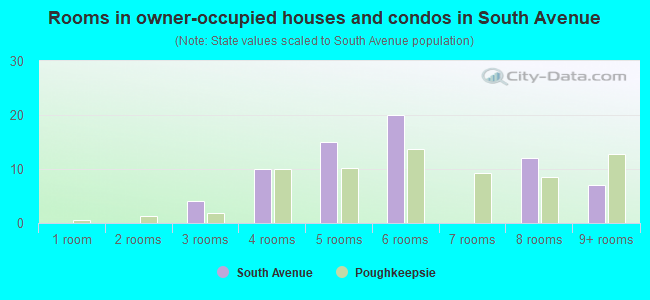
- Rooms in owner-occupied houses and condos in South Avenue
- 01 room
- 02 rooms
- 43 rooms
- 104 rooms
- 155 rooms
- 206 rooms
- 07 rooms
- 128 rooms
- 79+ rooms
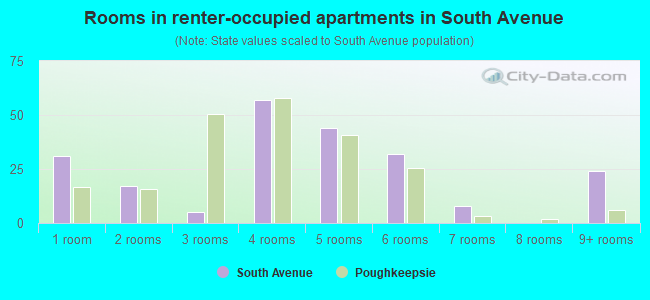
- Rooms in renter-occupied apartments in South Avenue
- 311 room
- 172 rooms
- 53 rooms
- 574 rooms
- 445 rooms
- 326 rooms
- 87 rooms
- 08 rooms
- 249+ rooms
Owner-occupied
Renter-occupied
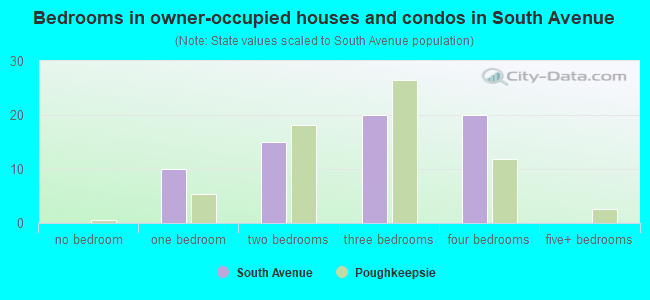
- Bedrooms in owner-occupied houses and condos in South Avenue
- 0no bedroom
- 101 bedroom
- 152 bedrooms
- 203 bedrooms
- 204 bedrooms
- 05+ bedrooms
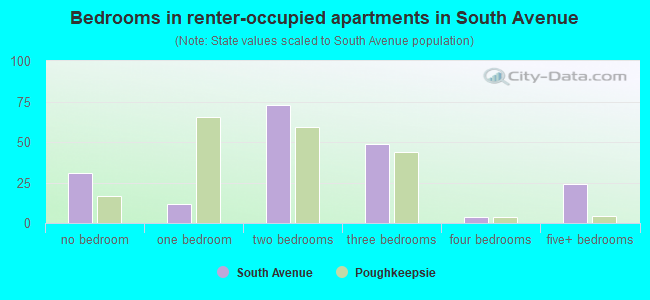
- Bedrooms in renter-occupied apartments in South Avenue
- 31no bedroom
- 121 bedroom
- 732 bedrooms
- 493 bedrooms
- 44 bedrooms
- 245+ bedrooms
Average number of cars or other vehicles available in houses/condos:
Average number of cars or other vehicles available in apartments:
| This neighborhood: | 1.3 |
| Poughkeepsie: | 1.6 |
Average number of cars or other vehicles available in apartments:
| Here: | 0.8 |
| city: | 0.9 |
Percentage of units with a mortgage:
| South Avenue: | 30.2% |
| Poughkeepsie: | 62.5% |
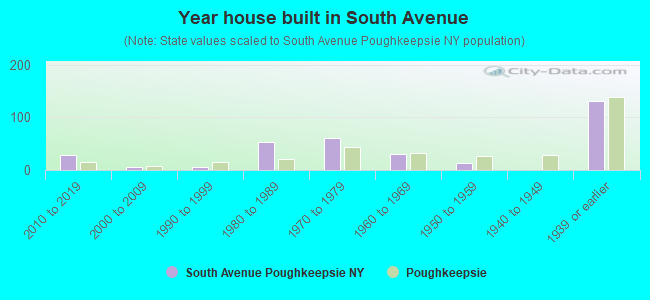
- Year house built in South Avenue
- 02020 or later
- 292010 to 2019
- 52000 to 2009
- 61990 to 1999
- 531980 to 1989
- 611970 to 1979
- 301960 to 1969
- 131950 to 1959
- 01940 to 1949
- 1311939 or earlier
City-data.com crime index for city in 2020 (higher means more crime):
| City: | 330.5 |
| U.S. average: | 219.5 |
Travel time to work (commute)
![Travel time to work (commute)]()
- 565 to 9 minutes
- 8310 to 14 minutes
- 1815 to 19 minutes
- 320 to 24 minutes
- 3430 to 34 minutes
- 1535 to 39 minutes
- 345 to 59 minutes
- 2460 to 89 minutes
- 790 or more minutes

Means of transportation to work
![Means of transportation to work]()
- 41.7%85Drove a car alone
- 0.5%1Carpooled
- 24.1%49Bus
- 9.8%20Long-distance train or commuter rail
- 9.3%19Taxi
- 0.5%1Bicycle
- 5.4%11Walked
- 2.9%6Other means
- 14.2%29Worked at home

Time leaving home to go to work
![Time leaving home to go to work]()
- 65:00 a.m. to 5:29 a.m.
- 75:30 a.m. to 5:59 a.m.
- 86:00 a.m. to 6:29 a.m.
- 176:30 a.m. to 6:59 a.m.
- 647:00 a.m. to 7:29 a.m.
- 157:30 a.m. to 7:59 a.m.
- 348:00 a.m. to 8:29 a.m.
- 18:30 a.m. to 8:59 a.m.
- 209:00 a.m. to 9:59 a.m.
- 510:00 a.m. to 10:59 a.m.
- 5912:00 p.m. to 3:59 p.m.
- 84:00 p.m. to 11:59 p.m.

Occupations of males:
- Percentage of males in management occupations (except farmers):
Here: 1.8% city: 8.5%
- Percentage of males in computer and mathematical occupations:
Here: 10.2% city: 5.4%
- Percentage of males in architecture and engineering occupations:
Here: 1.1% city: 3.1%
- Percentage of males in legal occupations:
Here: 1.8% city: 0.5%
- Percentage of males in education, training, and library occupations:
Here: 1.8% city: 3.5%
- Percentage of males in arts, design, entertainment, sports, and media occupations:
Here: 3.6% city: 2.3%
- Percentage of males in healthcare practitioners and technical occupations:
Here: 10.9% city: 2.0%
- Percentage of males in service occupations:
Here: 48.1% city: 28.3%
- Percentage of males in sales and office occupations:
Here: 37.3% city: 18.4%
- Percentage of males in construction, extraction, and maintenance occupations:
Here: 45.0% city: 5.7%
- Percentage of males in production occupations:
Here: 8.9% city: 5.5%
Occupations of females:
- Percentage of females in management occupations (except farmers):
Here: 17.1% city: 6.1%
- Percentage of females in community and social services occupations:
Here: 21.2% city: 4.0%
- Percentage of females in healthcare practitioners and technical occupations:
Here: 18.8% city: 10.3%
- Percentage of females in service occupations:
Here: 42.8% city: 35.2%
- Percentage of females in sales and office occupations:
Here: 6.6% city: 21.0%
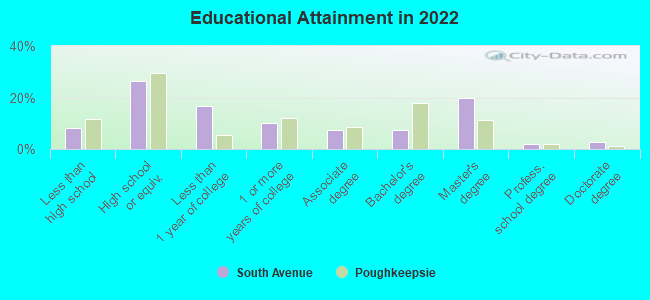
Education in this neighborhood (subdivision or community):
- Percentage of people 3 years and older in K-12 schools:
South Avenue: 20.4% Poughkeepsie: 15.0%
- Percentage of people 3 years and older in undergraduate colleges:
South Avenue: 5.3% Poughkeepsie: 6.6%
- Percentage of people 3 years and older in grad. or professional schools:
South Avenue: 1.5% Poughkeepsie: 1.7%
- Percentage of students K-12 enrolled in private schools:
South Avenue: 15.1% Poughkeepsie: 16.4%
Percentage of population below poverty level:
| South Avenue: | 9.7% |
| Poughkeepsie: | 18.3% |
Median year owner moved in (as recorded in 2022):
Median year renter moved in (as recorded in 2022):
| South Avenue: | 2001 |
| Poughkeepsie: | 2005 |
Median year renter moved in (as recorded in 2022):
| South Avenue: | 2013 |
| Poughkeepsie: | 2015 |
Percentage of married-couple families with both working:
| South Avenue: | 100.0% |
| Poughkeepsie: | 53.9% |
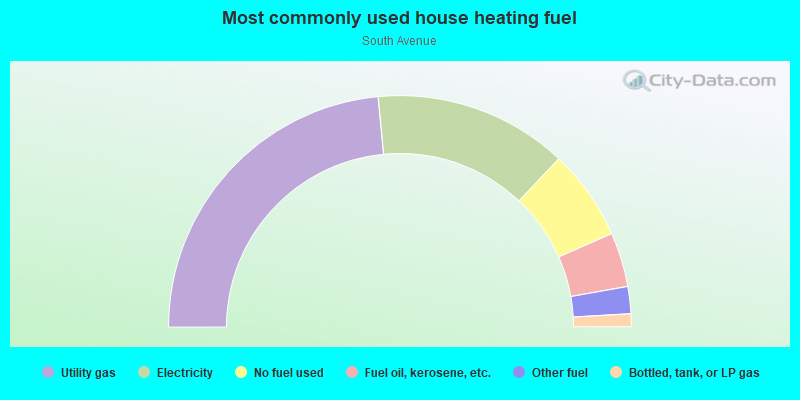
- 47.0%Utility gas
- 27.1%Electricity
- 12.7%No fuel used
- 7.6%Fuel oil, kerosene, etc.
- 3.8%Other fuel
- 1.8%Bottled, tank, or LP gas
Roads and streets:
South Ave
Length: 0.32 miles
Directions: N-S, SW-NE
Address range: 86 to 207
Directions: N-S, SW-NE
Address range: 86 to 207
Franklin St
Length: 0.29 miles
Directions: E-W, SE-NW
Address range: 1 to 102
Directions: E-W, SE-NW
Address range: 1 to 102
Reade Pl
Length: 0.24 miles
Direction: E-W
Address range: 1 to 45
Direction: E-W
Address range: 1 to 45
Dean Pl
Length: 0.21 miles
Direction: E-W
Address range: 1 to 40
Direction: E-W
Address range: 1 to 40
Lincoln Ave
Length: 0.19 miles
Direction: N-S
Address range: 35 to 99
Direction: N-S
Address range: 35 to 99
Livingston St
Length: 0.15 miles
Directions: E-W, SW-NE
Address range: 42 to 84
Directions: E-W, SW-NE
Address range: 42 to 84
Young St
Length: 0.11 miles
Direction: N-S
Address range: 1 to 25
Direction: N-S
Address range: 1 to 25
Oak St
Length: 0.07 miles
Direction: E-W
Address range: 1 to 99
Direction: E-W
Address range: 1 to 99
Columbia St
Length: 0.07 miles
Directions: E-W, SE-NW
Address range: 35 to 58
Directions: E-W, SE-NW
Address range: 35 to 58
Suncrest Ct
Length: 0.07 miles
Direction: E-W
Address range: 1 to 13
Direction: E-W
Address range: 1 to 13
Linwood Ave
Length: 0.02 miles
Direction: N-S
Address range: 1 to 12
Direction: N-S
Address range: 1 to 12