South Rock neighborhood in Rockford, Illinois (IL), 61102 detailed profile
Settings
X


Business Search - 14 Million verified businesses
Area: 1.876 square miles
Population: 3,535
Population density:
| South Rock: | 1,885 people per square mile |
| Rockford: | 2,604 people per square mile |

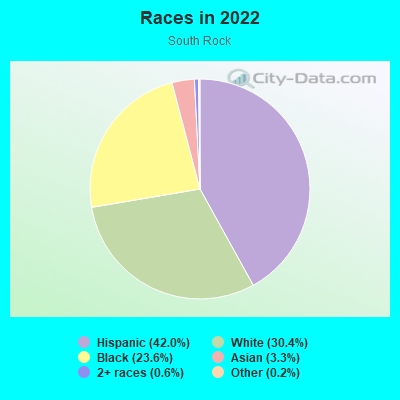
- 1,53342.0%Hispanic or Latino
- 1,11030.4%White
- 86323.6%Black
- 1213.3%Asian
- 210.6%Two or more races
- 60.2%Some other race
Median household income in 2022:
| South Rock: | $35,536 |
| Rockford: | $53,994 |
Distribution of median household income
![Distribution of median household income]()
- 142Less than $10,000
- 147$10,000 to $19,999
- 403$20,000 to $29,999
- 153$30,000 to $39,999
- 249$40,000 to $49,999
- 60$50,000 to $59,999
- 90$60,000 to $74,999
- 60$75,000 to $99,999
- 149$100,000 to $124,999
- 45$125,000 to $149,999
- 5$150,000 to $199,999
- 11$200,000 or more

Distribution of owner-occupied house/condo value
![Distribution of owner-occupied house/condo value]()
- 296Less than $50,000
- 624$50,000 to $99,999
- 191$100,000 to $149,999
- 123$150,000 to $199,999
- 24$200,000 to $249,999
- 11$250,000 to $299,999

Distribution of rent paid by renters
![Distribution of rent paid by renters]()
- 20Less than $100
- 125$100 to $199
- 14$200 to $299
- 7$400 to $499
- 14$500 to $599
- 34$600 to $699
- 147$700 to $799
- 88$800 to $899
- 75$900 to $999
- 4$1,000 to $1,249
- 17$1,250 to $1,499

Median rent in 2022:
| South Rock: | $801 |
| Rockford: | $728 |
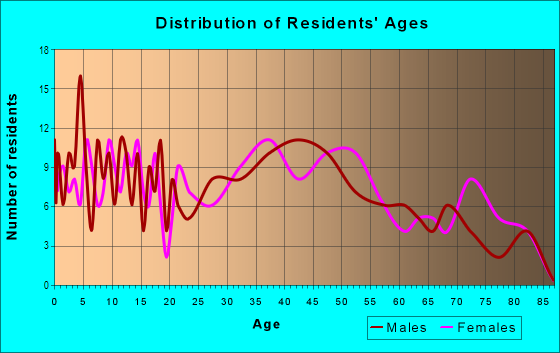
| Males: | 1,848 |
| Females: | 1,687 |
Males:
| This neighborhood: | 44.8 years |
| Whole city: | 35.2 years |
| This neighborhood: | 36.8 years |
| Whole city: | 39.3 years |
Average household size:
| South Rock: | 2.3 people |
| Rockford: | 2.4 people |
Percentage of family households:
| South Rock: | 38.0% |
| Rockford: | 39.3% |
| Here: | 37.5% |
| Rockford: | 36.1% |
Percentage of married-couple families with children (among all households):
| South Rock: | 22.9% |
| Rockford: | 19.8% |
Percentage of single-mother households (among all households):
| South Rock: | 19.7% |
| Rockford: | 16.9% |
Percentage of never married males 15 years old and over:
Percentage of never married females 15 years old and over:
| South Rock: | 25.7% |
| Rockford: | 20.2% |
Percentage of never married females 15 years old and over:
| South Rock: | 8.3% |
| city: | 19.9% |
Percentage of people that speak English not well or not at all:
| South Rock: | 7.3% |
| Rockford: | 2.9% |
Percentage of people born in this state:
Percentage of people born in another U.S. state:
Percentage of native residents but born outside the U.S.:
Percentage of foreign born residents:
| Here: | 67.7% |
| Rockford: | 70.1% |
Percentage of people born in another U.S. state:
| South Rock: | 17.2% |
| Rockford: | 17.3% |
Percentage of native residents but born outside the U.S.:
| Here: | 1.0% |
| city: | 2.2% |
Percentage of foreign born residents:
| Here: | 14.1% |
| Rockford: | 10.4% |
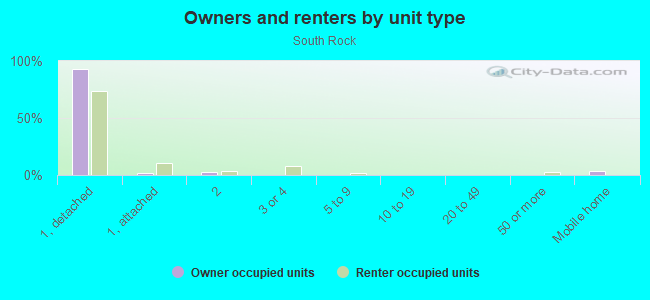
Owner-occupied
Renter-occupied

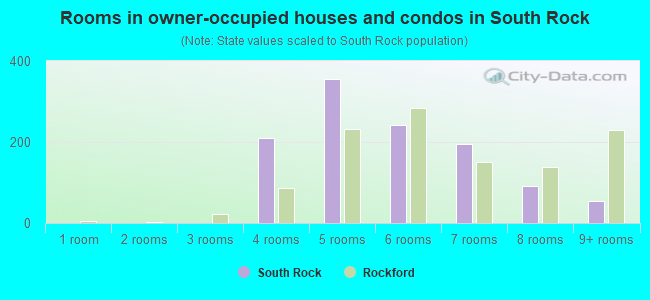
- Rooms in owner-occupied houses and condos in South Rock
- 01 room
- 02 rooms
- 03 rooms
- 2094 rooms
- 3565 rooms
- 2426 rooms
- 1957 rooms
- 928 rooms
- 549+ rooms
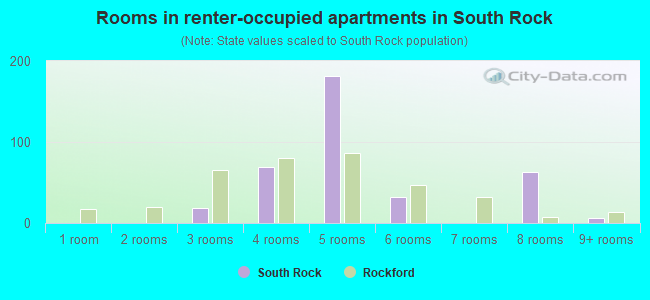
- Rooms in renter-occupied apartments in South Rock
- 01 room
- 02 rooms
- 183 rooms
- 694 rooms
- 1825 rooms
- 326 rooms
- 07 rooms
- 638 rooms
- 69+ rooms
Owner-occupied
Renter-occupied
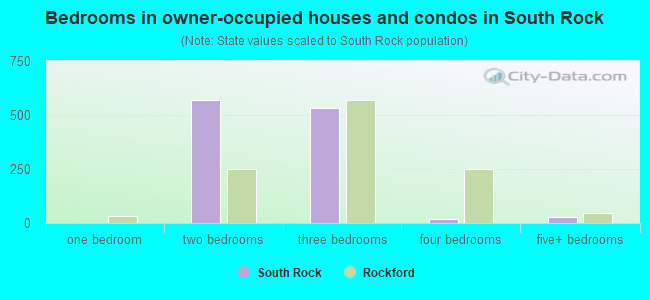
- Bedrooms in owner-occupied houses and condos in South Rock
- 0no bedroom
- 01 bedroom
- 5712 bedrooms
- 5333 bedrooms
- 194 bedrooms
- 275+ bedrooms
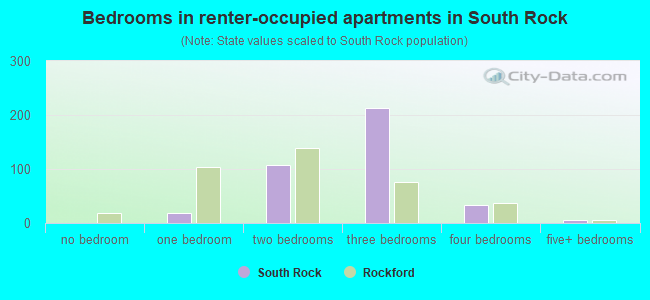
- Bedrooms in renter-occupied apartments in South Rock
- 0no bedroom
- 181 bedroom
- 1072 bedrooms
- 2133 bedrooms
- 344 bedrooms
- 65+ bedrooms
Average number of cars or other vehicles available in houses/condos:
Average number of cars or other vehicles available in apartments:
| This neighborhood: | 1.7 |
| Rockford: | 1.9 |
Average number of cars or other vehicles available in apartments:
| Here: | 2.0 |
| city: | 1.1 |
Percentage of units with a mortgage:
| South Rock: | 32.4% |
| Rockford: | 63.1% |
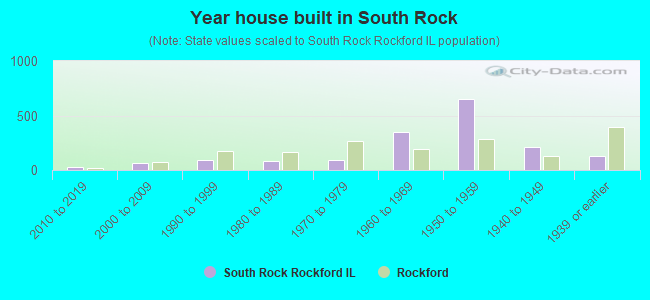
- Year house built in South Rock
- 02020 or later
- 312010 to 2019
- 662000 to 2009
- 891990 to 1999
- 851980 to 1989
- 891970 to 1979
- 3511960 to 1969
- 6481950 to 1959
- 2101940 to 1949
- 1251939 or earlier
City-data.com crime index for city in 2020 (higher means more crime):
| City: | 525.8 |
| U.S. average: | 219.5 |
Travel time to work (commute)
![Travel time to work (commute)]()
- 6Less than 5 minutes
- 45 to 9 minutes
- 15610 to 14 minutes
- 7815 to 19 minutes
- 9420 to 24 minutes
- 1925 to 29 minutes
- 1730 to 34 minutes
- 635 to 39 minutes
- 2040 to 44 minutes
- 11145 to 59 minutes
- 3060 to 89 minutes
- 1690 or more minutes

Means of transportation to work
![Means of transportation to work]()
- 66.2%938Drove a car alone
- 18.8%266Carpooled
- 7.8%111Bus
- 1.0%14Taxi
- 0.6%9Walked
- 0.7%10Other means
- 6.4%91Worked at home

Time leaving home to go to work
![Time leaving home to go to work]()
- 4012:00 a.m. to 4:59 a.m.
- 405:00 a.m. to 5:29 a.m.
- 975:30 a.m. to 5:59 a.m.
- 96:00 a.m. to 6:29 a.m.
- 236:30 a.m. to 6:59 a.m.
- 117:00 a.m. to 7:29 a.m.
- 307:30 a.m. to 7:59 a.m.
- 318:00 a.m. to 8:29 a.m.
- 448:30 a.m. to 8:59 a.m.
- 89:00 a.m. to 9:59 a.m.
- 6912:00 p.m. to 3:59 p.m.
- 614:00 p.m. to 11:59 p.m.

Occupations of males:
- Percentage of males in management occupations (except farmers):
Here: 1.6% city: 7.0%
- Percentage of males in business and financial operations occupations:
Here: 6.4% city: 2.3%
- Percentage of males in architecture and engineering occupations:
Here: 1.4% city: 3.2%
- Percentage of males in life, physical, and social science occupations:
Here: 1.9% city: 0.7%
- Percentage of males in education, training, and library occupations:
Here: 2.0% city: 2.5%
- Percentage of males in arts, design, entertainment, sports, and media occupations:
Here: 2.2% city: 1.4%
- Percentage of males in service occupations:
Here: 2.2% city: 12.6%
- Percentage of males in sales and office occupations:
Here: 7.0% city: 16.0%
- Percentage of males in construction, extraction, and maintenance occupations:
Here: 8.7% city: 6.8%
- Percentage of males in production occupations:
Here: 50.2% city: 18.7%
- Percentage of males in transportation occupations:
Here: 2.3% city: 6.0%
- Percentage of males in material moving occupations:
Here: 11.2% city: 10.5%
Occupations of females:
- Percentage of females in management occupations (except farmers):
Here: 12.2% city: 6.2%
- Percentage of females in business and financial operations occupations:
Here: 3.4% city: 3.4%
- Percentage of females in computer and mathematical occupations:
Here: 18.8% city: 1.4%
- Percentage of females in community and social services occupations:
Here: 7.1% city: 2.0%
- Percentage of females in education, training, and library occupations:
Here: 4.5% city: 6.1%
- Percentage of females in healthcare practitioners and technical occupations:
Here: 1.2% city: 10.2%
- Percentage of females in service occupations:
Here: 22.5% city: 26.8%
- Percentage of females in sales and office occupations:
Here: 35.2% city: 25.9%
- Percentage of females in farming, fishing, and forestry occupations:
Here: 1.7% city: 0.2%
- Percentage of females in production occupations:
Here: 125.2% city: 7.5%
- Percentage of females in transportation occupations:
Here: 8.1% city: 2.0%
- Percentage of females in material moving occupations:
Here: 3.4% city: 4.8%
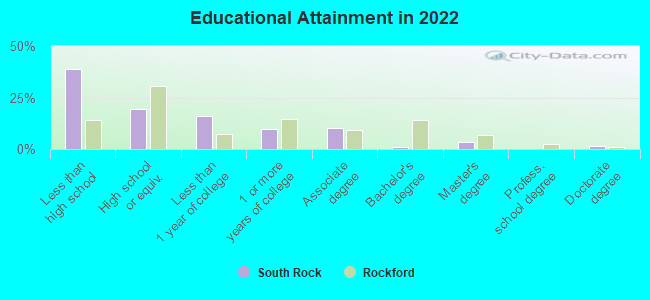
Education in this neighborhood (subdivision or community):
- Percentage of people 3 years and older in K-12 schools:
South Rock: 17.2% Rockford: 17.1%
- Percentage of people 3 years and older in undergraduate colleges:
South Rock: 0.0% Rockford: 3.4%
- Percentage of people 3 years and older in grad. or professional schools:
South Rock: 1.5% Rockford: 0.7%
- Percentage of students K-12 enrolled in private schools:
South Rock: 15.5% Rockford: 14.7%
Percentage of population below poverty level:
| South Rock: | 21.0% |
| Rockford: | 21.1% |
Median year owner moved in (as recorded in 2022):
Median year renter moved in (as recorded in 2022):
| South Rock: | 2002 |
| Rockford: | 2010 |
Median year renter moved in (as recorded in 2022):
| South Rock: | 2015 |
| Rockford: | 2019 |
Percentage of married-couple families with both working:
| South Rock: | 42.2% |
| Rockford: | 64.5% |
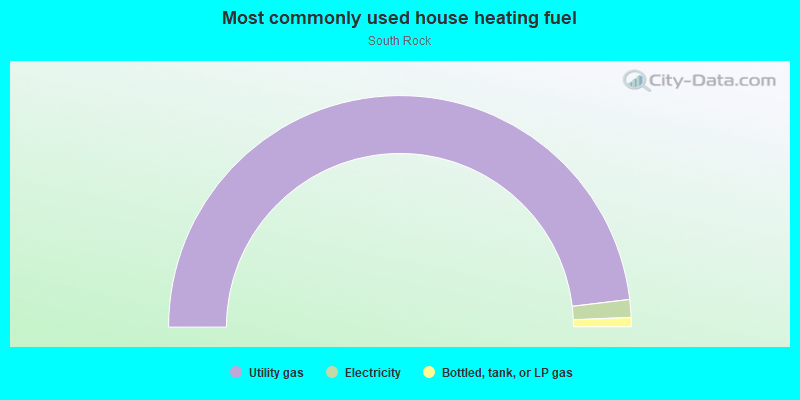
- 96.2%Utility gas
- 2.5%Electricity
- 1.3%Bottled, tank, or LP gas
Highways in this neighborhood:
S Main St (State Rte 2)
Length: 3.65 miles
Directions: E-W, N-S, SE-NW, SW-NE
Address range: 2856 to 4999
Directions: E-W, N-S, SE-NW, SW-NE
Address range: 2856 to 4999
Roads and streets:
(US Hwy 20)
Length: 1.31 miles
Direction: E-W
Direction: E-W
Simpson Rd
Length: 0.92 miles
Directions: E-W, SE-NW
Address range: 500 to 1223
Directions: E-W, SE-NW
Address range: 500 to 1223
Iroquois Ave
Length: 0.83 miles
Direction: E-W
Address range: 200 to 799
Direction: E-W
Address range: 200 to 799
Southrock Dr
Length: 0.66 miles
Direction: E-W
Address range: 500 to 999
Direction: E-W
Address range: 500 to 999
Sauk Ln
Length: 0.62 miles
Direction: E-W
Direction: E-W
Aquamarine Dr
Length: 0.61 miles
Direction: E-W
Address range: 3100 to 3739
Direction: E-W
Address range: 3100 to 3739
Onyx Pkwy
Length: 0.59 miles
Direction: E-W
Address range: 3100 to 3599
Direction: E-W
Address range: 3100 to 3599
S Central Ave
Length: 0.59 miles
Direction: N-S
Address range: 3500 to 3999
Direction: N-S
Address range: 3500 to 3999
Pelley Rd
Length: 0.36 miles
Direction: E-W
Address range: 3300 to 3605
Direction: E-W
Address range: 3300 to 3605
Algonquin Blvd
Length: 0.34 miles
Directions: N-S, SE-NW
Address range: 3500 to 3899
Directions: N-S, SE-NW
Address range: 3500 to 3899
Seminole Ave
Length: 0.30 miles
Direction: E-W
Address range: 221 to 499
Direction: E-W
Address range: 221 to 499
Azurite Pl
Length: 0.28 miles
Direction: E-W
Address range: 3300 to 3599
Direction: E-W
Address range: 3300 to 3599
Chippewa Ave
Length: 0.26 miles
Directions: N-S, SW-NE
Address range: 3600 to 3799
Directions: N-S, SW-NE
Address range: 3600 to 3799
Jade Pkwy
Length: 0.24 miles
Direction: N-S
Address range: 4600 to 4899
Direction: N-S
Address range: 4600 to 4899
Harrison Ave
Length: 0.24 miles
Direction: E-W
Address range: 1 to 499
Direction: E-W
Address range: 1 to 499
Marble Mnr
Length: 0.22 miles
Direction: N-S
Address range: 4650 to 4899
Direction: N-S
Address range: 4650 to 4899
Amethyst Ridge
Length: 0.22 miles
Direction: N-S
Address range: 4650 to 4899
Direction: N-S
Address range: 4650 to 4899
Tourmaline Trl
Length: 0.22 miles
Direction: N-S
Address range: 4650 to 4899
Direction: N-S
Address range: 4650 to 4899
Seneca Ave
Length: 0.20 miles
Direction: E-W
Address range: 200 to 399
Direction: E-W
Address range: 200 to 399
Zircon Ln
Length: 0.19 miles
Direction: E-W
Address range: 3300 to 3958
Direction: E-W
Address range: 3300 to 3958
Topaz Ter
Length: 0.19 miles
Direction: N-S
Address range: 4600 to 4899
Direction: N-S
Address range: 4600 to 4899
Harding Rd
Length: 0.16 miles
Direction: E-W
Address range: 1000 to 1165
Direction: E-W
Address range: 1000 to 1165
W Harrison Ave
Length: 0.14 miles
Directions: E-W, SE-NW
Directions: E-W, SE-NW
Dawes Rd
Length: 0.13 miles
Direction: N-S
Address range: 3900 to 3999
Direction: N-S
Address range: 3900 to 3999
Navaho Ave
Length: 0.13 miles
Direction: N-S
Address range: 3700 to 3899
Direction: N-S
Address range: 3700 to 3899
Clarine Ln
Length: 0.08 miles
Directions: N-S, SE-NW
Address range: 3600 to 3709
Directions: N-S, SE-NW
Address range: 3600 to 3709
Beltline Rd
Length: 0.06 miles
Direction: N-S
Address range: 5100 to 5299
Direction: N-S
Address range: 5100 to 5299
Belt Line Rd
Length: 0.05 miles
Direction: N-S
Direction: N-S
Agate Ct
Length: 0.05 miles
Direction: N-S
Address range: 3474 to 3599
Direction: N-S
Address range: 3474 to 3599
Beryl Pl
Length: 0.03 miles
Direction: N-S
Address range: 4866 to 4899
Direction: N-S
Address range: 4866 to 4899
Other features:
Fuller Crk
Length: 0.98 miles
Directions: E-W, N-S, SE-NW, SW-NE
Directions: E-W, N-S, SE-NW, SW-NE
Rock Riv
Length: 0.03 miles
Directions: N-S, SW-NE
Directions: N-S, SW-NE