South Side Downtown (South Side Business District) neighborhood in Bethlehem, Pennsylvania (PA), 18015 detailed profile
Settings
X


Business Search - 14 Million verified businesses
Area: 0.335 square miles
Population: 2,807
Population density:
| South Side Downtown (South Side Business District): | 8,375 people per square mile |
| Bethlehem: | 4,095 people per square mile |

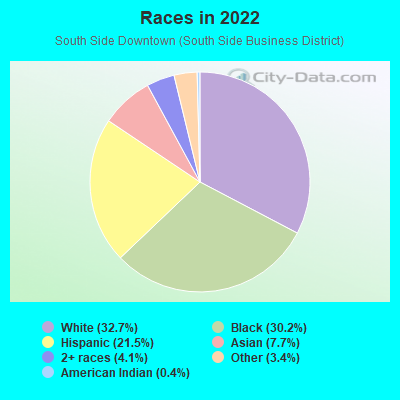
- 1,00432.7%White
- 92630.2%Black
- 65921.5%Hispanic or Latino
- 2367.7%Asian
- 1264.1%Two or more races
- 1043.4%Some other race
- 120.4%American Indian
Median household income in 2022:
| South Side Downtown (South Side Business District): | $53,017 |
| Bethlehem: | $61,786 |
Distribution of median household income
![Distribution of median household income]()
- 92Less than $10,000
- 341$10,000 to $19,999
- 200$20,000 to $29,999
- 226$30,000 to $39,999
- 96$40,000 to $49,999
- 66$50,000 to $59,999
- 63$60,000 to $74,999
- 48$75,000 to $99,999
- 97$100,000 to $124,999
- 70$125,000 to $149,999
- 104$150,000 to $199,999
- 42$200,000 or more

Distribution of owner-occupied house/condo value
![Distribution of owner-occupied house/condo value]()
- 65Less than $50,000
- 232$50,000 to $99,999
- 40$100,000 to $149,999
- 20$150,000 to $199,999
- 28$200,000 to $249,999
- 13$250,000 to $299,999
- 13$300,000 to $399,999
- 2$400,000 to $499,999
- 3$500,000 to $749,999
- 14$750,000 to $999,999
- 1$1,000,000 or more

Distribution of rent paid by renters
![Distribution of rent paid by renters]()
- 29Less than $100
- 36$100 to $199
- 144$200 to $299
- 91$300 to $399
- 270$400 to $499
- 450$500 to $599
- 225$600 to $699
- 172$700 to $799
- 103$800 to $899
- 33$900 to $999
- 162$1,000 to $1,249
- 139$1,250 to $1,499
- 133$1,500 to $1,999
- 200$2,000 or more

Median rent in 2022:
| South Side Downtown (South Side Business District): | $879 |
| Bethlehem: | $1,043 |
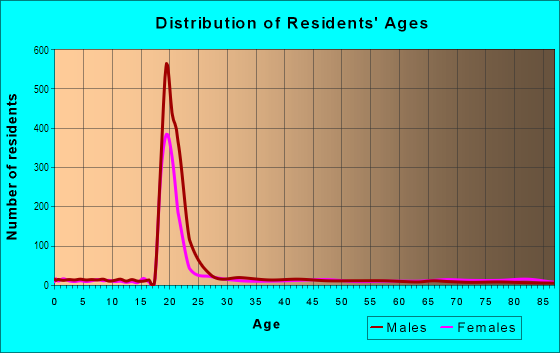
| Males: | 1,422 |
| Females: | 1,385 |
Males:
| This neighborhood: | 26.7 years |
| Whole city: | 33.2 years |
| This neighborhood: | 29.0 years |
| Whole city: | 36.2 years |
Average household size:
| South Side Downtown (South Side Business District): | 2.8 people |
| Bethlehem: | 2.3 people |
Percentage of family households:
| South Side Downtown (South Side Business District): | 26.0% |
| Bethlehem: | 36.3% |
| Here: | 15.3% |
| Bethlehem: | 32.6% |
Percentage of married-couple families with children (among all households):
| South Side Downtown (South Side Business District): | 3.4% |
| Bethlehem: | 19.5% |
Percentage of single-mother households (among all households):
| South Side Downtown (South Side Business District): | 26.3% |
| Bethlehem: | 18.6% |
Percentage of never married males 15 years old and over:
Percentage of never married females 15 years old and over:
| South Side Downtown (South Side Business District): | 43.0% |
| Bethlehem: | 26.5% |
Percentage of never married females 15 years old and over:
| South Side Downtown (South Side Business District): | 28.9% |
| city: | 23.0% |
Percentage of people that speak English not well or not at all:
| South Side Downtown (South Side Business District): | 7.2% |
| Bethlehem: | 4.7% |
Percentage of people born in this state:
Percentage of people born in another U.S. state:
Percentage of native residents but born outside the U.S.:
Percentage of foreign born residents:
| Here: | 36.1% |
| Bethlehem: | 54.0% |
Percentage of people born in another U.S. state:
| South Side Downtown (South Side Business District): | 37.3% |
| Bethlehem: | 28.7% |
Percentage of native residents but born outside the U.S.:
| Here: | 10.5% |
| city: | 8.3% |
Percentage of foreign born residents:
| Here: | 16.0% |
| Bethlehem: | 9.0% |
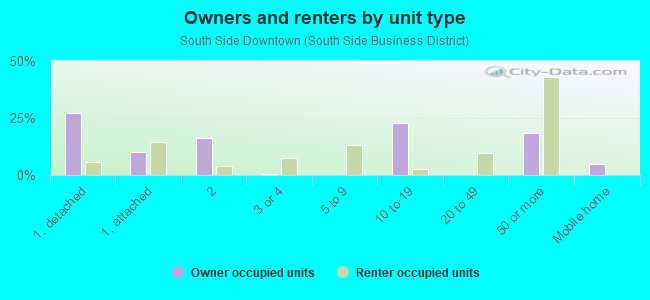
Owner-occupied
Renter-occupied

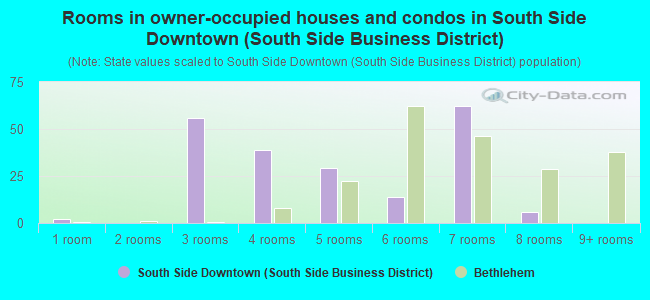
- Rooms in owner-occupied houses and condos in South Side Downtown <
> - 21 room
- 02 rooms
- 563 rooms
- 394 rooms
- 295 rooms
- 146 rooms
- 627 rooms
- 68 rooms
- 09+ rooms
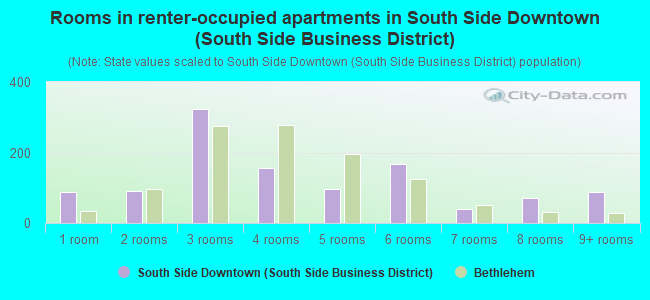
- Rooms in renter-occupied apartments in South Side Downtown <
> - 871 room
- 922 rooms
- 3233 rooms
- 1554 rooms
- 965 rooms
- 1676 rooms
- 407 rooms
- 728 rooms
- 889+ rooms
Owner-occupied
Renter-occupied
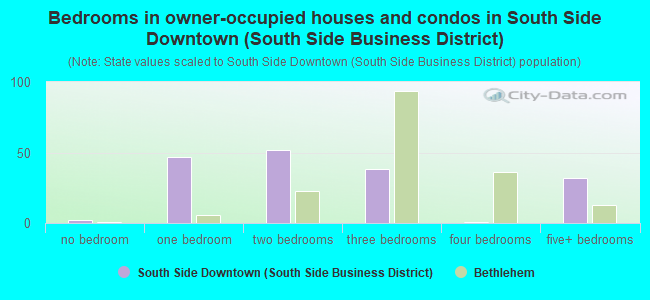
- Bedrooms in owner-occupied houses and condos in South Side Downtown <
> - 2no bedroom
- 471 bedroom
- 522 bedrooms
- 383 bedrooms
- 14 bedrooms
- 325+ bedrooms
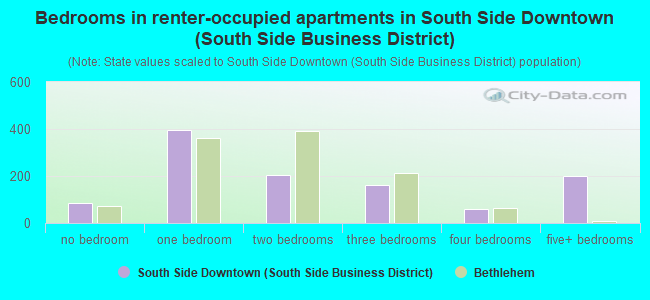
- Bedrooms in renter-occupied apartments in South Side Downtown <
> - 87no bedroom
- 3961 bedroom
- 2032 bedrooms
- 1613 bedrooms
- 584 bedrooms
- 2005+ bedrooms
Average number of cars or other vehicles available in houses/condos:
Average number of cars or other vehicles available in apartments:
| This neighborhood: | |
| Bethlehem: |
Average number of cars or other vehicles available in apartments:
| Here: | 0.5 |
| city: | 1.1 |
Percentage of units with a mortgage:
| South Side Downtown (South Side Business District): | 70.7% |
| Bethlehem: | 58.3% |
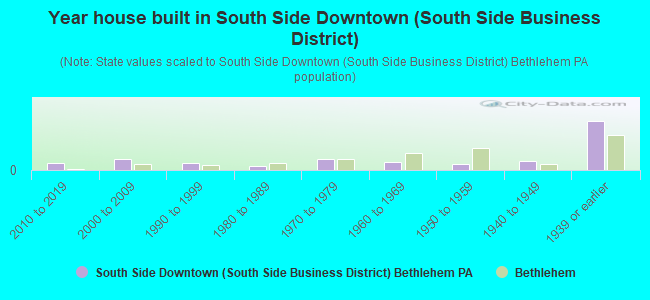
- Year house built in South Side Downtown <
> - 02020 or later
- 952010 to 2019
- 1372000 to 2009
- 911990 to 1999
- 451980 to 1989
- 1371970 to 1979
- 1031960 to 1969
- 721950 to 1959
- 1151940 to 1949
- 6211939 or earlier
City-data.com crime index for city in 2020 (higher means more crime):
| City: | 25.9 |
| U.S. average: | 219.5 |
Travel time to work (commute)
![Travel time to work (commute)]()
- 28Less than 5 minutes
- 2635 to 9 minutes
- 21510 to 14 minutes
- 21015 to 19 minutes
- 11720 to 24 minutes
- 2425 to 29 minutes
- 11030 to 34 minutes
- 1235 to 39 minutes
- 2840 to 44 minutes
- 6545 to 59 minutes
- 3060 to 89 minutes
- 890 or more minutes

Means of transportation to work
![Means of transportation to work]()
- 53.0%665Drove a car alone
- 3.7%46Carpooled
- 6.1%76Bus
- 0.1%1Subway or elevated rail
- 5.2%65Taxi
- 2.1%26Bicycle
- 19.3%242Walked
- 13.0%163Other means
- 15.9%200Worked at home

Time leaving home to go to work
![Time leaving home to go to work]()
- 1612:00 a.m. to 4:59 a.m.
- 335:00 a.m. to 5:29 a.m.
- 495:30 a.m. to 5:59 a.m.
- 1336:00 a.m. to 6:29 a.m.
- 606:30 a.m. to 6:59 a.m.
- 1447:00 a.m. to 7:29 a.m.
- 577:30 a.m. to 7:59 a.m.
- 1338:00 a.m. to 8:29 a.m.
- 268:30 a.m. to 8:59 a.m.
- 739:00 a.m. to 9:59 a.m.
- 2310:00 a.m. to 10:59 a.m.
- 3111:00 a.m. to 11:59 a.m.
- 28012:00 p.m. to 3:59 p.m.
- 544:00 p.m. to 11:59 p.m.

Occupations of males:
- Percentage of males in management occupations (except farmers):
Here: 1.3% city: 11.6%
- Percentage of males in business and financial operations occupations:
Here: 1.4% city: 4.1%
- Percentage of males in computer and mathematical occupations:
Here: 4.1% city: 3.9%
- Percentage of males in life, physical, and social science occupations:
Here: 1.5% city: 2.1%
- Percentage of males in legal occupations:
Here: 2.8% city: 0.8%
- Percentage of males in education, training, and library occupations:
Here: 8.7% city: 4.7%
- Percentage of males in healthcare practitioners and technical occupations:
Here: 2.9% city: 2.6%
- Percentage of males in service occupations:
Here: 24.5% city: 16.3%
- Percentage of males in sales and office occupations:
Here: 20.7% city: 13.0%
- Percentage of males in construction, extraction, and maintenance occupations:
Here: 3.0% city: 7.8%
- Percentage of males in production occupations:
Here: 17.3% city: 8.6%
- Percentage of males in material moving occupations:
Here: 10.5% city: 9.2%
Occupations of females:
- Percentage of females in management occupations (except farmers):
Here: 2.8% city: 6.8%
- Percentage of females in life, physical, and social science occupations:
Here: 2.8% city: 1.3%
- Percentage of females in community and social services occupations:
Here: 3.4% city: 3.5%
- Percentage of females in education, training, and library occupations:
Here: 15.4% city: 11.1%
- Percentage of females in arts, design, entertainment, sports, and media occupations:
Here: 5.9% city: 1.2%
- Percentage of females in healthcare practitioners and technical occupations:
Here: 3.7% city: 10.2%
- Percentage of females in service occupations:
Here: 37.7% city: 25.0%
- Percentage of females in sales and office occupations:
Here: 17.6% city: 21.5%
- Percentage of females in material moving occupations:
Here: 4.2% city: 5.3%
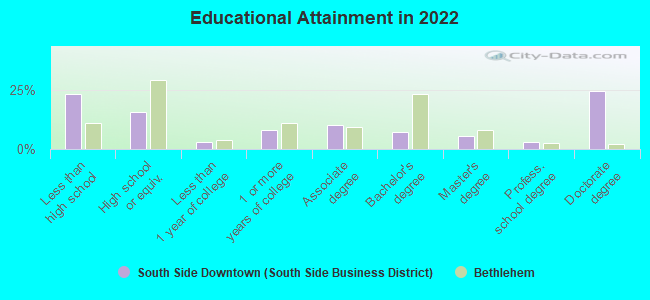
Education in this neighborhood (subdivision or community):
- Percentage of people 3 years and older in K-12 schools:
South Side Downtown (South Side Business District): 11.1% Bethlehem: 14.6%
- Percentage of people 3 years and older in undergraduate colleges:
South Side Downtown (South Side Business District): 33.3% Bethlehem: 9.2%
- Percentage of people 3 years and older in grad. or professional schools:
South Side Downtown (South Side Business District): 9.7% Bethlehem: 3.0%
- Percentage of students K-12 enrolled in private schools:
South Side Downtown (South Side Business District): 51.5% Bethlehem: 9.9%
Percentage of population below poverty level:
| South Side Downtown (South Side Business District): | 42.4% |
| Bethlehem: | 17.9% |
Median year renter moved in (as recorded in 2022):
| South Side Downtown (South Side Business District): | 2015 |
| Bethlehem: | 2018 |
Percentage of married-couple families with both working:
| South Side Downtown (South Side Business District): | 335.5% |
| Bethlehem: | 70.0% |
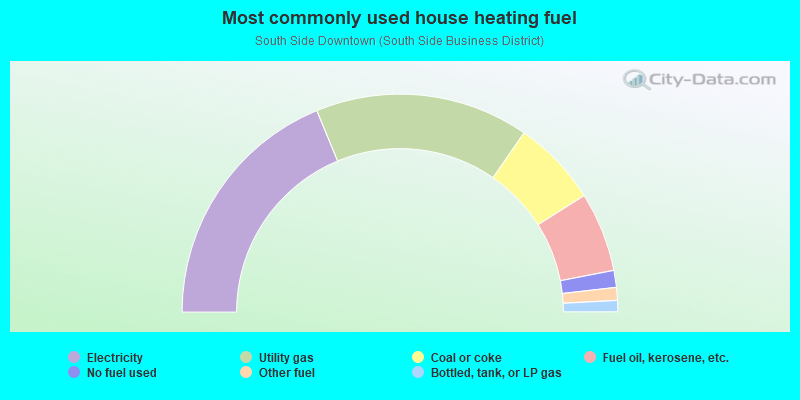
- 37.5%Electricity
- 31.7%Utility gas
- 12.8%Coal or coke
- 11.8%Fuel oil, kerosene, etc.
- 2.5%No fuel used
- 1.9%Other fuel
- 1.7%Bottled, tank, or LP gas
Highways in this neighborhood:
E 3rd St (State Rte 412)
Length: 0.63 miles
Direction: E-W
Address range: 1 to 699
Direction: E-W
Address range: 1 to 699
State Rte 412 (W 3rd St)
Length: 0.27 miles
Direction: E-W
Address range: 1 to 208
Direction: E-W
Address range: 1 to 208
State Rte 412 (Brodhead Ave)
Length: 0.18 miles
Direction: N-S
Address range: 200 to 419
Direction: N-S
Address range: 200 to 419
Broadway (State Rte 412)
Length: 0.08 miles
Direction: SW-NE
Address range: 200 to 299
Direction: SW-NE
Address range: 200 to 299
Roads and streets:
E Morton St
Length: 0.63 miles
Direction: E-W
Address range: 1 to 699
Direction: E-W
Address range: 1 to 699
E 4th St
Length: 0.63 miles
Direction: E-W
Address range: 1 to 699
Direction: E-W
Address range: 1 to 699
E 5th St
Length: 0.45 miles
Direction: E-W
Address range: 200 to 699
Direction: E-W
Address range: 200 to 699
Mechanic St
Length: 0.45 miles
Direction: E-W
Address range: 1 to 499
Direction: E-W
Address range: 1 to 499
Columbia St
Length: 0.36 miles
Direction: E-W
Address range: 1 to 399
Direction: E-W
Address range: 1 to 399
S New St
Length: 0.35 miles
Direction: N-S
Address range: 200 to 499
Direction: N-S
Address range: 200 to 499
Webster St
Length: 0.34 miles
Directions: N-S, SE-NW
Address range: 100 to 448
Directions: N-S, SE-NW
Address range: 100 to 448
W 4th St
Length: 0.29 miles
Direction: E-W
Address range: 1 to 299
Direction: E-W
Address range: 1 to 299
Polk St
Length: 0.22 miles
Direction: N-S
Address range: 200 to 499
Direction: N-S
Address range: 200 to 499
Taylor St
Length: 0.22 miles
Direction: N-S
Address range: 200 to 499
Direction: N-S
Address range: 200 to 499
Graham Pl
Length: 0.22 miles
Direction: E-W
Address range: 2 to 199
Direction: E-W
Address range: 2 to 199
Rink St
Length: 0.22 miles
Direction: E-W
Address range: 1 to 199
Direction: E-W
Address range: 1 to 199
W Morton St
Length: 0.21 miles
Direction: E-W
Address range: 1 to 99
Direction: E-W
Address range: 1 to 99
Buchanan St
Length: 0.19 miles
Direction: N-S
Address range: 300 to 499
Direction: N-S
Address range: 300 to 499
Fillmore St
Length: 0.19 miles
Direction: N-S
Address range: 300 to 499
Direction: N-S
Address range: 300 to 499
Pierce St
Length: 0.19 miles
Direction: N-S
Address range: 300 to 499
Direction: N-S
Address range: 300 to 499
Adams St
Length: 0.19 miles
Direction: N-S
Address range: 200 to 499
Direction: N-S
Address range: 200 to 499
Evans St
Length: 0.18 miles
Direction: E-W
Address range: 500 to 699
Direction: E-W
Address range: 500 to 699
Graham Ct
Length: 0.17 miles
Direction: E-W
Address range: 1 to 199
Direction: E-W
Address range: 1 to 199
Union Station Pl
Length: 0.17 miles
Directions: E-W, N-S, SE-NW
Directions: E-W, N-S, SE-NW
W 2nd St
Length: 0.12 miles
Direction: E-W
Address range: 1 to 99
Direction: E-W
Address range: 1 to 99
Vine St
Length: 0.10 miles
Direction: N-S
Address range: 300 to 448
Direction: N-S
Address range: 300 to 448
E 2nd St
Length: 0.10 miles
Directions: E-W, SE-NW
Address range: 1 to 99
Directions: E-W, SE-NW
Address range: 1 to 99
Technology Dr
Length: 0.07 miles
Direction: N-S
Direction: N-S
Plymouth St
Length: 0.07 miles
Direction: N-S
Address range: 200 to 299
Direction: N-S
Address range: 200 to 299
Northampton St (Northampton Ave)
Length: 0.07 miles
Direction: N-S
Address range: 200 to 299
Direction: N-S
Address range: 200 to 299
Martel St
Length: 0.05 miles
Direction: N-S
Address range: 400 to 499
Direction: N-S
Address range: 400 to 499
Brewer St
Length: 0.04 miles
Direction: N-S
Direction: N-S
Railroad St
Length: 0.04 miles
Direction: E-W
Address range: 400 to 499
Direction: E-W
Address range: 400 to 499
Cress St
Length: 0.03 miles
Directions: E-W, SW-NE
Address range: 232 to 263
Directions: E-W, SW-NE
Address range: 232 to 263
Birkel Ave
Length: 0.03 miles
Direction: N-S
Address range: 400 to 449
Direction: N-S
Address range: 400 to 449
Railroad features:
Conrail
Length: 2.36 miles
Direction: E-W
Direction: E-W
Lehigh Valley RR
Length: 1.35 miles
Directions: E-W, SE-NW
Directions: E-W, SE-NW
Reading RR (Csx RR)
Length: 0.33 miles
Direction: E-W
Direction: E-W