South Third Avenue District neighborhood in Chula Vista, California (CA), 91911 detailed profile
Settings
X


Business Search - 14 Million verified businesses
Area: 0.232 square miles
Population: 2,063
Population density:
| South Third Avenue District: | 8,902 people per square mile |
| Chula Vista: | 5,711 people per square mile |

- 1,61074.2%Hispanic or Latino
- 2129.8%Asian
- 1928.8%White
- 1014.7%Native Hawaiian and Other
Pacific Islander - 361.7%Two or more races
- 200.9%Black

Median household income in 2022:
| South Third Avenue District: | $65,509 |
| Chula Vista: | $101,190 |
Distribution of median household income
![Distribution of median household income]()
- 33Less than $10,000
- 111$10,000 to $19,999
- 169$20,000 to $29,999
- 189$30,000 to $39,999
- 77$40,000 to $49,999
- 82$50,000 to $59,999
- 97$60,000 to $74,999
- 91$75,000 to $99,999
- 72$100,000 to $124,999
- 38$125,000 to $149,999
- 54$150,000 to $199,999
- 69$200,000 or more

Distribution of owner-occupied house/condo value
![Distribution of owner-occupied house/condo value]()
- 7Less than $50,000
- 22$50,000 to $99,999
- 10$100,000 to $149,999
- 3$150,000 to $199,999
- 26$300,000 to $399,999
- 26$400,000 to $499,999
- 110$500,000 to $749,999
- 51$750,000 to $999,999

Distribution of rent paid by renters
![Distribution of rent paid by renters]()
- 239$200 to $299
- 45$400 to $499
- 33$500 to $599
- 6$700 to $799
- 36$900 to $999
- 39$1,000 to $1,249
- 74$1,250 to $1,499
- 177$1,500 to $1,999
- 230$2,000 or more

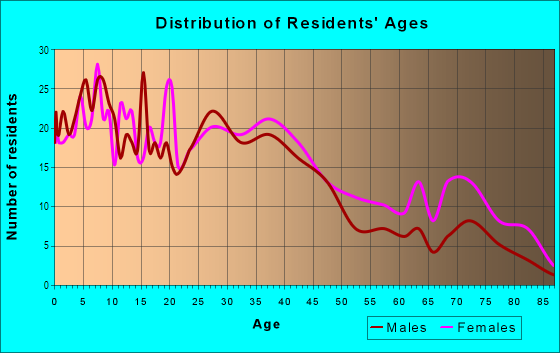
| Males: | 1,067 |
| Females: | 995 |
Males:
| This neighborhood: | 38.1 years |
| Whole city: | 34.8 years |
| This neighborhood: | 47.9 years |
| Whole city: | 37.4 years |
Average household size:
| South Third Avenue District: | 11.0 people |
| Chula Vista: | 3.2 people |
Percentage of family households:
| South Third Avenue District: | 45.6% |
| Chula Vista: | 57.2% |
| Here: | 49.6% |
| Chula Vista: | 54.5% |
Percentage of married-couple families with children (among all households):
| South Third Avenue District: | 19.9% |
| Chula Vista: | 22.9% |
Percentage of single-mother households (among all households):
| South Third Avenue District: | 14.4% |
| Chula Vista: | 5.5% |
Percentage of never married males 15 years old and over:
Percentage of never married females 15 years old and over:
| South Third Avenue District: | 25.5% |
| Chula Vista: | 19.8% |
Percentage of never married females 15 years old and over:
| South Third Avenue District: | 15.2% |
| city: | 16.5% |
Percentage of people that speak English not well or not at all:
| South Third Avenue District: | 16.7% |
| Chula Vista: | 8.7% |
Percentage of people born in this state:
Percentage of people born in another U.S. state:
Percentage of native residents but born outside the U.S.:
Percentage of foreign born residents:
| Here: | 55.5% |
| Chula Vista: | 56.5% |
Percentage of people born in another U.S. state:
| South Third Avenue District: | 5.8% |
| Chula Vista: | 13.1% |
Percentage of native residents but born outside the U.S.:
| Here: | 2.7% |
| city: | 2.8% |
Percentage of foreign born residents:
| Here: | 36.1% |
| Chula Vista: | 27.6% |

Owner-occupied
Renter-occupied


- Rooms in owner-occupied houses and condos in South Third Avenue District
- 01 room
- 162 rooms
- 133 rooms
- 374 rooms
- 945 rooms
- 626 rooms
- 227 rooms
- 588 rooms
- 09+ rooms

- Rooms in renter-occupied apartments in South Third Avenue District
- 131 room
- 1112 rooms
- 2323 rooms
- 914 rooms
- 635 rooms
- 226 rooms
- 867 rooms
- 358 rooms
- 09+ rooms
Owner-occupied
Renter-occupied

- Bedrooms in owner-occupied houses and condos in South Third Avenue District
- 0no bedroom
- 161 bedroom
- 452 bedrooms
- 1203 bedrooms
- 774 bedrooms
- 05+ bedrooms

- Bedrooms in renter-occupied apartments in South Third Avenue District
- 13no bedroom
- 1711 bedroom
- 2042 bedrooms
- 1173 bedrooms
- 34 bedrooms
- 05+ bedrooms
Average number of cars or other vehicles available in houses/condos:
Average number of cars or other vehicles available in apartments:
| This neighborhood: | 3.8 |
| Chula Vista: | 2.4 |
Average number of cars or other vehicles available in apartments:
| Here: | 0.8 |
| city: | 1.7 |
Percentage of units with a mortgage:
| South Third Avenue District: | 52.0% |
| Chula Vista: | 76.0% |

- Year house built in South Third Avenue District
- 02020 or later
- 1582010 to 2019
- 552000 to 2009
- 1011990 to 1999
- 851980 to 1989
- 1661970 to 1979
- 1721960 to 1969
- 1031950 to 1959
- 791940 to 1949
- 791939 or earlier

City-data.com crime index for city in 2020 (higher means more crime):
| City: | 159.8 |
| U.S. average: | 219.5 |
Travel time to work (commute)
![Travel time to work (commute)]()
- 6Less than 5 minutes
- 825 to 9 minutes
- 10510 to 14 minutes
- 13515 to 19 minutes
- 15320 to 24 minutes
- 9325 to 29 minutes
- 14930 to 34 minutes
- 5935 to 39 minutes
- 4540 to 44 minutes
- 8445 to 59 minutes
- 4860 to 89 minutes
- 3390 or more minutes

Means of transportation to work
![Means of transportation to work]()
- 72.6%690Drove a car alone
- 10.8%103Carpooled
- 3.4%32Bus
- 6.3%60Light rail, streetcar or trolley
- 1.3%12Taxi
- 0.7%7Walked
- 5.9%56Other means
- 14.2%135Worked at home

Time leaving home to go to work
![Time leaving home to go to work]()
- 10112:00 a.m. to 4:59 a.m.
- 485:00 a.m. to 5:29 a.m.
- 515:30 a.m. to 5:59 a.m.
- 596:00 a.m. to 6:29 a.m.
- 1696:30 a.m. to 6:59 a.m.
- 2097:00 a.m. to 7:29 a.m.
- 557:30 a.m. to 7:59 a.m.
- 1178:00 a.m. to 8:29 a.m.
- 428:30 a.m. to 8:59 a.m.
- 409:00 a.m. to 9:59 a.m.
- 2010:00 a.m. to 10:59 a.m.
- 2511:00 a.m. to 11:59 a.m.
- 7112:00 p.m. to 3:59 p.m.
- 284:00 p.m. to 11:59 p.m.

Occupations of males:
- Percentage of males in management occupations (except farmers):
Here: 3.8% city: 9.9%
- Percentage of males in business and financial operations occupations:
Here: 6.4% city: 6.5%
- Percentage of males in computer and mathematical occupations:
Here: 9.1% city: 4.9%
- Percentage of males in education, training, and library occupations:
Here: 3.9% city: 2.3%
- Percentage of males in service occupations:
Here: 11.5% city: 18.4%
- Percentage of males in sales and office occupations:
Here: 10.8% city: 16.0%
- Percentage of males in construction, extraction, and maintenance occupations:
Here: 21.1% city: 9.2%
- Percentage of males in production occupations:
Here: 10.4% city: 5.7%
- Percentage of males in transportation occupations:
Here: 6.4% city: 5.1%
- Percentage of males in material moving occupations:
Here: 7.8% city: 3.7%
Occupations of females:
- Percentage of females in management occupations (except farmers):
Here: 2.2% city: 8.6%
- Percentage of females in business and financial operations occupations:
Here: 1.6% city: 5.6%
- Percentage of females in community and social services occupations:
Here: 1.1% city: 3.1%
- Percentage of females in education, training, and library occupations:
Here: 5.0% city: 7.6%
- Percentage of females in arts, design, entertainment, sports, and media occupations:
Here: 5.1% city: 1.2%
- Percentage of females in healthcare practitioners and technical occupations:
Here: 5.6% city: 10.6%
- Percentage of females in service occupations:
Here: 34.9% city: 22.6%
- Percentage of females in sales and office occupations:
Here: 46.6% city: 29.5%
- Percentage of females in farming, fishing, and forestry occupations:
Here: 1.3% city: 0.4%
- Percentage of females in production occupations:
Here: 1.7% city: 3.0%
Percentage of people 16-64 in Armed Forces:
| South Third Avenue District: | 1.4% |
| Chula Vista: | 4.1% |
Education in this neighborhood (subdivision or community):
- Percentage of people 3 years and older in K-12 schools:
South Third Avenue District: 25.7% Chula Vista: 22.0%
- Percentage of people 3 years and older in undergraduate colleges:
South Third Avenue District: 4.4% Chula Vista: 7.6%
- Percentage of people 3 years and older in grad. or professional schools:
South Third Avenue District: 2.1% Chula Vista: 1.2%
- Percentage of students K-12 enrolled in private schools:
South Third Avenue District: 15.1% Chula Vista: 7.0%
Percentage of population below poverty level:
| South Third Avenue District: | 13.3% |
| Chula Vista: | 10.1% |
Median year renter moved in (as recorded in 2022):
| South Third Avenue District: | 2014 |
| Chula Vista: | 2018 |
Percentage of married-couple families with both working:
| South Third Avenue District: | 70.0% |
| Chula Vista: | 69.2% |

- 58.7%Utility gas
- 28.1%Electricity
- 6.2%No fuel used
- 4.0%Solar energy
- 3.0%Bottled, tank, or LP gas
Roads and streets:
3rd Ave
Length: 1.02 miles
Direction: N-S
Address range: 940 to 1399
Direction: N-S
Address range: 940 to 1399
del Mar Ave
Length: 0.37 miles
Direction: N-S
Address range: 1046 to 1199
Direction: N-S
Address range: 1046 to 1199
Palomar St
Length: 0.28 miles
Direction: E-W
Address range: 250 to 341
Direction: E-W
Address range: 250 to 341
Naples St
Length: 0.22 miles
Direction: E-W
Address range: 266 to 345
Direction: E-W
Address range: 266 to 345
Oxford St
Length: 0.22 miles
Direction: E-W
Address range: 265 to 361
Direction: E-W
Address range: 265 to 361
Emerson St
Length: 0.10 miles
Direction: E-W
Address range: 267 to 299
Direction: E-W
Address range: 267 to 299
Villa Tempra Dr
Length: 0.08 miles
Directions: E-W, N-S, SE-NW
Address range: 1300 to 1399
Directions: E-W, N-S, SE-NW
Address range: 1300 to 1399
Moss St
Length: 0.06 miles
Direction: E-W
Address range: 300 to 321
Direction: E-W
Address range: 300 to 321
Quintard St
Length: 0.06 miles
Direction: E-W
Address range: 276 to 299
Direction: E-W
Address range: 276 to 299
Kennedy St
Length: 0.05 miles
Direction: E-W
Address range: 282 to 299
Direction: E-W
Address range: 282 to 299
Parianos Dr
Length: 0.04 miles
Direction: N-S
Address range: 1200 to 1249
Direction: N-S
Address range: 1200 to 1249
la Tempra Cte
Length: 0.04 miles
Directions: N-S, SE-NW
Directions: N-S, SE-NW
Tempra Pl
Length: 0.02 miles
Direction: N-S
Address range: 1300 to 1399
Direction: N-S
Address range: 1300 to 1399
Cll Tempra
Length: 0.02 miles
Direction: N-S
Address range: 1300 to 1399
Direction: N-S
Address range: 1300 to 1399
la Tempra Corte
Length: 0.02 miles
Direction: N-S
Address range: 1300 to 1399
Direction: N-S
Address range: 1300 to 1399