Southeast Lexington neighborhood in Lexington, Kentucky (KY), 40507, 40508 detailed profile
Settings
X


Area: 0.155 square miles
Population: 3,312
Population density: 21,364 people per square mile

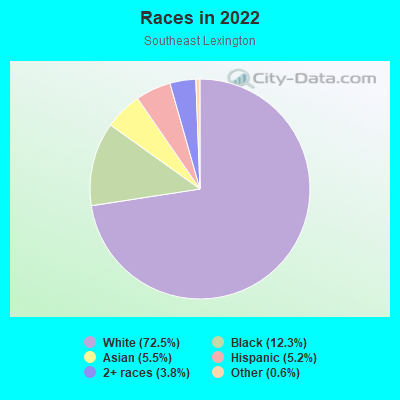
- 2,42072.5%White
- 41012.3%Black
- 1855.5%Asian
- 1745.2%Hispanic or Latino
- 1273.8%Two or more races
- 200.6%Some other race
Median household income in 2022:
| Southeast Lexington: | $36,222 |
| Kentucky: | $59,341 |
Distribution of median household income
![Distribution of median household income]()
- 116Less than $10,000
- 105$10,000 to $19,999
- 111$20,000 to $29,999
- 71$30,000 to $39,999
- 54$40,000 to $49,999
- 52$50,000 to $59,999
- 32$60,000 to $74,999
- 32$75,000 to $99,999
- 15$100,000 to $124,999
- 21$125,000 to $149,999
- 69$150,000 to $199,999
- 24$200,000 or more

Distribution of owner-occupied house/condo value
![Distribution of owner-occupied house/condo value]()
- 8Less than $50,000
- 12$50,000 to $99,999
- 39$100,000 to $149,999
- 36$150,000 to $199,999
- 68$200,000 to $249,999
- 8$250,000 to $299,999
- 24$300,000 to $399,999
- 24$400,000 to $499,999
- 10$500,000 to $749,999
- 49$750,000 to $999,999
- 37$1,000,000 or more

Distribution of rent paid by renters
![Distribution of rent paid by renters]()
- 15$200 to $299
- 10$300 to $399
- 46$400 to $499
- 36$500 to $599
- 87$600 to $699
- 112$700 to $799
- 72$800 to $899
- 43$900 to $999
- 23$1,000 to $1,249
- 24$1,250 to $1,499
- 49$1,500 to $1,999
- 61$2,000 or more

Median rent in 2022:
| Southeast Lexington: | $824 |
| Kentucky: | $702 |
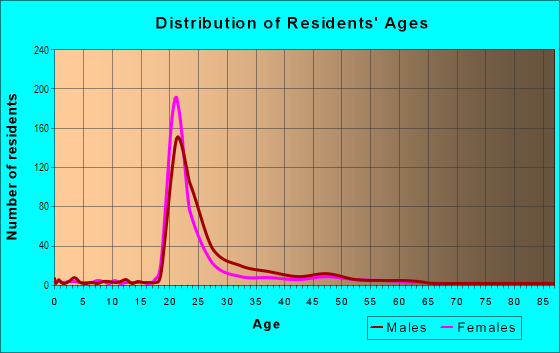
| Males: | 1,490 |
| Females: | 1,821 |
| Males: | 25.5 years |
| Females: | 25.1 years |
Average household size:
| Southeast Lexington: | 1.9 people |
| Kentucky: | 2.4 people |
Percentage of family households:
| Southeast Lexington: | 10.4% |
| Kentucky: | 45.9% |
| Here: | 13.9% |
| Kentucky: | 47.1% |
Percentage of married-couple families with children (among all households):
| Southeast Lexington: | 12.5% |
| Kentucky: | 58.4% |
Percentage of single-mother households (among all households):
| Southeast Lexington: | 11.1% |
| Kentucky: | 9.3% |
Percentage of never married males 15 years old and over:
Percentage of never married females 15 years old and over:
| Southeast Lexington: | 40.2% |
| Kentucky: | 16.3% |
Percentage of never married females 15 years old and over:
| Southeast Lexington: | 51.6% |
| Kentucky: | 13.5% |
Percentage of people that speak English not well or not at all:
| Southeast Lexington: | 1.2% |
| Kentucky: | 1.1% |
Percentage of people born in this state:
Percentage of people born in another U.S. state:
Percentage of native residents but born outside the U.S.:
Percentage of foreign born residents:
| Here: | 44.7% |
| Kentucky: | 67.2% |
Percentage of people born in another U.S. state:
| Southeast Lexington: | 45.5% |
| Kentucky: | 28.0% |
Percentage of native residents but born outside the U.S.:
| Here: | 2.2% |
| Kentucky: | 0.8% |
Percentage of foreign born residents:
| Here: | 7.6% |
| Kentucky: | 4.0% |
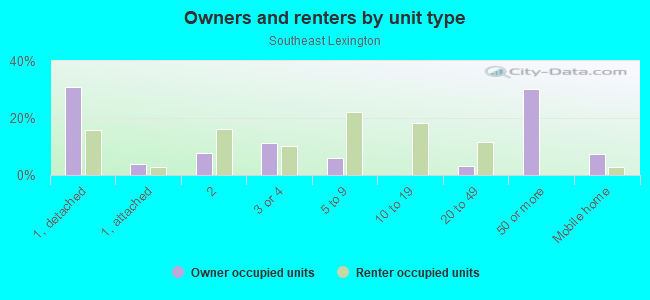
Owner-occupied
Renter-occupied

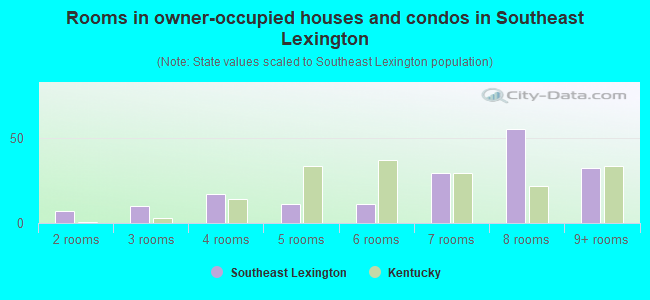
- Rooms in owner-occupied houses and condos in Southeast Lexington
- 01 room
- 72 rooms
- 103 rooms
- 174 rooms
- 115 rooms
- 116 rooms
- 297 rooms
- 558 rooms
- 329+ rooms
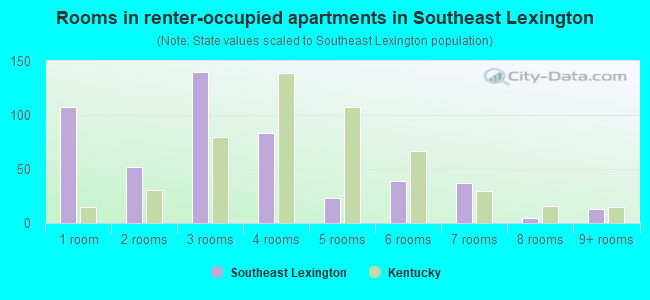
- Rooms in renter-occupied apartments in Southeast Lexington
- 1071 room
- 522 rooms
- 1403 rooms
- 834 rooms
- 235 rooms
- 396 rooms
- 377 rooms
- 58 rooms
- 139+ rooms
Owner-occupied
Renter-occupied
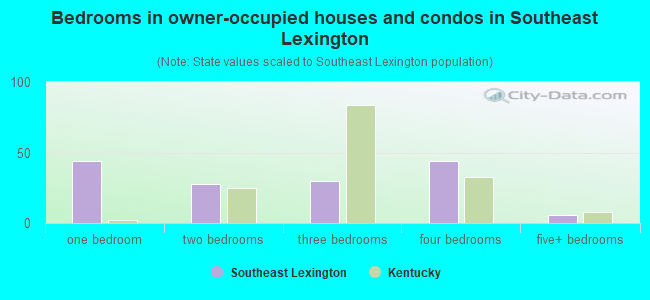
- Bedrooms in owner-occupied houses and condos in Southeast Lexington
- 0no bedroom
- 441 bedroom
- 282 bedrooms
- 303 bedrooms
- 444 bedrooms
- 65+ bedrooms
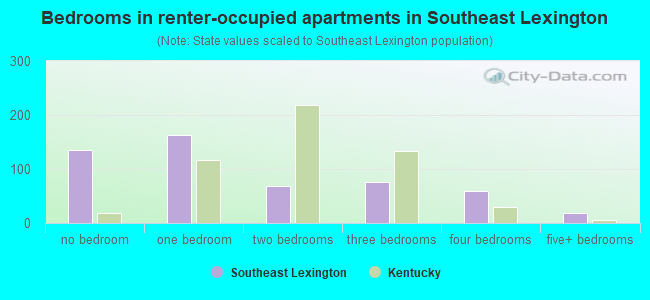
- Bedrooms in renter-occupied apartments in Southeast Lexington
- 136no bedroom
- 1631 bedroom
- 682 bedrooms
- 763 bedrooms
- 594 bedrooms
- 185+ bedrooms
Average number of cars or other vehicles available in houses/condos:
Average number of cars or other vehicles available in apartments:
| This neighborhood: | |
| Kentucky: |
Average number of cars or other vehicles available in apartments:
| Here: | 1.5 |
| Kentucky: | 1.3 |
Percentage of units with a mortgage:
| Southeast Lexington: | 51.6% |
| Kentucky: | 56.7% |
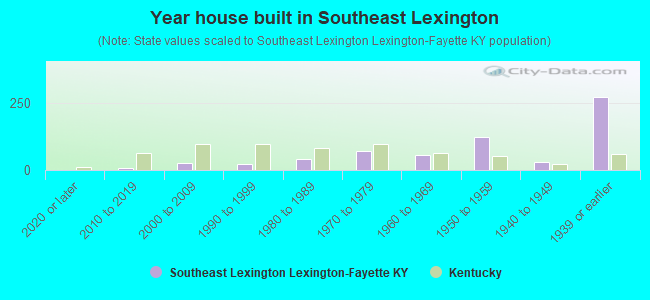
- Year house built in Southeast Lexington
- 02020 or later
- 92010 to 2019
- 262000 to 2009
- 231990 to 1999
- 431980 to 1989
- 701970 to 1979
- 571960 to 1969
- 1221950 to 1959
- 311940 to 1949
- 2721939 or earlier
Travel time to work (commute)
![Travel time to work (commute)]()
- 83Less than 5 minutes
- 2275 to 9 minutes
- 30010 to 14 minutes
- 27215 to 19 minutes
- 12720 to 24 minutes
- 2625 to 29 minutes
- 6530 to 34 minutes
- 2135 to 39 minutes
- 840 to 44 minutes
- 1745 to 59 minutes
- 1460 to 89 minutes
- 2490 or more minutes

Means of transportation to work
![Means of transportation to work]()
- 43.7%626Drove a car alone
- 4.0%58Carpooled
- 6.1%88Bus
- 4.6%66Bicycle
- 33.0%472Walked
- 0.8%11Other means
- 9.9%142Worked at home

Time leaving home to go to work
![Time leaving home to go to work]()
- 2712:00 a.m. to 4:59 a.m.
- 55:00 a.m. to 5:29 a.m.
- 95:30 a.m. to 5:59 a.m.
- 196:00 a.m. to 6:29 a.m.
- 636:30 a.m. to 6:59 a.m.
- 297:00 a.m. to 7:29 a.m.
- 537:30 a.m. to 7:59 a.m.
- 808:00 a.m. to 8:29 a.m.
- 1158:30 a.m. to 8:59 a.m.
- 1459:00 a.m. to 9:59 a.m.
- 11610:00 a.m. to 10:59 a.m.
- 8411:00 a.m. to 11:59 a.m.
- 24112:00 p.m. to 3:59 p.m.
- 1674:00 p.m. to 11:59 p.m.

Occupations of males:
- Percentage of males in management occupations (except farmers):
Here: 11.2% Kentucky: 10.7%
- Percentage of males in business and financial operations occupations:
Here: 2.5% Kentucky: 4.0%
- Percentage of males in computer and mathematical occupations:
Here: 6.0% Kentucky: 3.0%
- Percentage of males in life, physical, and social science occupations:
Here: 1.1% Kentucky: 0.8%
- Percentage of males in legal occupations:
Here: 1.9% Kentucky: 0.8%
- Percentage of males in education, training, and library occupations:
Here: 14.4% Kentucky: 2.9%
- Percentage of males in arts, design, entertainment, sports, and media occupations:
Here: 5.3% Kentucky: 1.3%
- Percentage of males in healthcare practitioners and technical occupations:
Here: 5.9% Kentucky: 3.1%
- Percentage of males in service occupations:
Here: 21.6% Kentucky: 12.5%
- Percentage of males in sales and office occupations:
Here: 16.9% Kentucky: 14.0%
- Percentage of males in construction, extraction, and maintenance occupations:
Here: 3.0% Kentucky: 8.7%
- Percentage of males in production occupations:
Here: 1.5% Kentucky: 12.3%
- Percentage of males in transportation occupations:
Here: 1.2% Kentucky: 6.7%
- Percentage of males in material moving occupations:
Here: 5.0% Kentucky: 7.7%
Occupations of females:
- Percentage of females in management occupations (except farmers):
Here: 1.5% Kentucky: 8.4%
- Percentage of females in business and financial operations occupations:
Here: 3.0% Kentucky: 5.3%
- Percentage of females in life, physical, and social science occupations:
Here: 1.3% Kentucky: 0.8%
- Percentage of females in community and social services occupations:
Here: 2.6% Kentucky: 2.8%
- Percentage of females in education, training, and library occupations:
Here: 24.8% Kentucky: 9.3%
- Percentage of females in arts, design, entertainment, sports, and media occupations:
Here: 2.7% Kentucky: 1.5%
- Percentage of females in healthcare practitioners and technical occupations:
Here: 2.5% Kentucky: 11.8%
- Percentage of females in service occupations:
Here: 32.3% Kentucky: 19.1%
- Percentage of females in sales and office occupations:
Here: 25.3% Kentucky: 27.8%
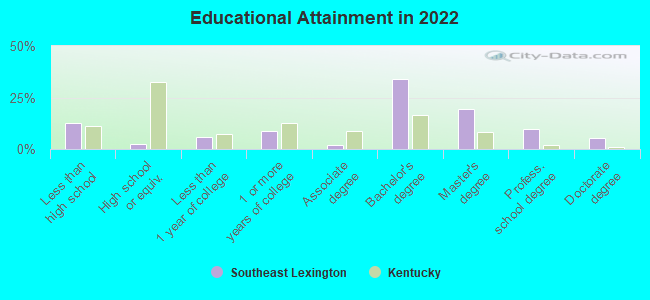
Education in this neighborhood (subdivision or community):
- Percentage of people 3 years and older in K-12 schools:
Southeast Lexington: 2.3% Kentucky: 16.5%
- Percentage of people 3 years and older in undergraduate colleges:
Southeast Lexington: 79.1% Kentucky: 4.1%
- Percentage of people 3 years and older in grad. or professional schools:
Southeast Lexington: 7.3% Kentucky: 1.3%
- Percentage of students K-12 enrolled in private schools:
Southeast Lexington: 52.6% Kentucky: 16.3%
Percentage of population below poverty level:
| Southeast Lexington: | 42.1% |
| Kentucky: | 16.5% |
Median year renter moved in (as recorded in 2022):
| Southeast Lexington: | 2019 |
| Kentucky: | 2020 |
Percentage of married-couple families with both working:
| Southeast Lexington: | 197.3% |
| Kentucky: | 70.7% |
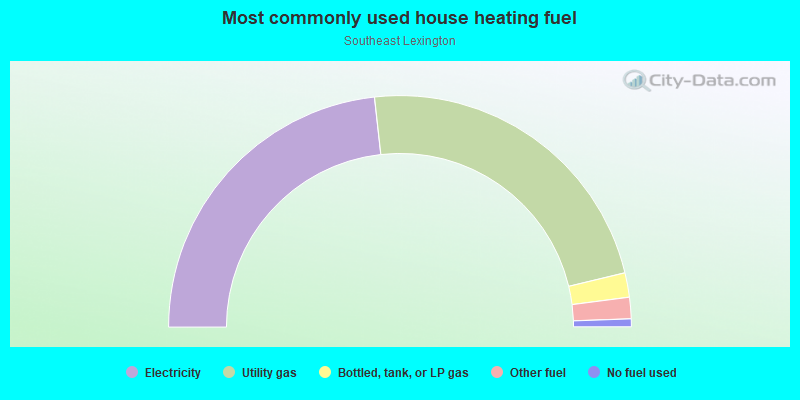
- 46.5%Electricity
- 46.0%Utility gas
- 3.4%Bottled, tank, or LP gas
- 3.0%Other fuel
- 1.1%No fuel used
Highways in this neighborhood:
State Hwy 1974 (E High St)
Length: 0.51 miles
Directions: N-S, SE-NW
Address range: 231 to 523
Directions: N-S, SE-NW
Address range: 231 to 523
Roads and streets:
Transylvania Park
Length: 0.65 miles
Direction: SW-NE
Address range: 300 to 499
Direction: SW-NE
Address range: 300 to 499
E Maxwell St
Length: 0.43 miles
Direction: SE-NW
Address range: 200 to 451
Direction: SE-NW
Address range: 200 to 451
Aylesford Pl
Length: 0.23 miles
Direction: SW-NE
Address range: 300 to 399
Direction: SW-NE
Address range: 300 to 399
Linden Walk
Length: 0.22 miles
Direction: SW-NE
Address range: 300 to 399
Direction: SW-NE
Address range: 300 to 399
Rose St
Length: 0.21 miles
Direction: SW-NE
Address range: 200 to 299
Direction: SW-NE
Address range: 200 to 299
Stone Ave
Length: 0.21 miles
Direction: SW-NE
Address range: 200 to 299
Direction: SW-NE
Address range: 200 to 299
E Euclid Ave
Length: 0.17 miles
Direction: SE-NW
Address range: 400 to 454
Direction: SE-NW
Address range: 400 to 454
Arlington Ave
Length: 0.16 miles
Direction: SW-NE
Address range: 200 to 299
Direction: SW-NE
Address range: 200 to 299
Latrobe Ct
Length: 0.16 miles
Directions: E-W, N-S, SE-NW, SW-NE
Directions: E-W, N-S, SE-NW, SW-NE
Grosvenor Ave
Length: 0.11 miles
Direction: SE-NW
Address range: 300 to 399
Direction: SE-NW
Address range: 300 to 399
Preston Ct
Length: 0.08 miles
Direction: E-W
Address range: 1 to 99
Direction: E-W
Address range: 1 to 99
Ransom Ave
Length: 0.08 miles
Direction: SW-NE
Address range: 160 to 199
Direction: SW-NE
Address range: 160 to 199
Kalmia Ave
Length: 0.08 miles
Direction: SE-NW
Address range: 200 to 299
Direction: SE-NW
Address range: 200 to 299
Lyndhurst Pl
Length: 0.08 miles
Direction: SE-NW
Address range: 200 to 299
Direction: SE-NW
Address range: 200 to 299
Rose Ln
Length: 0.02 miles
Direction: SE-NW
Address range: 443 to 458
Direction: SE-NW
Address range: 443 to 458