Southland Park neighborhood in Lexington, Kentucky (KY), 40503, 40504 detailed profile
Settings
X


Area: 0.404 square miles
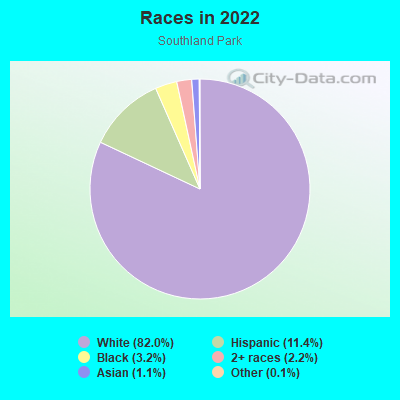
Population: 740
Population density: 1,830 people per square mile

- 60782.0%White
- 8411.4%Hispanic or Latino
- 243.2%Black
- 162.2%Two or more races
- 81.1%Asian
- 10.1%Some other race
Median household income in 2022:
| Southland Park: | $69,340 |
| Kentucky: | $59,341 |
Distribution of median household income
![Distribution of median household income]()
- 42Less than $10,000
- 35$10,000 to $19,999
- 44$20,000 to $29,999
- 24$30,000 to $39,999
- 40$40,000 to $49,999
- 20$50,000 to $59,999
- 26$60,000 to $74,999
- 33$75,000 to $99,999
- 58$100,000 to $124,999
- 41$125,000 to $149,999
- 17$150,000 to $199,999
- 32$200,000 or more

Distribution of owner-occupied house/condo value
![Distribution of owner-occupied house/condo value]()
- 68Less than $50,000
- 73$50,000 to $99,999
- 57$100,000 to $149,999
- 79$150,000 to $199,999
- 76$200,000 to $249,999
- 62$250,000 to $299,999
- 78$300,000 to $399,999
- 3$400,000 to $499,999
- 30$500,000 to $749,999
- 7$750,000 to $999,999
- 4$1,000,000 or more

Distribution of rent paid by renters
![Distribution of rent paid by renters]()
- 26$200 to $299
- 19$400 to $499
- 113$500 to $599
- 38$600 to $699
- 23$700 to $799
- 106$800 to $899
- 35$900 to $999
- 1$1,000 to $1,249
- 5$1,250 to $1,499
- 33$1,500 to $1,999
- 5$2,000 or more

Median rent in 2022:
| Southland Park: | $680 |
| Kentucky: | $702 |
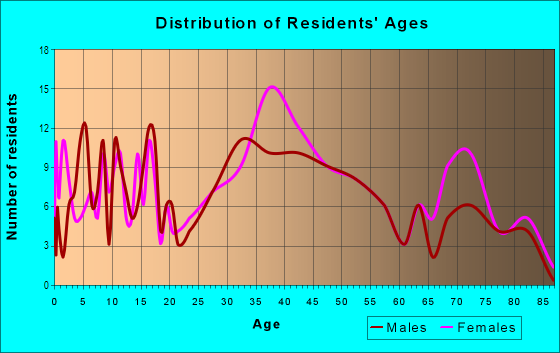
| Males: | 336 |
| Females: | 403 |
| Males: | 38.4 years |
| Females: | 44.2 years |
Average household size:
| Southland Park: | 15.4 people |
| Kentucky: | 2.4 people |
Percentage of family households:
| Southland Park: | 29.4% |
| Kentucky: | 45.9% |
| Here: | 41.6% |
| Kentucky: | 47.1% |
Percentage of married-couple families with children (among all households):
| Southland Park: | 24.0% |
| Kentucky: | 58.4% |
Percentage of single-mother households (among all households):
| Southland Park: | 21.6% |
| Kentucky: | 9.3% |
Percentage of never married males 15 years old and over:
Percentage of never married females 15 years old and over:
| Southland Park: | 18.1% |
| Kentucky: | 16.3% |
Percentage of never married females 15 years old and over:
| Southland Park: | 11.9% |
| Kentucky: | 13.5% |
Percentage of people that speak English not well or not at all:
| Southland Park: | 3.2% |
| Kentucky: | 1.1% |
Percentage of people born in this state:
Percentage of people born in another U.S. state:
Percentage of native residents but born outside the U.S.:
Percentage of foreign born residents:
| Here: | 59.7% |
| Kentucky: | 67.2% |
Percentage of people born in another U.S. state:
| Southland Park: | 31.3% |
| Kentucky: | 28.0% |
Percentage of native residents but born outside the U.S.:
| Here: | 0.4% |
| Kentucky: | 0.8% |
Percentage of foreign born residents:
| Here: | 8.6% |
| Kentucky: | 4.0% |
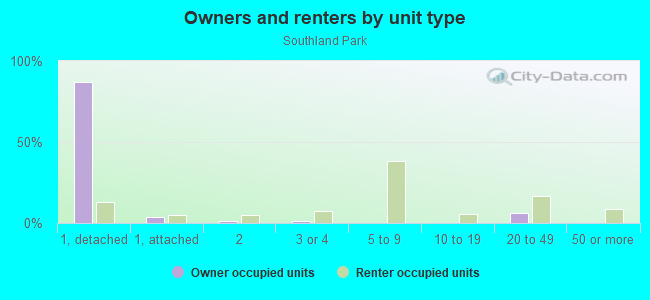
Owner-occupied
Renter-occupied

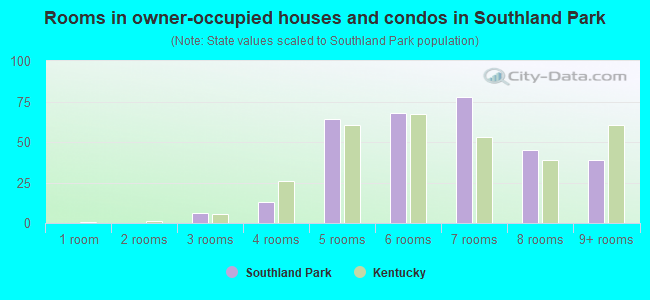
- Rooms in owner-occupied houses and condos in Southland Park
- 01 room
- 02 rooms
- 63 rooms
- 134 rooms
- 645 rooms
- 686 rooms
- 787 rooms
- 458 rooms
- 399+ rooms
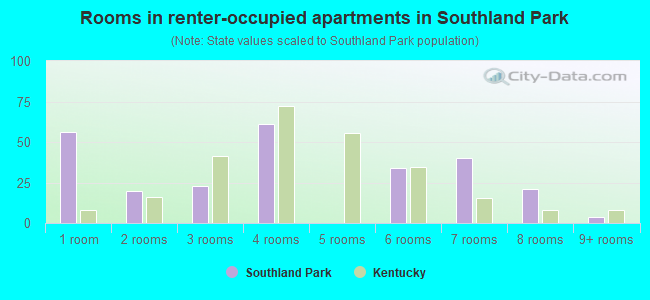
- Rooms in renter-occupied apartments in Southland Park
- 561 room
- 202 rooms
- 233 rooms
- 614 rooms
- 05 rooms
- 346 rooms
- 407 rooms
- 218 rooms
- 49+ rooms
Owner-occupied
Renter-occupied
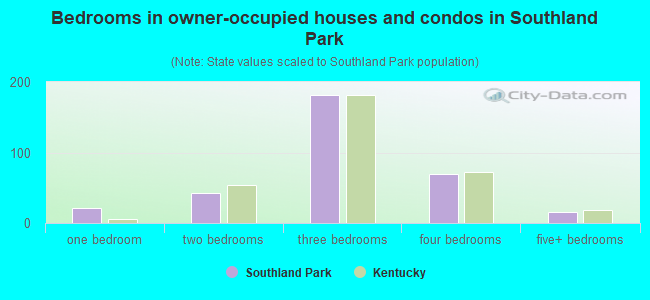
- Bedrooms in owner-occupied houses and condos in Southland Park
- 0no bedroom
- 211 bedroom
- 432 bedrooms
- 1823 bedrooms
- 694 bedrooms
- 165+ bedrooms
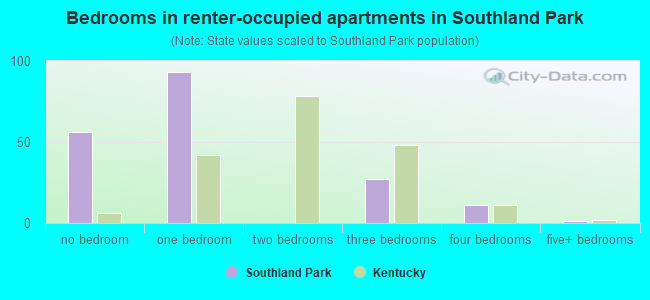
- Bedrooms in renter-occupied apartments in Southland Park
- 56no bedroom
- 931 bedroom
- 02 bedrooms
- 273 bedrooms
- 114 bedrooms
- 15+ bedrooms
Average number of cars or other vehicles available in houses/condos:
Average number of cars or other vehicles available in apartments:
| This neighborhood: | 2.0 |
| Kentucky: | 2.1 |
Average number of cars or other vehicles available in apartments:
| Here: | 0.6 |
| Kentucky: | 1.3 |
Percentage of units with a mortgage:
| Southland Park: | 69.4% |
| Kentucky: | 56.7% |
Average estimated value of detached houses in 2022 (98.6% of all units):
| Southland Park: | $168,746 |
| Kentucky: | $256,452 |
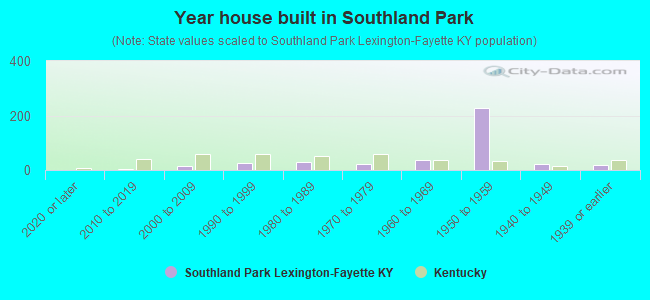
- Year house built in Southland Park
- 02020 or later
- 22010 to 2019
- 142000 to 2009
- 251990 to 1999
- 301980 to 1989
- 231970 to 1979
- 351960 to 1969
- 2291950 to 1959
- 211940 to 1949
- 171939 or earlier
Travel time to work (commute)
![Travel time to work (commute)]()
- 17Less than 5 minutes
- 575 to 9 minutes
- 7310 to 14 minutes
- 12115 to 19 minutes
- 7920 to 24 minutes
- 1225 to 29 minutes
- 3730 to 34 minutes
- 335 to 39 minutes
- 140 to 44 minutes
- 1145 to 59 minutes
- 760 to 89 minutes
- 290 or more minutes

Means of transportation to work
![Means of transportation to work]()
- 78.9%296Drove a car alone
- 5.6%21Carpooled
- 5.6%21Bus
- 18.9%71Motorcycle
- 1.1%4Bicycle
- 8.8%33Walked
- 4.0%15Other means
- 13.6%51Worked at home

Time leaving home to go to work
![Time leaving home to go to work]()
- 412:00 a.m. to 4:59 a.m.
- 45:00 a.m. to 5:29 a.m.
- 145:30 a.m. to 5:59 a.m.
- 386:00 a.m. to 6:29 a.m.
- 636:30 a.m. to 6:59 a.m.
- 657:00 a.m. to 7:29 a.m.
- 687:30 a.m. to 7:59 a.m.
- 648:00 a.m. to 8:29 a.m.
- 318:30 a.m. to 8:59 a.m.
- 359:00 a.m. to 9:59 a.m.
- 610:00 a.m. to 10:59 a.m.
- 1411:00 a.m. to 11:59 a.m.
- 912:00 p.m. to 3:59 p.m.
- 254:00 p.m. to 11:59 p.m.

Occupations of males:
- Percentage of males in management occupations (except farmers):
Here: 18.5% Kentucky: 10.7%
- Percentage of males in business and financial operations occupations:
Here: 10.2% Kentucky: 4.0%
- Percentage of males in computer and mathematical occupations:
Here: 7.0% Kentucky: 3.0%
- Percentage of males in architecture and engineering occupations:
Here: 1.8% Kentucky: 2.7%
- Percentage of males in education, training, and library occupations:
Here: 7.6% Kentucky: 2.9%
- Percentage of males in healthcare practitioners and technical occupations:
Here: 3.1% Kentucky: 3.1%
- Percentage of males in service occupations:
Here: 17.8% Kentucky: 12.5%
- Percentage of males in sales and office occupations:
Here: 14.6% Kentucky: 14.0%
- Percentage of males in construction, extraction, and maintenance occupations:
Here: 8.4% Kentucky: 8.7%
- Percentage of males in transportation occupations:
Here: 5.9% Kentucky: 6.7%
- Percentage of males in material moving occupations:
Here: 2.2% Kentucky: 7.7%
Occupations of females:
- Percentage of females in management occupations (except farmers):
Here: 6.0% Kentucky: 8.4%
- Percentage of females in business and financial operations occupations:
Here: 8.0% Kentucky: 5.3%
- Percentage of females in computer and mathematical occupations:
Here: 1.3% Kentucky: 1.2%
- Percentage of females in architecture and engineering occupations:
Here: 2.1% Kentucky: 0.6%
- Percentage of females in life, physical, and social science occupations:
Here: 3.3% Kentucky: 0.8%
- Percentage of females in community and social services occupations:
Here: 3.6% Kentucky: 2.8%
- Percentage of females in legal occupations:
Here: 3.0% Kentucky: 1.1%
- Percentage of females in education, training, and library occupations:
Here: 16.6% Kentucky: 9.3%
- Percentage of females in arts, design, entertainment, sports, and media occupations:
Here: 4.8% Kentucky: 1.5%
- Percentage of females in healthcare practitioners and technical occupations:
Here: 9.2% Kentucky: 11.8%
- Percentage of females in service occupations:
Here: 5.8% Kentucky: 19.1%
- Percentage of females in sales and office occupations:
Here: 34.8% Kentucky: 27.8%
- Percentage of females in production occupations:
Here: 2.7% Kentucky: 5.2%
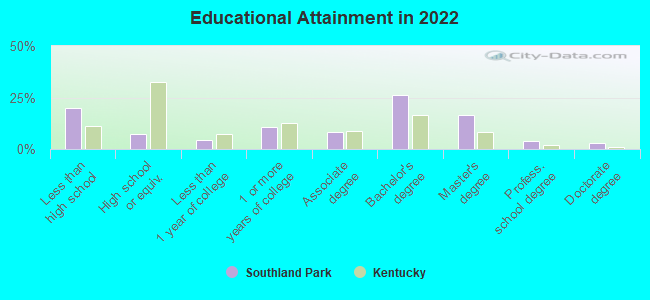
Education in this neighborhood (subdivision or community):
- Percentage of people 3 years and older in K-12 schools:
Southland Park: 15.4% Kentucky: 16.5%
- Percentage of people 3 years and older in undergraduate colleges:
Southland Park: 6.1% Kentucky: 4.1%
- Percentage of people 3 years and older in grad. or professional schools:
Southland Park: 2.0% Kentucky: 1.3%
- Percentage of students K-12 enrolled in private schools:
Southland Park: 56.9% Kentucky: 16.3%
Percentage of population below poverty level:
| Southland Park: | 6.4% |
| Kentucky: | 16.5% |
Median year owner moved in (as recorded in 2022):
Median year renter moved in (as recorded in 2022):
| Southland Park: | 2005 |
| Kentucky: | 2010 |
Median year renter moved in (as recorded in 2022):
| Southland Park: | 2015 |
| Kentucky: | 2020 |
Percentage of married-couple families with both working:
| Southland Park: | 99.7% |
| Kentucky: | 70.7% |
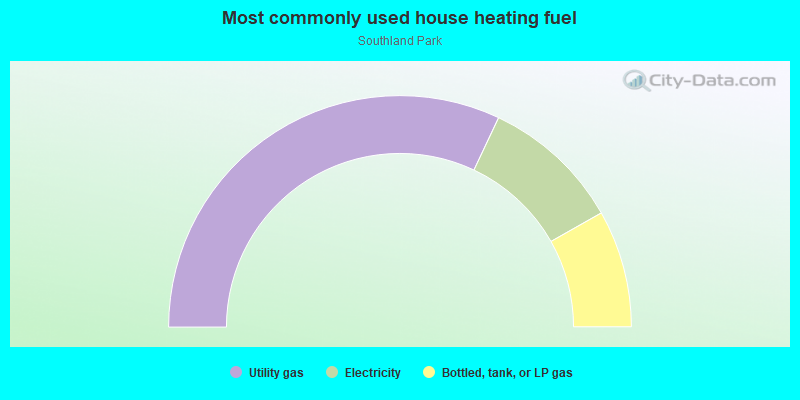
- 64.1%Utility gas
- 19.6%Electricity
- 16.4%Bottled, tank, or LP gas
Roads and streets:
Clays Mill Rd
Length: 0.91 miles
Direction: SW-NE
Address range: 2000 to 2799
Direction: SW-NE
Address range: 2000 to 2799
Hill N Dale Rd
Length: 0.61 miles
Directions: E-W, SE-NW
Address range: 600 to 699
Directions: E-W, SE-NW
Address range: 600 to 699
Sheridan Dr
Length: 0.55 miles
Directions: E-W, SW-NE
Address range: 600 to 799
Directions: E-W, SW-NE
Address range: 600 to 799
Cardinal Ln
Length: 0.49 miles
Directions: E-W, SE-NW
Address range: 600 to 663
Directions: E-W, SE-NW
Address range: 600 to 663
Wichita Dr
Length: 0.38 miles
Directions: E-W, N-S, SE-NW
Address range: 600 to 699
Directions: E-W, N-S, SE-NW
Address range: 600 to 699
Tulsa Rd
Length: 0.32 miles
Directions: E-W, N-S, SW-NE
Address range: 2300 to 2499
Directions: E-W, N-S, SW-NE
Address range: 2300 to 2499
Tucson Dr
Length: 0.31 miles
Directions: E-W, N-S, SE-NW, SW-NE
Address range: 600 to 2399
Directions: E-W, N-S, SE-NW, SW-NE
Address range: 600 to 2399
Laramie Dr
Length: 0.28 miles
Directions: E-W, SW-NE
Address range: 600 to 699
Directions: E-W, SW-NE
Address range: 600 to 699
Stratford Dr
Length: 0.25 miles
Direction: E-W
Address range: 600 to 699
Direction: E-W
Address range: 600 to 699
Burbank Ct
Length: 0.22 miles
Directions: E-W, SE-NW
Address range: 600 to 699
Directions: E-W, SE-NW
Address range: 600 to 699
Yuma Ct
Length: 0.11 miles
Direction: SW-NE
Address range: 2400 to 2499
Direction: SW-NE
Address range: 2400 to 2499
Topeka Rd
Length: 0.10 miles
Direction: SW-NE
Address range: 2400 to 2449
Direction: SW-NE
Address range: 2400 to 2449
Springhurst Dr
Length: 0.10 miles
Directions: E-W, SE-NW
Directions: E-W, SE-NW
Lane Allen Rd
Length: 0.08 miles
Direction: SE-NW
Address range: 600 to 607
Direction: SE-NW
Address range: 600 to 607
Spring Grove Ave
Length: 0.06 miles
Directions: N-S, SW-NE
Address range: 2085 to 2105
Directions: N-S, SW-NE
Address range: 2085 to 2105