Southside neighborhood in Ithaca, New York (NY), 14850 detailed profile
Settings
X


Business Search - 14 Million verified businesses
Area: 0.115 square miles
Population: 1,292
Population density:
| Southside: | 11,246 people per square mile |
| Ithaca: | 5,740 people per square mile |

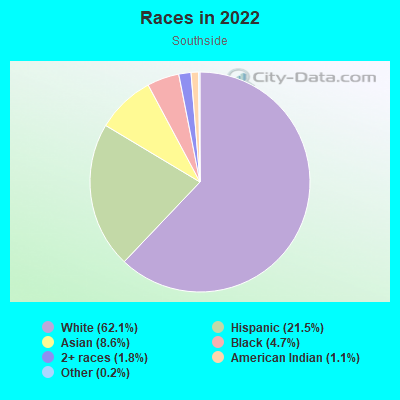
- 81362.1%White
- 28221.5%Hispanic or Latino
- 1138.6%Asian
- 624.7%Black
- 241.8%Two or more races
- 141.1%American Indian
- 20.2%Some other race
Median household income in 2022:
| Southside: | $59,797 |
| Ithaca: | $45,468 |
Distribution of median household income
![Distribution of median household income]()
- 31Less than $10,000
- 76$10,000 to $19,999
- 36$20,000 to $29,999
- 35$30,000 to $39,999
- 63$40,000 to $49,999
- 67$50,000 to $59,999
- 55$60,000 to $74,999
- 98$75,000 to $99,999
- 110$100,000 to $124,999
- 18$125,000 to $149,999
- 13$150,000 to $199,999
- 15$200,000 or more

Distribution of owner-occupied house/condo value
![Distribution of owner-occupied house/condo value]()
- 70Less than $50,000
- 18$50,000 to $99,999
- 18$100,000 to $149,999
- 24$150,000 to $199,999
- 18$200,000 to $249,999
- 11$250,000 to $299,999
- 13$300,000 to $399,999
- 30$400,000 to $499,999
- 8$500,000 to $749,999
- 13$750,000 to $999,999
- 161$1,000,000 or more

Distribution of rent paid by renters
![Distribution of rent paid by renters]()
- 39$100 to $199
- 9$200 to $299
- 43$300 to $399
- 242$400 to $499
- 291$500 to $599
- 378$600 to $699
- 30$700 to $799
- 51$800 to $899
- 94$900 to $999
- 19$1,000 to $1,249
- 40$1,250 to $1,499
- 108$1,500 to $1,999
- 75$2,000 or more

Median rent in 2022:
| Southside: | $1,029 |
| Ithaca: | $1,274 |
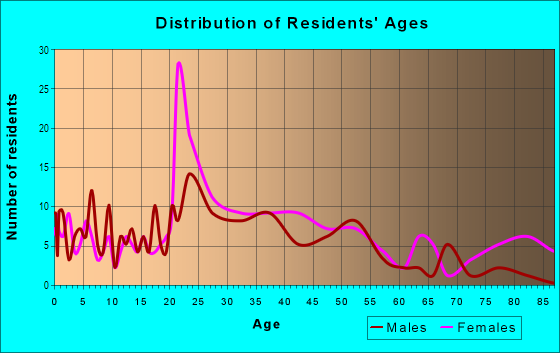
| Males: | 622 |
| Females: | 670 |
Males:
| This neighborhood: | 32.1 years |
| Whole city: | 22.9 years |
| This neighborhood: | 31.6 years |
| Whole city: | 22.7 years |
Average household size:
| Southside: | 1.9 people |
| Ithaca: | 1.8 people |
Percentage of family households:
| Southside: | 38.9% |
| Ithaca: | 21.1% |
| Here: | 35.9% |
| Ithaca: | 21.1% |
Percentage of married-couple families with children (among all households):
| Southside: | 9.2% |
| Ithaca: | 26.0% |
Percentage of single-mother households (among all households):
| Southside: | 31.5% |
| Ithaca: | 12.6% |
Percentage of never married males 15 years old and over:
Percentage of never married females 15 years old and over:
| Southside: | 30.7% |
| Ithaca: | 37.7% |
Percentage of never married females 15 years old and over:
| Southside: | 14.6% |
| city: | 34.4% |
Percentage of people that speak English not well or not at all:
| Southside: | 2.3% |
| Ithaca: | 1.0% |
Percentage of people born in this state:
Percentage of people born in another U.S. state:
Percentage of native residents but born outside the U.S.:
Percentage of foreign born residents:
| Here: | 56.3% |
| Ithaca: | 40.5% |
Percentage of people born in another U.S. state:
| Southside: | 26.3% |
| Ithaca: | 37.5% |
Percentage of native residents but born outside the U.S.:
| Here: | 1.4% |
| city: | 2.4% |
Percentage of foreign born residents:
| Here: | 16.0% |
| Ithaca: | 19.7% |
Owner-occupied
Renter-occupied

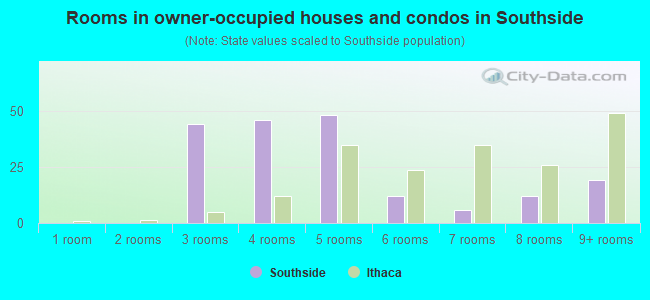
- Rooms in owner-occupied houses and condos in Southside
- 01 room
- 02 rooms
- 443 rooms
- 464 rooms
- 485 rooms
- 126 rooms
- 67 rooms
- 128 rooms
- 199+ rooms
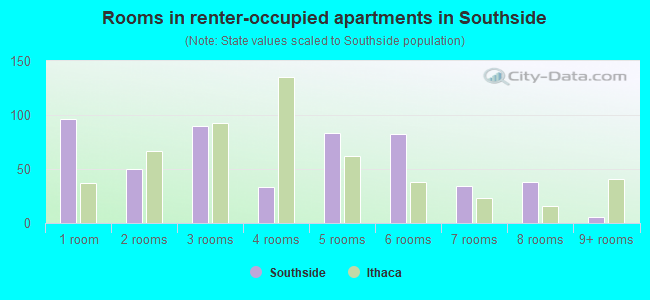
- Rooms in renter-occupied apartments in Southside
- 961 room
- 502 rooms
- 903 rooms
- 334 rooms
- 835 rooms
- 826 rooms
- 347 rooms
- 388 rooms
- 69+ rooms
Owner-occupied
Renter-occupied
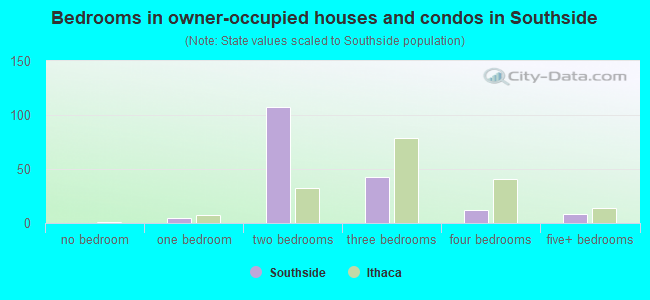
- Bedrooms in owner-occupied houses and condos in Southside
- 0no bedroom
- 51 bedroom
- 1072 bedrooms
- 433 bedrooms
- 124 bedrooms
- 85+ bedrooms
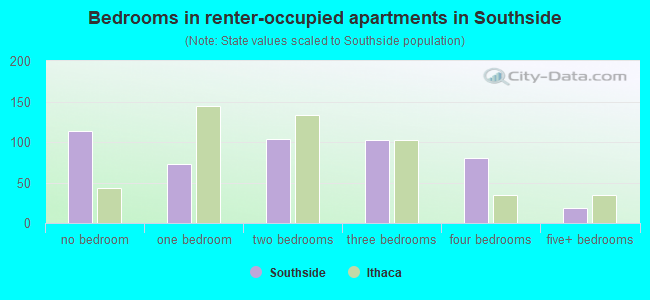
- Bedrooms in renter-occupied apartments in Southside
- 113no bedroom
- 731 bedroom
- 1042 bedrooms
- 1033 bedrooms
- 804 bedrooms
- 185+ bedrooms
Average number of cars or other vehicles available in houses/condos:
Average number of cars or other vehicles available in apartments:
| This neighborhood: | 1.6 |
| Ithaca: | 1.6 |
Average number of cars or other vehicles available in apartments:
| Here: | 1.3 |
| city: | 1.0 |
Percentage of units with a mortgage:
| Southside: | 24.6% |
| Ithaca: | 57.6% |
Housing prices:
- Average estimated value of detached houses in 2022 (33.3% of all units):
Southside: $14,531,780 Ithaca: $346,289
- Average estimated value of housing units in 2-unit structures in 2022 (8.2% of all units):
This neighborhood: $280,043 Ithaca: $300,793
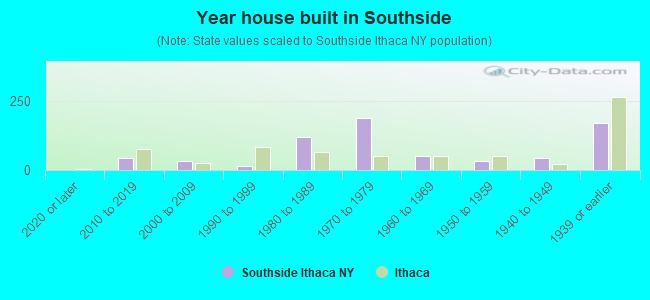
- Year house built in Southside
- 02020 or later
- 422010 to 2019
- 322000 to 2009
- 161990 to 1999
- 1191980 to 1989
- 1891970 to 1979
- 511960 to 1969
- 341950 to 1959
- 431940 to 1949
- 1701939 or earlier
City-data.com crime index for city in 2020 (higher means more crime):
| City: | 265.9 |
| U.S. average: | 219.5 |
Travel time to work (commute)
![Travel time to work (commute)]()
- 11Less than 5 minutes
- 1315 to 9 minutes
- 15510 to 14 minutes
- 13315 to 19 minutes
- 8620 to 24 minutes
- 6025 to 29 minutes
- 11530 to 34 minutes
- 1135 to 39 minutes
- 840 to 44 minutes
- 1445 to 59 minutes
- 760 to 89 minutes
- 2790 or more minutes

Means of transportation to work
![Means of transportation to work]()
- 49.4%357Drove a car alone
- 15.1%109Carpooled
- 16.8%121Bus
- 1.1%8Subway or elevated rail
- 13.7%99Long-distance train or commuter rail
- 1.1%8Light rail, streetcar or trolley
- 19.0%137Motorcycle
- 1.5%11Bicycle
- 0.3%2Walked
- 7.9%57Other means
- 10.4%75Worked at home

Time leaving home to go to work
![Time leaving home to go to work]()
- 412:00 a.m. to 4:59 a.m.
- 255:00 a.m. to 5:29 a.m.
- 356:00 a.m. to 6:29 a.m.
- 606:30 a.m. to 6:59 a.m.
- 397:00 a.m. to 7:29 a.m.
- 837:30 a.m. to 7:59 a.m.
- 928:00 a.m. to 8:29 a.m.
- 1178:30 a.m. to 8:59 a.m.
- 1719:00 a.m. to 9:59 a.m.
- 2510:00 a.m. to 10:59 a.m.
- 1211:00 a.m. to 11:59 a.m.
- 7112:00 p.m. to 3:59 p.m.
- 294:00 p.m. to 11:59 p.m.

Occupations of males:
- Percentage of males in life, physical, and social science occupations:
Here: 11.4% city: 6.1%
- Percentage of males in education, training, and library occupations:
Here: 18.1% city: 22.0%
- Percentage of males in service occupations:
Here: 7.4% city: 18.1%
- Percentage of males in sales and office occupations:
Here: 28.5% city: 13.8%
- Percentage of males in transportation occupations:
Here: 9.6% city: 1.3%
- Percentage of males in material moving occupations:
Here: 9.4% city: 1.6%
Occupations of females:
- Percentage of females in management occupations (except farmers):
Here: 9.8% city: 6.2%
- Percentage of females in business and financial operations occupations:
Here: 18.4% city: 4.5%
- Percentage of females in computer and mathematical occupations:
Here: 13.3% city: 5.0%
- Percentage of females in life, physical, and social science occupations:
Here: 12.6% city: 8.1%
- Percentage of females in education, training, and library occupations:
Here: 10.2% city: 22.2%
- Percentage of females in arts, design, entertainment, sports, and media occupations:
Here: 4.7% city: 4.7%
- Percentage of females in healthcare practitioners and technical occupations:
Here: 5.4% city: 3.5%
- Percentage of females in service occupations:
Here: 17.0% city: 19.5%
- Percentage of females in production occupations:
Here: 3.2% city: 1.3%
- Percentage of females in material moving occupations:
Here: 5.4% city: 1.0%
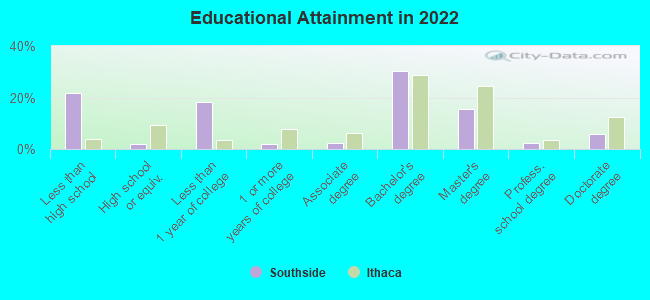
Education in this neighborhood (subdivision or community):
- Percentage of people 3 years and older in K-12 schools:
Southside: 22.9% Ithaca: 5.1%
- Percentage of people 3 years and older in undergraduate colleges:
Southside: 3.9% Ithaca: 42.7%
- Percentage of people 3 years and older in grad. or professional schools:
Southside: 9.3% Ithaca: 12.4%
- Percentage of students K-12 enrolled in private schools:
Southside: 10.8% Ithaca: 15.4%
Percentage of population below poverty level:
| Southside: | 17.1% |
| Ithaca: | 33.1% |
Median year renter moved in (as recorded in 2022):
| Southside: | 2017 |
| Ithaca: | 2019 |
Percentage of married-couple families with both working:
| Southside: | 42.8% |
| Ithaca: | 83.1% |
- 49.5%Utility gas
- 31.4%Electricity
- 10.3%Bottled, tank, or LP gas
- 2.1%No fuel used
- 1.9%Wood
- 1.8%Coal or coke
- 1.5%Other fuel
- 1.4%Fuel oil, kerosene, etc.
Highways in this neighborhood:
State Hwy 96B (W Clinton St)
Length: 0.44 miles
Direction: E-W
Address range: 300 to 699
Direction: E-W
Address range: 300 to 699
Roads and streets:
N Titus Ave
Length: 0.57 miles
Directions: E-W, N-S, SE-NW
Address range: 200 to 398
Directions: E-W, N-S, SE-NW
Address range: 200 to 398
Center St
Length: 0.36 miles
Direction: E-W
Address range: 200 to 498
Direction: E-W
Address range: 200 to 498
S Plain St
Length: 0.24 miles
Direction: N-S
Address range: 300 to 599
Direction: N-S
Address range: 300 to 599
S Albany St
Length: 0.17 miles
Direction: N-S
Address range: 300 to 499
Direction: N-S
Address range: 300 to 499
Cleveland Ave
Length: 0.15 miles
Direction: E-W
Address range: 100 to 199
Direction: E-W
Address range: 100 to 199
Fayette St
Length: 0.08 miles
Direction: N-S
Address range: 200 to 298
Direction: N-S
Address range: 200 to 298
S Corn St
Length: 0.06 miles
Direction: N-S
Address range: 300 to 399
Direction: N-S
Address range: 300 to 399
Other features:
Sixmile Crk
Length: 0.15 miles
Direction: E-W
Direction: E-W