Southwest neighborhood in Nashville, Tennessee (TN), 37209 detailed profile
Settings
X


Area: 0.122 square miles
Population: 753
Population density: 6,152 people per square mile

- 75172.6%Black
- 14213.7%White
- 626.0%Some other race
- 393.8%Two or more races
- 262.5%Hispanic or Latino
- 151.4%Asian

Distribution of median household income
![Distribution of median household income]()
- 51Less than $10,000
- 79$10,000 to $19,999
- 51$20,000 to $29,999
- 96$30,000 to $39,999
- 25$40,000 to $49,999
- 46$50,000 to $59,999
- 39$60,000 to $74,999
- 62$75,000 to $99,999
- 11$100,000 to $124,999
- 5$125,000 to $149,999
- 10$150,000 to $199,999
- 16$200,000 or more

Distribution of owner-occupied house/condo value
![Distribution of owner-occupied house/condo value]()
- 25Less than $50,000
- 4$50,000 to $99,999
- 25$150,000 to $199,999
- 6$200,000 to $249,999
- 14$250,000 to $299,999
- 72$300,000 to $399,999
- 21$400,000 to $499,999
- 28$500,000 to $749,999
- 46$750,000 to $999,999
- 19$1,000,000 or more

Distribution of rent paid by renters
![Distribution of rent paid by renters]()
- 12Less than $100
- 31$100 to $199
- 57$200 to $299
- 33$300 to $399
- 4$400 to $499
- 31$500 to $599
- 71$600 to $699
- 17$700 to $799
- 28$800 to $899
- 40$900 to $999
- 10$1,000 to $1,249
- 8$1,250 to $1,499
- 25$1,500 to $1,999
- 99$2,000 or more

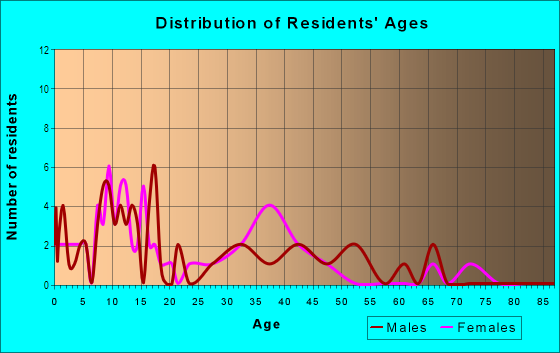
| Males: | 276 |
| Females: | 476 |
| Males: | 39.6 years |
| Females: | 33.8 years |
Average household size:
| Southwest: | 1.9 people |
| Tennessee: | 2.4 people |
Percentage of family households:
| Southwest: | 42.0% |
| Tennessee: | 46.2% |
| Here: | 15.8% |
| Tennessee: | 47.1% |
Percentage of married-couple families with children (among all households):
| Southwest: | 12.7% |
| Tennessee: | 59.8% |
Percentage of single-mother households (among all households):
| Southwest: | 45.4% |
| Tennessee: | 9.8% |
Percentage of never married males 15 years old and over:
Percentage of never married females 15 years old and over:
| Southwest: | 23.8% |
| Tennessee: | 16.3% |
Percentage of never married females 15 years old and over:
| Southwest: | 40.0% |
| Tennessee: | 14.6% |
Percentage of people that speak English not well or not at all:
| Southwest: | 0.3% |
| Tennessee: | 1.7% |
Percentage of people born in this state:
Percentage of people born in another U.S. state:
Percentage of native residents but born outside the U.S.:
Percentage of foreign born residents:
| Here: | 53.0% |
| Tennessee: | 57.3% |
Percentage of people born in another U.S. state:
| Southwest: | 41.2% |
| Tennessee: | 36.1% |
Percentage of native residents but born outside the U.S.:
| Here: | 0.5% |
| Tennessee: | 1.1% |
Percentage of foreign born residents:
| Here: | 5.3% |
| Tennessee: | 5.6% |

Owner-occupied
Renter-occupied


- Rooms in owner-occupied houses and condos in Southwest
- 01 room
- 02 rooms
- 123 rooms
- 134 rooms
- 305 rooms
- 106 rooms
- 267 rooms
- 168 rooms
- 269+ rooms

- Rooms in renter-occupied apartments in Southwest
- 151 room
- 222 rooms
- 243 rooms
- 1214 rooms
- 645 rooms
- 476 rooms
- 87 rooms
- 28 rooms
- 279+ rooms
Owner-occupied
Renter-occupied

- Bedrooms in owner-occupied houses and condos in Southwest
- 0no bedroom
- 01 bedroom
- 162 bedrooms
- 703 bedrooms
- 284 bedrooms
- 135+ bedrooms

- Bedrooms in renter-occupied apartments in Southwest
- 15no bedroom
- 901 bedroom
- 1572 bedrooms
- 773 bedrooms
- 24 bedrooms
- 275+ bedrooms
Average number of cars or other vehicles available in houses/condos:
Average number of cars or other vehicles available in apartments:
| This neighborhood: | |
| Tennessee: |
Average number of cars or other vehicles available in apartments:
| Here: | 0.9 |
| Tennessee: | 1.5 |
Percentage of units with a mortgage:
| Southwest: | 63.0% |
| Tennessee: | 57.5% |
Average estimated value of detached houses in 2022 (65.6% of all units):
| Southwest: | $354,887 |
| Tennessee: | $374,382 |

- Year house built in Southwest
- 62020 or later
- 322010 to 2019
- 702000 to 2009
- 31990 to 1999
- 131980 to 1989
- 241970 to 1979
- 971960 to 1969
- 541950 to 1959
- 171940 to 1949
- 731939 or earlier

Travel time to work (commute)
![Travel time to work (commute)]()
- 6Less than 5 minutes
- 225 to 9 minutes
- 5210 to 14 minutes
- 6015 to 19 minutes
- 3420 to 24 minutes
- 1725 to 29 minutes
- 2330 to 34 minutes
- 235 to 39 minutes
- 1240 to 44 minutes
- 4345 to 59 minutes
- 360 to 89 minutes
- 690 or more minutes

Means of transportation to work
![Means of transportation to work]()
- 55.2%190Drove a car alone
- 10.7%37Carpooled
- 20.6%71Bus
- 0.3%1Taxi
- 8.7%30Bicycle
- 9.0%31Walked
- 8.4%29Other means
- 9.9%34Worked at home

Time leaving home to go to work
![Time leaving home to go to work]()
- 612:00 a.m. to 4:59 a.m.
- 105:00 a.m. to 5:29 a.m.
- 115:30 a.m. to 5:59 a.m.
- 206:00 a.m. to 6:29 a.m.
- 176:30 a.m. to 6:59 a.m.
- 357:00 a.m. to 7:29 a.m.
- 227:30 a.m. to 7:59 a.m.
- 368:00 a.m. to 8:29 a.m.
- 208:30 a.m. to 8:59 a.m.
- 229:00 a.m. to 9:59 a.m.
- 1310:00 a.m. to 10:59 a.m.
- 111:00 a.m. to 11:59 a.m.
- 3812:00 p.m. to 3:59 p.m.
- 94:00 p.m. to 11:59 p.m.

Occupations of males:
- Percentage of males in management occupations (except farmers):
Here: 19.4% Tennessee: 11.5%
- Percentage of males in business and financial operations occupations:
Here: 8.0% Tennessee: 4.4%
- Percentage of males in computer and mathematical occupations:
Here: 4.2% Tennessee: 3.7%
- Percentage of males in community and social services occupations:
Here: 1.5% Tennessee: 1.2%
- Percentage of males in service occupations:
Here: 24.6% Tennessee: 13.2%
- Percentage of males in sales and office occupations:
Here: 14.0% Tennessee: 14.7%
- Percentage of males in construction, extraction, and maintenance occupations:
Here: 5.2% Tennessee: 9.1%
- Percentage of males in transportation occupations:
Here: 5.3% Tennessee: 6.5%
- Percentage of males in material moving occupations:
Here: 17.4% Tennessee: 6.9%
Occupations of females:
- Percentage of females in management occupations (except farmers):
Here: 7.1% Tennessee: 9.1%
- Percentage of females in business and financial operations occupations:
Here: 4.4% Tennessee: 5.8%
- Percentage of females in legal occupations:
Here: 3.2% Tennessee: 1.0%
- Percentage of females in education, training, and library occupations:
Here: 3.3% Tennessee: 9.1%
- Percentage of females in arts, design, entertainment, sports, and media occupations:
Here: 4.3% Tennessee: 1.8%
- Percentage of females in healthcare practitioners and technical occupations:
Here: 8.5% Tennessee: 11.0%
- Percentage of females in service occupations:
Here: 34.2% Tennessee: 18.7%
- Percentage of females in sales and office occupations:
Here: 26.1% Tennessee: 28.3%
- Percentage of females in production occupations:
Here: 1.1% Tennessee: 5.2%
- Percentage of females in transportation occupations:
Here: 5.7% Tennessee: 1.2%
Percentage of people 16-64 in Armed Forces:
| Southwest: | 0.0% |
| Tennessee: | 0.5% |
Education in this neighborhood (subdivision or community):
- Percentage of people 3 years and older in K-12 schools:
Southwest: 24.6% Tennessee: 16.5%
- Percentage of people 3 years and older in undergraduate colleges:
Southwest: 36.0% Tennessee: 4.3%
- Percentage of people 3 years and older in grad. or professional schools:
Southwest: 9.3% Tennessee: 1.3%
- Percentage of students K-12 enrolled in private schools:
Southwest: 18.6% Tennessee: 15.5%
Percentage of population below poverty level:
| Southwest: | 22.9% |
| Tennessee: | 13.3% |
Percentage of married-couple families with both working:
| Southwest: | 77.6% |
| Tennessee: | 70.6% |

- 72.8%Electricity
- 23.0%Utility gas
- 1.8%No fuel used
- 1.3%Fuel oil, kerosene, etc.
- 1.0%Bottled, tank, or LP gas
Limited-access highways (interstate or state) in this neighborhood:
I- 40
Length: 0.67 miles
Direction: E-W
Direction: E-W
Roads and streets:
Delaware Ave
Length: 0.40 miles
Directions: E-W, SW-NE
Address range: 3900 to 4399
Directions: E-W, SW-NE
Address range: 3900 to 4399
40th Ave N
Length: 0.27 miles
Direction: N-S
Address range: 519 to 799
Direction: N-S
Address range: 519 to 799
44th Ave N
Length: 0.27 miles
Direction: N-S
Address range: 600 to 924
Direction: N-S
Address range: 600 to 924
Indiana Ave
Length: 0.27 miles
Direction: E-W
Address range: 4000 to 4299
Direction: E-W
Address range: 4000 to 4299
42nd Ave N
Length: 0.19 miles
Direction: N-S
Address range: 600 to 799
Direction: N-S
Address range: 600 to 799
41st Ave N
Length: 0.19 miles
Direction: N-S
Address range: 600 to 745
Direction: N-S
Address range: 600 to 745
43rd Ave N
Length: 0.11 miles
Direction: N-S
Address range: 600 to 699
Direction: N-S
Address range: 600 to 699
Georgia Ave
Length: 0.08 miles
Direction: E-W
Address range: 4200 to 4399
Direction: E-W
Address range: 4200 to 4399
Clifton Ave
Length: 0.04 miles
Direction: E-W
Address range: 4000 to 4037
Direction: E-W
Address range: 4000 to 4037
39th Ave N
Length: 0.03 miles
Direction: N-S
Address range: 500 to 599
Direction: N-S
Address range: 500 to 599
Railroad features:
Louisville and Nashville RR
Length: 0.69 miles
Directions: N-S, SE-NW
Directions: N-S, SE-NW
Csx R R
Length: 0.26 miles
Directions: N-S, SE-NW, SW-NE
Directions: N-S, SE-NW, SW-NE