Spring-Brooks-Summit neighborhood in Ann Arbor, Michigan (MI), 48103 detailed profile
Settings
X


Business Search - 14 Million verified businesses
Area: 0.104 square miles
Population: 782
Population density:
| Spring-Brooks-Summit: | 7,511 people per square mile |
| Ann Arbor: | 4,438 people per square mile |

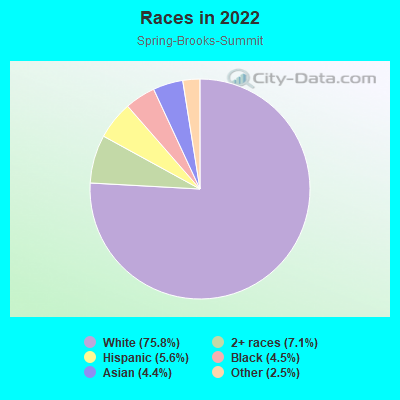
- 60575.8%White
- 577.1%Two or more races
- 455.6%Hispanic or Latino
- 364.5%Black
- 354.4%Asian
- 202.5%Some other race
Median household income in 2022:
| Spring-Brooks-Summit: | $110,555 |
| Ann Arbor: | $78,740 |
Distribution of median household income
![Distribution of median household income]()
- 9Less than $10,000
- 10$10,000 to $19,999
- 13$20,000 to $29,999
- 9$30,000 to $39,999
- 15$40,000 to $49,999
- 7$50,000 to $59,999
- 20$60,000 to $74,999
- 77$75,000 to $99,999
- 39$100,000 to $124,999
- 11$125,000 to $149,999
- 95$150,000 to $199,999
- 109$200,000 or more

Distribution of owner-occupied house/condo value
![Distribution of owner-occupied house/condo value]()
- 2$200,000 to $249,999
- 21$250,000 to $299,999
- 41$300,000 to $399,999
- 55$400,000 to $499,999
- 29$500,000 to $749,999
- 45$750,000 to $999,999
- 33$1,000,000 or more

Distribution of rent paid by renters
![Distribution of rent paid by renters]()
- 8$200 to $299
- 2$300 to $399
- 12$400 to $499
- 14$500 to $599
- 13$600 to $699
- 28$700 to $799
- 9$800 to $899
- 7$900 to $999
- 15$1,000 to $1,249
- 31$1,250 to $1,499
- 18$1,500 to $1,999
- 77$2,000 or more

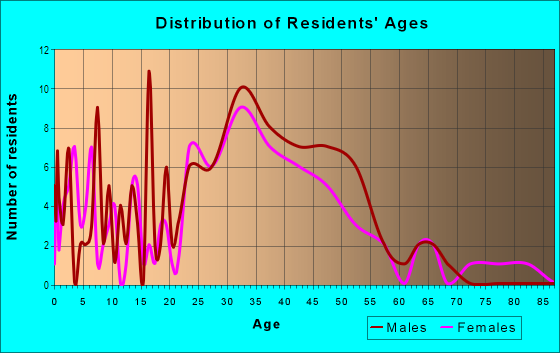
| Males: | 389 |
| Females: | 392 |
Males:
| This neighborhood: | 38.7 years |
| Whole city: | 25.8 years |
| This neighborhood: | 33.1 years |
| Whole city: | 26.4 years |
Average household size:
| Spring-Brooks-Summit: | 9.7 people |
| Ann Arbor: | 2.2 people |
Percentage of family households:
| Spring-Brooks-Summit: | 35.5% |
| Ann Arbor: | 30.6% |
| Here: | 43.8% |
| Ann Arbor: | 33.8% |
Percentage of married-couple families with children (among all households):
| Spring-Brooks-Summit: | 48.0% |
| Ann Arbor: | 33.4% |
Percentage of single-mother households (among all households):
| Spring-Brooks-Summit: | 1.1% |
| Ann Arbor: | 5.6% |
Percentage of never married males 15 years old and over:
Percentage of never married females 15 years old and over:
| Spring-Brooks-Summit: | 26.1% |
| Ann Arbor: | 30.5% |
Percentage of never married females 15 years old and over:
| Spring-Brooks-Summit: | 16.2% |
| city: | 27.5% |
Percentage of people that speak English not well or not at all:
| Spring-Brooks-Summit: | 0.0% |
| Ann Arbor: | 1.5% |
Percentage of people born in this state:
Percentage of people born in another U.S. state:
Percentage of native residents but born outside the U.S.:
Percentage of foreign born residents:
| Here: | 50.3% |
| Ann Arbor: | 45.8% |
Percentage of people born in another U.S. state:
| Spring-Brooks-Summit: | 46.5% |
| Ann Arbor: | 34.9% |
Percentage of native residents but born outside the U.S.:
| Here: | 0.6% |
| city: | 1.6% |
Percentage of foreign born residents:
| Here: | 2.6% |
| Ann Arbor: | 17.7% |
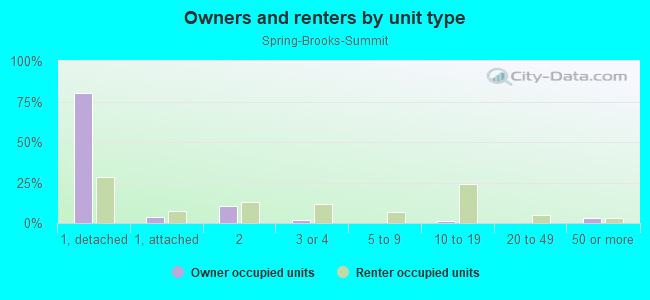
Owner-occupied
Renter-occupied

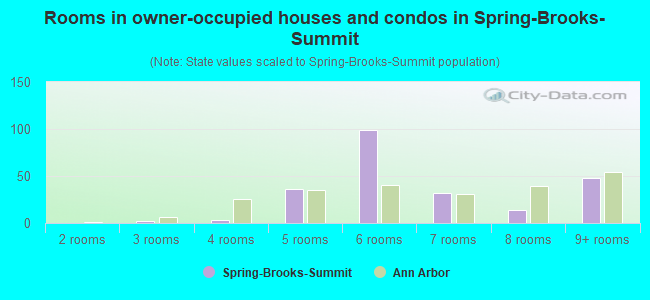
- Rooms in owner-occupied houses and condos in Spring-Brooks-Summit
- 01 room
- 02 rooms
- 23 rooms
- 34 rooms
- 365 rooms
- 996 rooms
- 327 rooms
- 148 rooms
- 489+ rooms
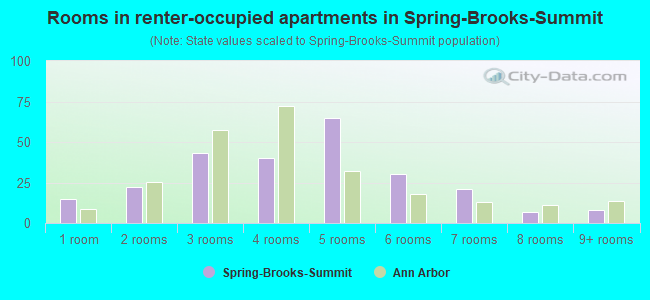
- Rooms in renter-occupied apartments in Spring-Brooks-Summit
- 151 room
- 222 rooms
- 433 rooms
- 404 rooms
- 655 rooms
- 306 rooms
- 217 rooms
- 78 rooms
- 89+ rooms
Owner-occupied
Renter-occupied
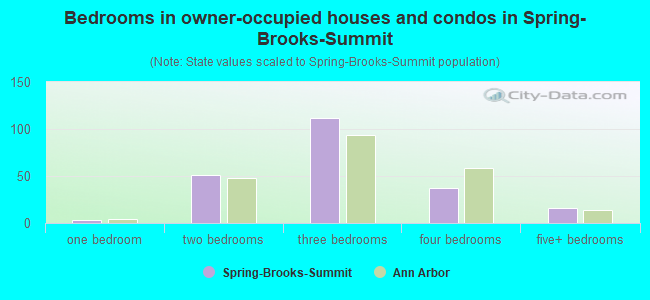
- Bedrooms in owner-occupied houses and condos in Spring-Brooks-Summit
- 0no bedroom
- 31 bedroom
- 512 bedrooms
- 1123 bedrooms
- 374 bedrooms
- 165+ bedrooms
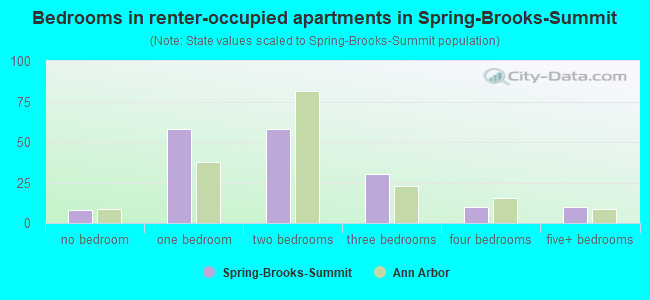
- Bedrooms in renter-occupied apartments in Spring-Brooks-Summit
- 8no bedroom
- 581 bedroom
- 582 bedrooms
- 303 bedrooms
- 104 bedrooms
- 105+ bedrooms
Average number of cars or other vehicles available in houses/condos:
Average number of cars or other vehicles available in apartments:
| This neighborhood: | 1.8 |
| Ann Arbor: | 1.7 |
Average number of cars or other vehicles available in apartments:
| Here: | 1.5 |
| city: | 1.3 |
Percentage of units with a mortgage:
| Spring-Brooks-Summit: | 59.2% |
| Ann Arbor: | 62.6% |
Average estimated value of detached houses in 2022 (55.5% of all units):
| Spring-Brooks-Summit: | $512,731 |
| Ann Arbor: | $540,877 |
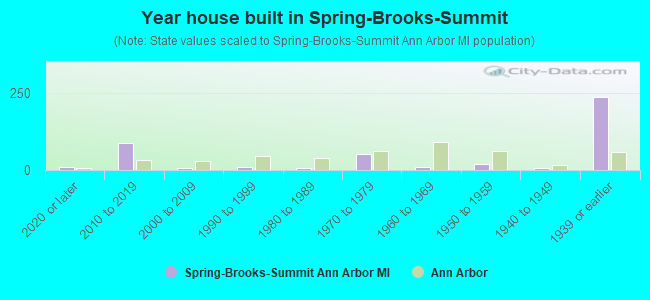
- Year house built in Spring-Brooks-Summit
- 92020 or later
- 892010 to 2019
- 82000 to 2009
- 91990 to 1999
- 81980 to 1989
- 511970 to 1979
- 91960 to 1969
- 181950 to 1959
- 81940 to 1949
- 2361939 or earlier
City-data.com crime index for city in 2020 (higher means more crime):
| City: | 137.0 |
| U.S. average: | 219.5 |
Travel time to work (commute)
![Travel time to work (commute)]()
- 8Less than 5 minutes
- 645 to 9 minutes
- 8610 to 14 minutes
- 8315 to 19 minutes
- 4420 to 24 minutes
- 3525 to 29 minutes
- 4730 to 34 minutes
- 235 to 39 minutes
- 340 to 44 minutes
- 1245 to 59 minutes
- 360 to 89 minutes

Means of transportation to work
![Means of transportation to work]()
- 46.5%227Drove a car alone
- 1.8%9Carpooled
- 11.5%56Bus
- 3.9%19Bicycle
- 15.4%75Walked
- 22.1%108Worked at home

Time leaving home to go to work
![Time leaving home to go to work]()
- 612:00 a.m. to 4:59 a.m.
- 15:00 a.m. to 5:29 a.m.
- 25:30 a.m. to 5:59 a.m.
- 176:00 a.m. to 6:29 a.m.
- 76:30 a.m. to 6:59 a.m.
- 307:00 a.m. to 7:29 a.m.
- 647:30 a.m. to 7:59 a.m.
- 868:00 a.m. to 8:29 a.m.
- 758:30 a.m. to 8:59 a.m.
- 489:00 a.m. to 9:59 a.m.
- 5610:00 a.m. to 10:59 a.m.
- 1211:00 a.m. to 11:59 a.m.
- 1612:00 p.m. to 3:59 p.m.
- 24:00 p.m. to 11:59 p.m.

Occupations of males:
- Percentage of males in management occupations (except farmers):
Here: 12.5% city: 10.3%
- Percentage of males in business and financial operations occupations:
Here: 2.8% city: 4.5%
- Percentage of males in computer and mathematical occupations:
Here: 3.4% city: 9.0%
- Percentage of males in life, physical, and social science occupations:
Here: 14.3% city: 5.8%
- Percentage of males in community and social services occupations:
Here: 1.1% city: 1.6%
- Percentage of males in legal occupations:
Here: 11.8% city: 2.2%
- Percentage of males in education, training, and library occupations:
Here: 24.0% city: 19.2%
- Percentage of males in arts, design, entertainment, sports, and media occupations:
Here: 8.2% city: 2.4%
- Percentage of males in healthcare practitioners and technical occupations:
Here: 2.8% city: 6.9%
- Percentage of males in sales and office occupations:
Here: 12.3% city: 10.4%
- Percentage of males in construction, extraction, and maintenance occupations:
Here: 2.5% city: 1.9%
- Percentage of males in production occupations:
Here: 4.8% city: 4.6%
Occupations of females:
- Percentage of females in management occupations (except farmers):
Here: 18.9% city: 8.5%
- Percentage of females in business and financial operations occupations:
Here: 7.2% city: 5.3%
- Percentage of females in architecture and engineering occupations:
Here: 2.7% city: 1.7%
- Percentage of females in life, physical, and social science occupations:
Here: 1.2% city: 4.8%
- Percentage of females in community and social services occupations:
Here: 1.2% city: 3.5%
- Percentage of females in education, training, and library occupations:
Here: 27.1% city: 20.2%
- Percentage of females in arts, design, entertainment, sports, and media occupations:
Here: 3.8% city: 4.6%
- Percentage of females in healthcare practitioners and technical occupations:
Here: 13.2% city: 11.9%
- Percentage of females in service occupations:
Here: 4.0% city: 15.5%
- Percentage of females in sales and office occupations:
Here: 15.9% city: 17.0%
- Percentage of females in material moving occupations:
Here: 6.1% city: 1.0%
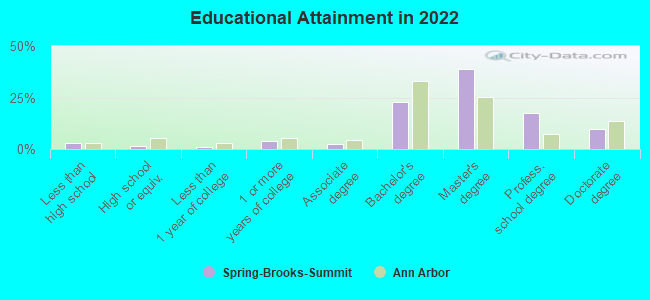
Education in this neighborhood (subdivision or community):
- Percentage of people 3 years and older in K-12 schools:
Spring-Brooks-Summit: 12.5% Ann Arbor: 8.7%
- Percentage of people 3 years and older in undergraduate colleges:
Spring-Brooks-Summit: 3.4% Ann Arbor: 25.6%
- Percentage of people 3 years and older in grad. or professional schools:
Spring-Brooks-Summit: 8.2% Ann Arbor: 10.8%
- Percentage of students K-12 enrolled in private schools:
Spring-Brooks-Summit: 20.4% Ann Arbor: 12.9%
Percentage of population below poverty level:
| Spring-Brooks-Summit: | 36.1% |
| Ann Arbor: | 23.1% |
Median year owner moved in (as recorded in 2022):
| Spring-Brooks-Summit: | 2009 |
| Ann Arbor: | 2010 |
Percentage of married-couple families with both working:
| Spring-Brooks-Summit: | 65.4% |
| Ann Arbor: | 72.2% |
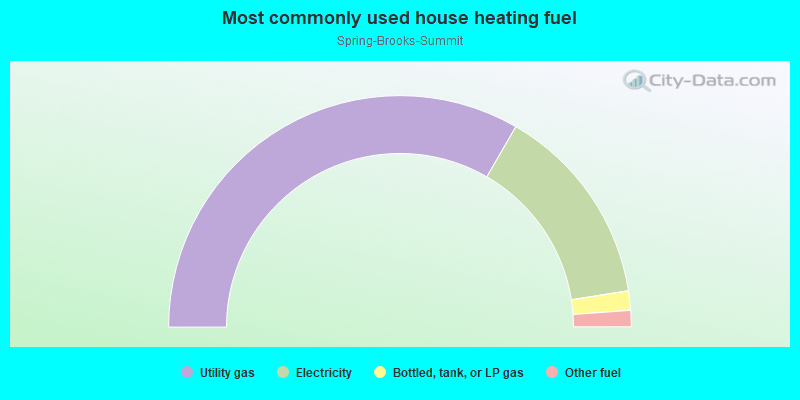
- 66.7%Utility gas
- 28.3%Electricity
- 2.7%Bottled, tank, or LP gas
- 2.3%Other fuel
Roads and streets:
Hiscock St
Length: 0.57 miles
Directions: E-W, N-S, SE-NW, SW-NE
Address range: 300 to 899
Directions: E-W, N-S, SE-NW, SW-NE
Address range: 300 to 899
Felch St
Length: 0.30 miles
Direction: E-W
Address range: 500 to 799
Direction: E-W
Address range: 500 to 799
Spring St
Length: 0.14 miles
Direction: N-S
Address range: 452 to 699
Direction: N-S
Address range: 452 to 699
Fountain St
Length: 0.14 miles
Direction: N-S
Address range: 500 to 699
Direction: N-S
Address range: 500 to 699
Brooks St
Length: 0.11 miles
Direction: N-S
Address range: 700 to 799
Direction: N-S
Address range: 700 to 799
Cherry St
Length: 0.11 miles
Direction: E-W
Address range: 500 to 599
Direction: E-W
Address range: 500 to 599
Miner St
Length: 0.08 miles
Direction: N-S
Address range: 600 to 699
Direction: N-S
Address range: 600 to 699
Gott St
Length: 0.07 miles
Direction: N-S
Address range: 600 to 699
Direction: N-S
Address range: 600 to 699