Spring Park neighborhood in Evansville, Indiana (IN), 47711 detailed profile
Settings
X


Business Search - 14 Million verified businesses
Area: 0.147 square miles
Population: 646
Population density:
| Spring Park: | 4,383 people per square mile |
| Evansville: | 2,912 people per square mile |

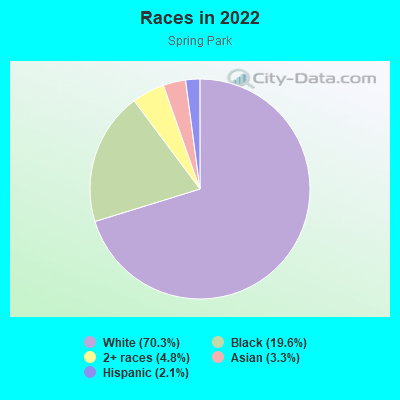
- 60570.3%White
- 16919.6%Black
- 414.8%Two or more races
- 283.3%Asian
- 182.1%Hispanic or Latino
Median household income in 2022:
| Spring Park: | $43,233 |
| Evansville: | $48,127 |
Distribution of median household income
![Distribution of median household income]()
- 8Less than $10,000
- 35$10,000 to $19,999
- 67$20,000 to $29,999
- 41$30,000 to $39,999
- 66$40,000 to $49,999
- 14$50,000 to $59,999
- 16$60,000 to $74,999
- 35$75,000 to $99,999
- 22$100,000 to $124,999
- 51$125,000 to $149,999
- 2$200,000 or more

Distribution of owner-occupied house/condo value
![Distribution of owner-occupied house/condo value]()
- 24Less than $50,000
- 145$50,000 to $99,999
- 74$100,000 to $149,999
- 10$150,000 to $199,999
- 2$250,000 to $299,999

Distribution of rent paid by renters
![Distribution of rent paid by renters]()
- 19$300 to $399
- 20$400 to $499
- 27$500 to $599
- 72$600 to $699
- 67$700 to $799
- 68$800 to $899
- 15$900 to $999
- 5$1,250 to $1,499

Median rent in 2022:
| Spring Park: | $622 |
| Evansville: | $691 |
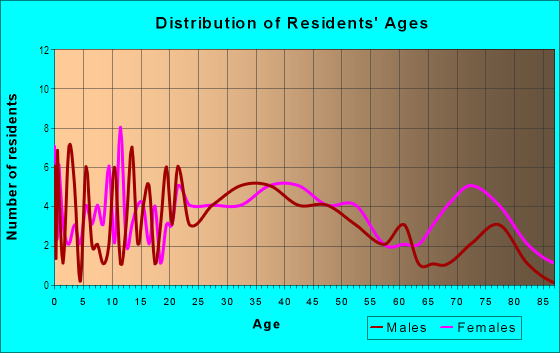
| Males: | 308 |
| Females: | 337 |
Males:
| This neighborhood: | 28.1 years |
| Whole city: | 36.6 years |
| This neighborhood: | 29.9 years |
| Whole city: | 38.9 years |
Average household size:
| Spring Park: | 2.3 people |
| Evansville: | 2.1 people |
Percentage of family households:
| Spring Park: | 48.8% |
| Evansville: | 38.3% |
| Here: | 45.8% |
| Evansville: | 33.7% |
Percentage of married-couple families with children (among all households):
| Spring Park: | 31.0% |
| Evansville: | 25.3% |
Percentage of single-mother households (among all households):
| Spring Park: | 13.0% |
| Evansville: | 15.6% |
Percentage of never married males 15 years old and over:
Percentage of never married females 15 years old and over:
| Spring Park: | 15.9% |
| Evansville: | 19.5% |
Percentage of never married females 15 years old and over:
| Spring Park: | 11.7% |
| city: | 17.0% |
Percentage of people that speak English not well or not at all:
| Spring Park: | 0.0% |
| Evansville: | 0.7% |
Percentage of people born in this state:
Percentage of people born in another U.S. state:
Percentage of native residents but born outside the U.S.:
Percentage of foreign born residents:
| Here: | 73.8% |
| Evansville: | 70.5% |
Percentage of people born in another U.S. state:
| Spring Park: | 22.6% |
| Evansville: | 25.5% |
Percentage of native residents but born outside the U.S.:
| Here: | 0.7% |
| city: | 0.8% |
Percentage of foreign born residents:
| Here: | 2.9% |
| Evansville: | 3.2% |

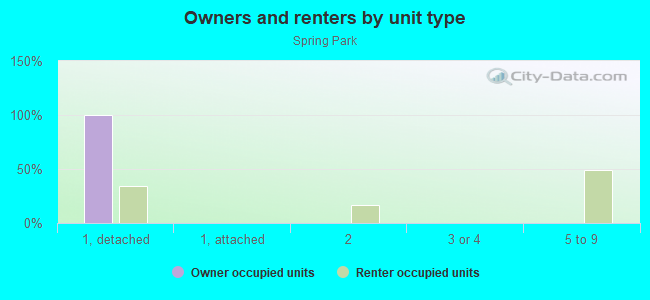
Owner-occupied
Renter-occupied

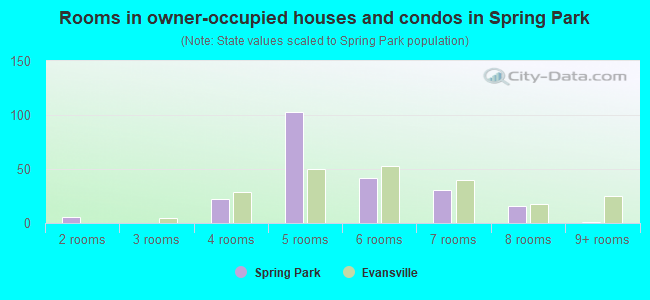
- Rooms in owner-occupied houses and condos in Spring Park
- 01 room
- 62 rooms
- 03 rooms
- 224 rooms
- 1035 rooms
- 426 rooms
- 317 rooms
- 168 rooms
- 19+ rooms
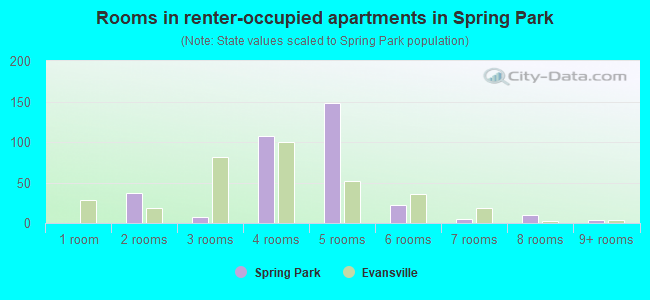
- Rooms in renter-occupied apartments in Spring Park
- 01 room
- 372 rooms
- 73 rooms
- 1074 rooms
- 1485 rooms
- 226 rooms
- 57 rooms
- 108 rooms
- 49+ rooms
Owner-occupied
Renter-occupied
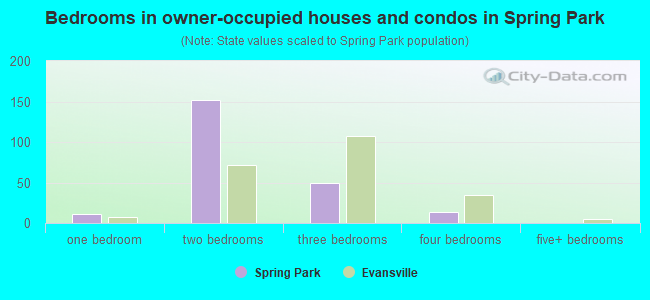
- Bedrooms in owner-occupied houses and condos in Spring Park
- 0no bedroom
- 111 bedroom
- 1522 bedrooms
- 493 bedrooms
- 134 bedrooms
- 05+ bedrooms
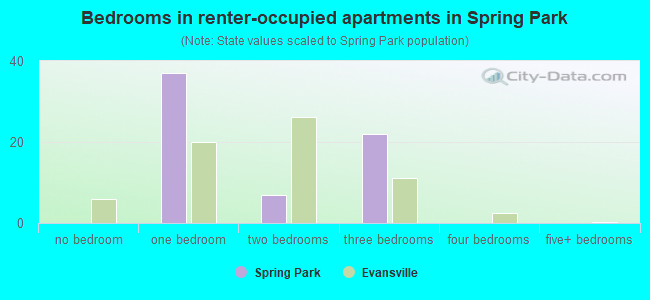
- Bedrooms in renter-occupied apartments in Spring Park
- 0no bedroom
- 371 bedroom
- 72 bedrooms
- 223 bedrooms
- 04 bedrooms
- 05+ bedrooms
Average number of cars or other vehicles available in houses/condos:
Average number of cars or other vehicles available in apartments:
| This neighborhood: | 1.7 |
| Evansville: | 1.8 |
Average number of cars or other vehicles available in apartments:
| Here: | 1.2 |
| city: | 1.1 |
Percentage of units with a mortgage:
| Spring Park: | 64.2% |
| Evansville: | 58.5% |
Average estimated value of detached houses in 2022 (84.5% of all units):
| Spring Park: | $94,838 |
| Indiana: | $257,916 |
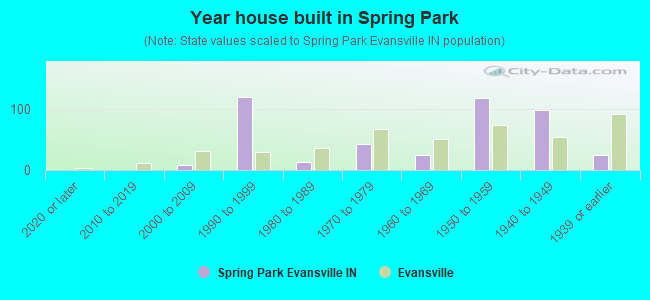
- Year house built in Spring Park
- 02020 or later
- 02010 to 2019
- 82000 to 2009
- 1201990 to 1999
- 141980 to 1989
- 431970 to 1979
- 241960 to 1969
- 1191950 to 1959
- 991940 to 1949
- 251939 or earlier
City-data.com crime index for city in 2020 (higher means more crime):
| City: | 440.8 |
| U.S. average: | 219.5 |
Travel time to work (commute)
![Travel time to work (commute)]()
- 58Less than 5 minutes
- 945 to 9 minutes
- 28910 to 14 minutes
- 15715 to 19 minutes
- 10620 to 24 minutes
- 3025 to 29 minutes
- 2930 to 34 minutes
- 735 to 39 minutes
- 2545 to 59 minutes

Means of transportation to work
![Means of transportation to work]()
- 62.1%212Drove a car alone
- 32.8%112Carpooled
- 1.8%6Bus
- 2.6%9Bicycle
- 48.9%167Walked
- 5.9%20Worked at home

Time leaving home to go to work
![Time leaving home to go to work]()
- 4812:00 a.m. to 4:59 a.m.
- 385:00 a.m. to 5:29 a.m.
- 395:30 a.m. to 5:59 a.m.
- 766:00 a.m. to 6:29 a.m.
- 326:30 a.m. to 6:59 a.m.
- 1357:00 a.m. to 7:29 a.m.
- 627:30 a.m. to 7:59 a.m.
- 468:00 a.m. to 8:29 a.m.
- 228:30 a.m. to 8:59 a.m.
- 539:00 a.m. to 9:59 a.m.
- 3110:00 a.m. to 10:59 a.m.
- 911:00 a.m. to 11:59 a.m.
- 14312:00 p.m. to 3:59 p.m.
- 714:00 p.m. to 11:59 p.m.

Occupations of males:
- Percentage of males in management occupations (except farmers):
Here: 22.7% city: 8.4%
- Percentage of males in business and financial operations occupations:
Here: 11.1% city: 3.1%
- Percentage of males in architecture and engineering occupations:
Here: 5.5% city: 3.0%
- Percentage of males in education, training, and library occupations:
Here: 9.8% city: 2.7%
- Percentage of males in arts, design, entertainment, sports, and media occupations:
Here: 3.9% city: 1.4%
- Percentage of males in service occupations:
Here: 24.4% city: 15.9%
- Percentage of males in sales and office occupations:
Here: 23.3% city: 14.7%
- Percentage of males in construction, extraction, and maintenance occupations:
Here: 9.2% city: 7.3%
- Percentage of males in production occupations:
Here: 8.3% city: 14.9%
- Percentage of males in transportation occupations:
Here: 14.4% city: 7.3%
- Percentage of males in material moving occupations:
Here: 6.7% city: 8.2%
Occupations of females:
- Percentage of females in management occupations (except farmers):
Here: 5.6% city: 6.4%
- Percentage of females in business and financial operations occupations:
Here: 8.3% city: 4.6%
- Percentage of females in computer and mathematical occupations:
Here: 1.5% city: 1.4%
- Percentage of females in community and social services occupations:
Here: 4.4% city: 2.7%
- Percentage of females in education, training, and library occupations:
Here: 22.8% city: 5.7%
- Percentage of females in arts, design, entertainment, sports, and media occupations:
Here: 5.0% city: 1.3%
- Percentage of females in healthcare practitioners and technical occupations:
Here: 15.6% city: 8.9%
- Percentage of females in service occupations:
Here: 30.6% city: 26.1%
- Percentage of females in sales and office occupations:
Here: 31.2% city: 30.9%
- Percentage of females in production occupations:
Here: 22.6% city: 5.3%
Education in this neighborhood (subdivision or community):
- Percentage of people 3 years and older in K-12 schools:
Spring Park: 26.7% Evansville: 15.5%
- Percentage of people 3 years and older in undergraduate colleges:
Spring Park: 29.9% Evansville: 5.1%
- Percentage of people 3 years and older in grad. or professional schools:
Spring Park: 3.0% Evansville: 0.8%
- Percentage of students K-12 enrolled in private schools:
Spring Park: 41.0% Evansville: 15.2%
Percentage of population below poverty level:
| Spring Park: | 20.0% |
| Evansville: | 19.3% |
Median year owner moved in (as recorded in 2022):
Median year renter moved in (as recorded in 2022):
| Spring Park: | 2006 |
| Evansville: | 2011 |
Median year renter moved in (as recorded in 2022):
| Spring Park: | 2020 |
| Evansville: | 2020 |
Percentage of married-couple families with both working:
| Spring Park: | 67.2% |
| Evansville: | 71.5% |
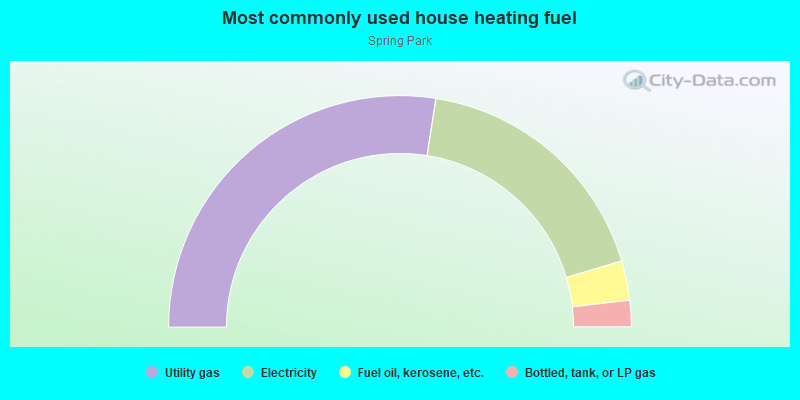
- 55.0%Utility gas
- 35.8%Electricity
- 5.5%Fuel oil, kerosene, etc.
- 3.7%Bottled, tank, or LP gas
Roads and streets:
E Oregon St
Length: 0.49 miles
Direction: E-W
Address range: 2000 to 2499
Direction: E-W
Address range: 2000 to 2499
E Columbia St
Length: 0.34 miles
Direction: E-W
Address range: 2000 to 2299
Direction: E-W
Address range: 2000 to 2299
N Kelsey Ave
Length: 0.28 miles
Directions: N-S, SE-NW
Address range: 700 to 1099
Directions: N-S, SE-NW
Address range: 700 to 1099
N Spring St
Length: 0.19 miles
Direction: N-S
Address range: 800 to 1099
Direction: N-S
Address range: 800 to 1099
N Alvord Blvd
Length: 0.19 miles
Direction: N-S
Address range: 700 to 999
Direction: N-S
Address range: 700 to 999
E Fairlawn Cir
Length: 0.16 miles
Directions: E-W, N-S, SE-NW, SW-NE
Address range: 800 to 1099
Directions: E-W, N-S, SE-NW, SW-NE
Address range: 800 to 1099
N Lincoln Park Dr
Length: 0.13 miles
Direction: N-S
Address range: 800 to 1017
Direction: N-S
Address range: 800 to 1017
W Fairlawn Cir
Length: 0.11 miles
Directions: E-W, N-S, SW-NE
Address range: 900 to 1124
Directions: E-W, N-S, SW-NE
Address range: 900 to 1124
E Missouri St
Length: 0.11 miles
Direction: E-W
Address range: 1900 to 2099
Direction: E-W
Address range: 1900 to 2099
Lincoln Park Dr
Length: 0.07 miles
Direction: N-S
Address range: 1000 to 1018
Direction: N-S
Address range: 1000 to 1018
N Boeke Rd
Length: 0.03 miles
Direction: N-S
Address range: 958 to 989
Direction: N-S
Address range: 958 to 989
Fairlawn Ct
Length: 0.03 miles
Directions: N-S, SW-NE
Address range: 800 to 999
Directions: N-S, SW-NE
Address range: 800 to 999
Fairlawn Cir
Length: 0.02 miles
Directions: N-S, SE-NW
Address range: 800 to 899
Directions: N-S, SE-NW
Address range: 800 to 899
Railroad features:
Southern Rlwy
Length: 0.34 miles
Directions: E-W, SW-NE
Directions: E-W, SW-NE