Spring Valley neighborhood in Grand Junction, Colorado (CO), 81506 detailed profile
Settings
X


Business Search - 14 Million verified businesses
Area: 0.081 square miles
Population: 253
Population density:
| Spring Valley: | 3,127 people per square mile |
| Grand Junction: | 2,209 people per square mile |

- 24388.4%White
- 103.6%Some other race
- 62.2%Native Hawaiian and Other
Pacific Islander - 62.2%Two or more races
- 41.5%Black
- 41.5%Hispanic or Latino
- 20.7%American Indian

Median household income in 2022:
| Spring Valley: | $70,168 |
| Grand Junction: | $61,458 |
Distribution of median household income
![Distribution of median household income]()
- 12Less than $10,000
- 9$10,000 to $19,999
- 24$20,000 to $29,999
- 5$30,000 to $39,999
- 25$40,000 to $49,999
- 9$50,000 to $59,999
- 19$60,000 to $74,999
- 17$75,000 to $99,999
- 28$100,000 to $124,999
- 7$125,000 to $149,999
- 11$150,000 to $199,999
- 5$200,000 or more

Distribution of owner-occupied house/condo value
![Distribution of owner-occupied house/condo value]()
- 3Less than $50,000
- 6$150,000 to $199,999
- 3$200,000 to $249,999
- 15$250,000 to $299,999
- 14$300,000 to $399,999
- 18$400,000 to $499,999
- 7$500,000 to $749,999
- 3$750,000 to $999,999

Distribution of rent paid by renters
![Distribution of rent paid by renters]()
- 15$100 to $199
- 28$200 to $299
- 9$300 to $399
- 20$500 to $599
- 21$700 to $799
- 10$800 to $899
- 10$900 to $999
- 4$1,000 to $1,249
- 45$1,250 to $1,499
- 4$1,500 to $1,999
- 16$2,000 or more

Median rent in 2022:
| Spring Valley: | $758 |
| Grand Junction: | $1,037 |
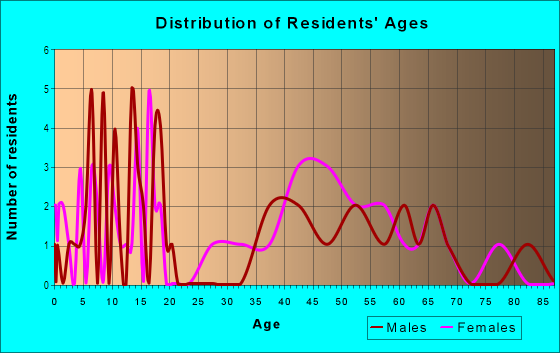
| Males: | 83 |
| Females: | 170 |
Males:
| This neighborhood: | 46.1 years |
| Whole city: | 35.2 years |
| This neighborhood: | 57.9 years |
| Whole city: | 41.4 years |
Average household size:
| Spring Valley: | 11.7 people |
| Grand Junction: | 2.3 people |
Percentage of family households:
| Spring Valley: | 8.5% |
| Grand Junction: | 41.5% |
| Here: | 21.2% |
| Grand Junction: | 44.5% |
Percentage of married-couple families with children (among all households):
| Spring Valley: | 59.9% |
| Grand Junction: | 30.4% |
Percentage of single-mother households (among all households):
| Spring Valley: | 48.1% |
| Grand Junction: | 7.7% |
Percentage of never married males 15 years old and over:
Percentage of never married females 15 years old and over:
| Spring Valley: | 7.8% |
| Grand Junction: | 20.7% |
Percentage of never married females 15 years old and over:
| Spring Valley: | 10.0% |
| city: | 15.0% |
Percentage of people that speak English not well or not at all:
| Spring Valley: | 0.0% |
| Grand Junction: | 0.8% |
Percentage of people born in this state:
Percentage of people born in another U.S. state:
Percentage of native residents but born outside the U.S.:
Percentage of foreign born residents:
| Here: | 49.6% |
| Grand Junction: | 47.4% |
Percentage of people born in another U.S. state:
| Spring Valley: | 49.3% |
| Grand Junction: | 47.0% |
Percentage of native residents but born outside the U.S.:
| Here: | 0.3% |
| city: | 1.0% |
Percentage of foreign born residents:
| Here: | 0.8% |
| Grand Junction: | 4.7% |

Owner-occupied
Renter-occupied


- Rooms in owner-occupied houses and condos in Spring Valley
- 31 room
- 02 rooms
- 33 rooms
- 164 rooms
- 125 rooms
- 126 rooms
- 77 rooms
- 88 rooms
- 99+ rooms

- Rooms in renter-occupied apartments in Spring Valley
- 101 room
- 262 rooms
- 113 rooms
- 214 rooms
- 115 rooms
- 36 rooms
- 47 rooms
- 18 rooms
- 99+ rooms
Owner-occupied
Renter-occupied

- Bedrooms in owner-occupied houses and condos in Spring Valley
- 3no bedroom
- 21 bedroom
- 142 bedrooms
- 333 bedrooms
- 104 bedrooms
- 25+ bedrooms

- Bedrooms in renter-occupied apartments in Spring Valley
- 16no bedroom
- 351 bedroom
- 252 bedrooms
- 83 bedrooms
- 14 bedrooms
- 95+ bedrooms
Average number of cars or other vehicles available in houses/condos:
Average number of cars or other vehicles available in apartments:
| This neighborhood: | 1.5 |
| Grand Junction: | 2.2 |
Average number of cars or other vehicles available in apartments:
| Here: | 0.9 |
| city: | 1.3 |
Percentage of units with a mortgage:
| Spring Valley: | 55.8% |
| Grand Junction: | 65.2% |
Housing prices:
- Average estimated value of detached houses in 2022 (31.4% of all units):
Spring Valley: $378,383 Grand Junction: $357,130
- Average estimated value of townhouses or other attached units in 2022 (19.7% of all units):
This neighborhood: $239,679 city: $307,717

- Year house built in Spring Valley
- 22020 or later
- 22010 to 2019
- 382000 to 2009
- 831990 to 1999
- 221980 to 1989
- 301970 to 1979
- 31960 to 1969
- 71950 to 1959
- 21940 to 1949
- 31939 or earlier

City-data.com crime index for city in 2020 (higher means more crime):
| City: | 384.0 |
| U.S. average: | 219.5 |
Travel time to work (commute)
![Travel time to work (commute)]()
- 3Less than 5 minutes
- 375 to 9 minutes
- 4010 to 14 minutes
- 2615 to 19 minutes
- 1320 to 24 minutes
- 530 to 34 minutes
- 1245 to 59 minutes
- 260 to 89 minutes
- 190 or more minutes

Means of transportation to work
![Means of transportation to work]()
- 79.4%45Drove a car alone
- 8.8%5Carpooled
- 3.5%2Walked
- 5.3%3Other means
- 5.3%3Worked at home

Time leaving home to go to work
![Time leaving home to go to work]()
- 55:00 a.m. to 5:29 a.m.
- 15:30 a.m. to 5:59 a.m.
- 76:00 a.m. to 6:29 a.m.
- 126:30 a.m. to 6:59 a.m.
- 137:00 a.m. to 7:29 a.m.
- 327:30 a.m. to 7:59 a.m.
- 258:00 a.m. to 8:29 a.m.
- 158:30 a.m. to 8:59 a.m.
- 69:00 a.m. to 9:59 a.m.
- 210:00 a.m. to 10:59 a.m.
- 611:00 a.m. to 11:59 a.m.
- 312:00 p.m. to 3:59 p.m.
- 64:00 p.m. to 11:59 p.m.

Occupations of males:
- Percentage of males in management occupations (except farmers):
Here: 10.9% city: 11.9%
- Percentage of males in business and financial operations occupations:
Here: 18.3% city: 2.7%
- Percentage of males in computer and mathematical occupations:
Here: 9.5% city: 2.6%
- Percentage of males in legal occupations:
Here: 2.9% city: 0.6%
- Percentage of males in healthcare practitioners and technical occupations:
Here: 11.5% city: 4.1%
- Percentage of males in sales and office occupations:
Here: 35.3% city: 14.3%
- Percentage of males in material moving occupations:
Here: 9.5% city: 3.8%
Occupations of females:
- Percentage of females in business and financial operations occupations:
Here: 16.9% city: 4.7%
- Percentage of females in education, training, and library occupations:
Here: 17.7% city: 9.5%
- Percentage of females in arts, design, entertainment, sports, and media occupations:
Here: 12.0% city: 1.5%
- Percentage of females in healthcare practitioners and technical occupations:
Here: 10.5% city: 13.3%
- Percentage of females in construction, extraction, and maintenance occupations:
Here: 13.6% city: 0.5%
- Percentage of females in production occupations:
Here: 28.9% city: 1.9%
Percentage of people 16-64 in Armed Forces:
| Spring Valley: | 0.0% |
| Grand Junction: | 0.1% |
Education in this neighborhood (subdivision or community):
- Percentage of people 3 years and older in K-12 schools:
Spring Valley: 17.0% Grand Junction: 13.5%
- Percentage of people 3 years and older in undergraduate colleges:
Spring Valley: 4.7% Grand Junction: 8.2%
- Percentage of people 3 years and older in grad. or professional schools:
Spring Valley: 2.8% Grand Junction: 0.8%
- Percentage of students K-12 enrolled in private schools:
Spring Valley: 39.5% Grand Junction: 12.8%
Percentage of population below poverty level:
| Spring Valley: | 8.4% |
| Grand Junction: | 14.1% |
Median year owner moved in (as recorded in 2022):
Median year renter moved in (as recorded in 2022):
| Spring Valley: | 2074 |
| Grand Junction: | 2013 |
Median year renter moved in (as recorded in 2022):
| Spring Valley: | 2083 |
| Grand Junction: | 2021 |
Percentage of married-couple families with both working:
| Spring Valley: | 296.6% |
| Grand Junction: | 62.1% |

- 59.8%Utility gas
- 25.3%Electricity
- 8.3%No fuel used
- 2.7%Other fuel
- 2.1%Bottled, tank, or LP gas
- 1.8%Wood
Roads and streets:
Applewood St
Length: 0.38 miles
Directions: E-W, N-S, SW-NE
Address range: 2800 to 3199
Directions: E-W, N-S, SW-NE
Address range: 2800 to 3199
Hawthorne (Hawthorne Ave)
Length: 0.29 miles
Direction: E-W
Address range: 2000 to 2199
Direction: E-W
Address range: 2000 to 2199
Spring Valley Cir (F Rd)
Length: 0.26 miles
Directions: E-W, N-S, SE-NW
Address range: 2100 to 2799
Directions: E-W, N-S, SE-NW
Address range: 2100 to 2799
Barberry Ave
Length: 0.17 miles
Directions: E-W, SE-NW
Address range: 2000 to 2199
Directions: E-W, SE-NW
Address range: 2000 to 2199
Clover Ct
Length: 0.10 miles
Directions: E-W, SE-NW
Address range: 1900 to 1999
Directions: E-W, SE-NW
Address range: 1900 to 1999
Sandlewood Ct
Length: 0.10 miles
Direction: E-W
Address range: 2000 to 2199
Direction: E-W
Address range: 2000 to 2199
Beechwood St
Length: 0.08 miles
Direction: N-S
Address range: 2700 to 2799
Direction: N-S
Address range: 2700 to 2799
Barberry Ct
Length: 0.06 miles
Direction: SE-NW
Address range: 1900 to 1999
Direction: SE-NW
Address range: 1900 to 1999
Caper Ct
Length: 0.05 miles
Direction: N-S
Address range: 2800 to 2899
Direction: N-S
Address range: 2800 to 2899
Lily Pl
Length: 0.05 miles
Directions: N-S, SE-NW, SW-NE
Address range: 2900 to 2999
Directions: N-S, SE-NW, SW-NE
Address range: 2900 to 2999
Crocus Ct
Length: 0.03 miles
Direction: SE-NW
Address range: 3000 to 3099
Direction: SE-NW
Address range: 3000 to 3099
Primrose Ct
Length: 0.03 miles
Direction: N-S
Address range: 3100 to 3299
Direction: N-S
Address range: 3100 to 3299
Violet Pl
Length: 0.03 miles
Direction: SE-NW
Address range: 2900 to 2999
Direction: SE-NW
Address range: 2900 to 2999
Snowberry Ct
Length: 0.02 miles
Directions: N-S, SE-NW
Address range: 3100 to 3299
Directions: N-S, SE-NW
Address range: 3100 to 3299