St. John's Church neighborhood in Richmond, Virginia (VA), 23223 detailed profile
Settings
X


Business Search - 14 Million verified businesses
Area: 0.184 square miles
Population: 1,222
Population density:
| St. John's Church: | 6,646 people per square mile |
| Richmond: | 3,819 people per square mile |

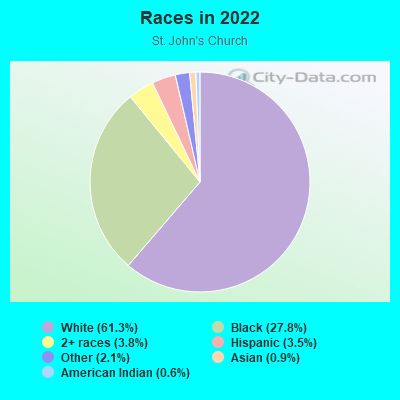
- 98061.3%White
- 44527.8%Black
- 603.8%Two or more races
- 563.5%Hispanic or Latino
- 342.1%Some other race
- 140.9%Asian
- 100.6%American Indian
Median household income in 2022:
| St. John's Church: | $70,672 |
| Richmond: | $58,988 |
Distribution of median household income
![Distribution of median household income]()
- 21Less than $10,000
- 22$10,000 to $19,999
- 30$20,000 to $29,999
- 56$30,000 to $39,999
- 87$40,000 to $49,999
- 17$50,000 to $59,999
- 38$60,000 to $74,999
- 56$75,000 to $99,999
- 73$100,000 to $124,999
- 57$125,000 to $149,999
- 84$150,000 to $199,999
- 101$200,000 or more

Distribution of owner-occupied house/condo value
![Distribution of owner-occupied house/condo value]()
- 13$50,000 to $99,999
- 24$100,000 to $149,999
- 14$150,000 to $199,999
- 20$200,000 to $249,999
- 16$250,000 to $299,999
- 48$300,000 to $399,999
- 79$400,000 to $499,999
- 82$500,000 to $749,999
- 28$750,000 to $999,999
- 24$1,000,000 or more

Distribution of rent paid by renters
![Distribution of rent paid by renters]()
- 15$100 to $199
- 6$200 to $299
- 43$400 to $499
- 16$500 to $599
- 56$600 to $699
- 65$700 to $799
- 55$800 to $899
- 18$900 to $999
- 77$1,000 to $1,249
- 22$1,250 to $1,499
- 92$1,500 to $1,999
- 43$2,000 or more

Median rent in 2022:
| St. John's Church: | $1,373 |
| Richmond: | $1,050 |
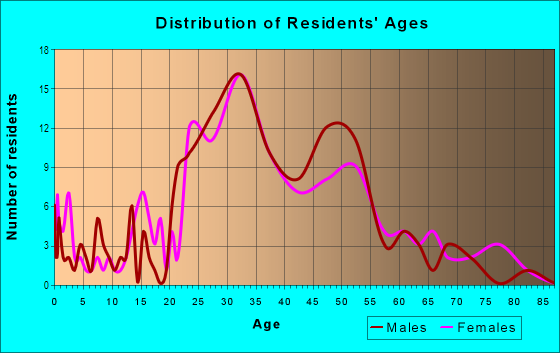
| Males: | 594 |
| Females: | 627 |
Males:
| This neighborhood: | 34.3 years |
| Whole city: | 34.4 years |
| This neighborhood: | 41.6 years |
| Whole city: | 35.1 years |
Average household size:
| St. John's Church: | 2.0 people |
| Richmond: | 26.0 people |
Percentage of family households:
| St. John's Church: | 36.8% |
| Richmond: | 31.3% |
| Here: | 41.2% |
| Richmond: | 25.2% |
Percentage of married-couple families with children (among all households):
| St. John's Church: | 42.1% |
| Richmond: | 23.1% |
Percentage of single-mother households (among all households):
| St. John's Church: | 2.6% |
| Richmond: | 19.2% |
Percentage of never married males 15 years old and over:
Percentage of never married females 15 years old and over:
| St. John's Church: | 19.7% |
| Richmond: | 25.8% |
Percentage of never married females 15 years old and over:
| St. John's Church: | 16.5% |
| city: | 27.8% |
Percentage of people that speak English not well or not at all:
| St. John's Church: | 0.0% |
| Richmond: | 3.2% |
Percentage of people born in this state:
Percentage of people born in another U.S. state:
Percentage of native residents but born outside the U.S.:
Percentage of foreign born residents:
| Here: | 49.1% |
| Richmond: | 59.8% |
Percentage of people born in another U.S. state:
| St. John's Church: | 45.2% |
| Richmond: | 31.3% |
Percentage of native residents but born outside the U.S.:
| Here: | 1.6% |
| city: | 1.7% |
Percentage of foreign born residents:
| Here: | 4.0% |
| Richmond: | 7.1% |
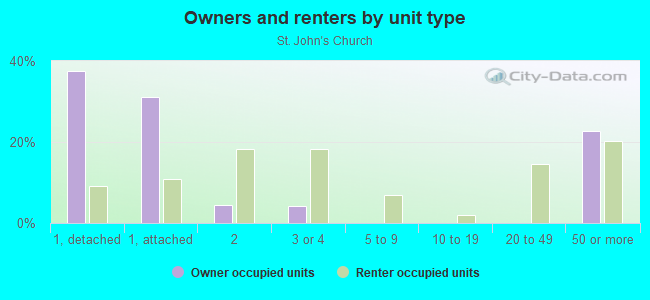
Owner-occupied
Renter-occupied

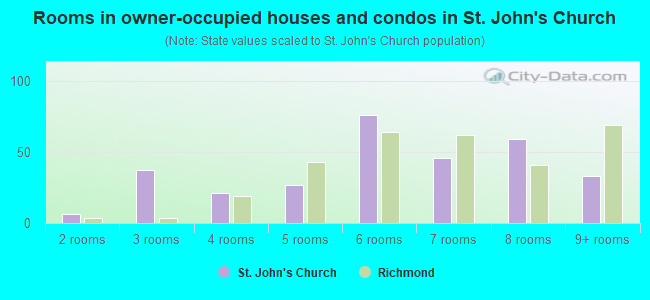
- Rooms in owner-occupied houses and condos in St. John's Church
- 01 room
- 62 rooms
- 373 rooms
- 214 rooms
- 275 rooms
- 766 rooms
- 467 rooms
- 598 rooms
- 339+ rooms
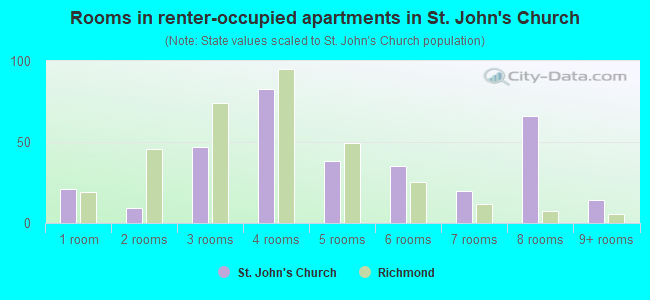
- Rooms in renter-occupied apartments in St. John's Church
- 211 room
- 92 rooms
- 473 rooms
- 834 rooms
- 385 rooms
- 356 rooms
- 207 rooms
- 668 rooms
- 149+ rooms
Owner-occupied
Renter-occupied
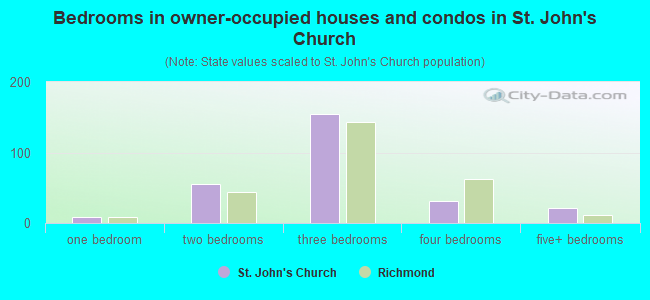
- Bedrooms in owner-occupied houses and condos in St. John's Church
- 0no bedroom
- 91 bedroom
- 552 bedrooms
- 1543 bedrooms
- 314 bedrooms
- 215+ bedrooms
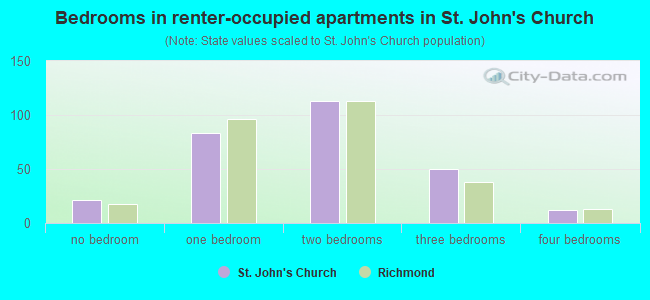
- Bedrooms in renter-occupied apartments in St. John's Church
- 21no bedroom
- 831 bedroom
- 1132 bedrooms
- 503 bedrooms
- 124 bedrooms
- 05+ bedrooms
Average number of cars or other vehicles available in houses/condos:
Average number of cars or other vehicles available in apartments:
| This neighborhood: | 1.9 |
| Richmond: | 1.9 |
Average number of cars or other vehicles available in apartments:
| Here: | 1.3 |
| city: | 1.2 |
Percentage of units with a mortgage:
| St. John's Church: | 75.8% |
| Richmond: | 70.8% |
Housing prices:
- Average estimated value of detached houses in 2022 (29.3% of all units):
St. John's Church: $446,198 Richmond: $385,339
- Average estimated value of townhouses or other attached units in 2022 (31.7% of all units):
This neighborhood: $405,745 city: $498,254
- Average estimated '22 value of housing units in 5-or-more-unit structures (22.4% of all units):
St. John's Church: $328,385 Richmond: $225,966
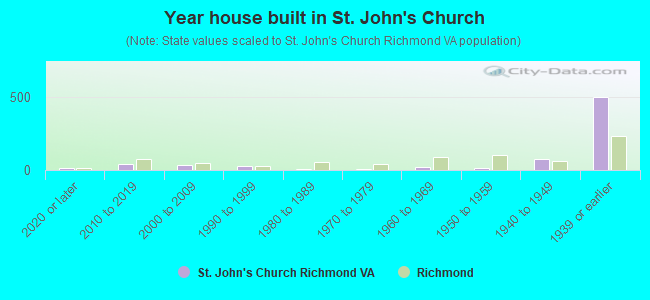
- Year house built in St. John's Church
- 162020 or later
- 442010 to 2019
- 362000 to 2009
- 281990 to 1999
- 101980 to 1989
- 71970 to 1979
- 181960 to 1969
- 151950 to 1959
- 721940 to 1949
- 4971939 or earlier
City-data.com crime index for city in 2020 (higher means more crime):
| City: | 274.8 |
| U.S. average: | 219.5 |
Travel time to work (commute)
![Travel time to work (commute)]()
- 37Less than 5 minutes
- 695 to 9 minutes
- 8410 to 14 minutes
- 12715 to 19 minutes
- 14220 to 24 minutes
- 4225 to 29 minutes
- 5230 to 34 minutes
- 3335 to 39 minutes
- 940 to 44 minutes
- 3945 to 59 minutes
- 3360 to 89 minutes
- 490 or more minutes

Means of transportation to work
![Means of transportation to work]()
- 62.6%456Drove a car alone
- 2.7%20Carpooled
- 15.0%109Bus
- 1.2%9Motorcycle
- 6.9%50Bicycle
- 6.7%49Walked
- 1.2%9Other means
- 21.3%155Worked at home

Time leaving home to go to work
![Time leaving home to go to work]()
- 712:00 a.m. to 4:59 a.m.
- 95:30 a.m. to 5:59 a.m.
- 476:00 a.m. to 6:29 a.m.
- 566:30 a.m. to 6:59 a.m.
- 917:00 a.m. to 7:29 a.m.
- 1117:30 a.m. to 7:59 a.m.
- 918:00 a.m. to 8:29 a.m.
- 648:30 a.m. to 8:59 a.m.
- 609:00 a.m. to 9:59 a.m.
- 3210:00 a.m. to 10:59 a.m.
- 411:00 a.m. to 11:59 a.m.
- 3812:00 p.m. to 3:59 p.m.
- 264:00 p.m. to 11:59 p.m.

Occupations of males:
- Percentage of males in management occupations (except farmers):
Here: 16.2% city: 10.7%
- Percentage of males in business and financial operations occupations:
Here: 10.2% city: 7.2%
- Percentage of males in computer and mathematical occupations:
Here: 11.9% city: 5.6%
- Percentage of males in architecture and engineering occupations:
Here: 9.1% city: 3.0%
- Percentage of males in legal occupations:
Here: 1.5% city: 2.5%
- Percentage of males in education, training, and library occupations:
Here: 8.2% city: 4.6%
- Percentage of males in arts, design, entertainment, sports, and media occupations:
Here: 3.4% city: 2.9%
- Percentage of males in healthcare practitioners and technical occupations:
Here: 3.9% city: 3.0%
- Percentage of males in service occupations:
Here: 9.7% city: 15.4%
- Percentage of males in sales and office occupations:
Here: 9.0% city: 15.3%
- Percentage of males in construction, extraction, and maintenance occupations:
Here: 6.9% city: 7.8%
- Percentage of males in production occupations:
Here: 1.9% city: 3.8%
- Percentage of males in transportation occupations:
Here: 1.4% city: 4.8%
- Percentage of males in material moving occupations:
Here: 5.1% city: 7.1%
Occupations of females:
- Percentage of females in management occupations (except farmers):
Here: 13.4% city: 9.9%
- Percentage of females in business and financial operations occupations:
Here: 13.3% city: 8.0%
- Percentage of females in computer and mathematical occupations:
Here: 3.0% city: 1.7%
- Percentage of females in life, physical, and social science occupations:
Here: 3.1% city: 1.4%
- Percentage of females in community and social services occupations:
Here: 4.6% city: 4.4%
- Percentage of females in legal occupations:
Here: 7.5% city: 1.7%
- Percentage of females in education, training, and library occupations:
Here: 11.3% city: 9.5%
- Percentage of females in arts, design, entertainment, sports, and media occupations:
Here: 4.2% city: 3.7%
- Percentage of females in healthcare practitioners and technical occupations:
Here: 6.7% city: 8.5%
- Percentage of females in service occupations:
Here: 8.9% city: 21.3%
- Percentage of females in sales and office occupations:
Here: 21.4% city: 23.3%
- Percentage of females in production occupations:
Here: 1.7% city: 2.4%
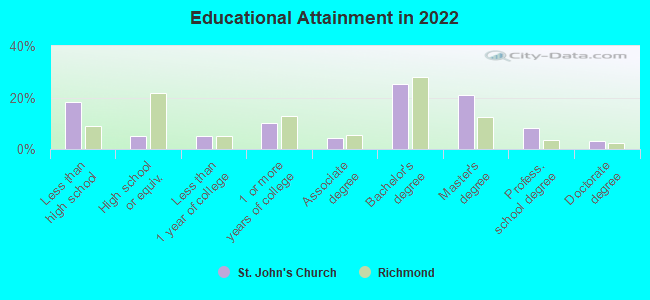
Education in this neighborhood (subdivision or community):
- Percentage of people 3 years and older in K-12 schools:
St. John's Church: 13.8% Richmond: 11.5%
- Percentage of people 3 years and older in undergraduate colleges:
St. John's Church: 5.5% Richmond: 10.1%
- Percentage of people 3 years and older in grad. or professional schools:
St. John's Church: 4.1% Richmond: 1.5%
- Percentage of students K-12 enrolled in private schools:
St. John's Church: 38.0% Richmond: 11.4%
Percentage of population below poverty level:
| St. John's Church: | 6.9% |
| Richmond: | 21.7% |
Median year owner moved in (as recorded in 2022):
| St. John's Church: | 2012 |
| Richmond: | 2011 |
Percentage of married-couple families with both working:
| St. John's Church: | 83.7% |
| Richmond: | 80.3% |
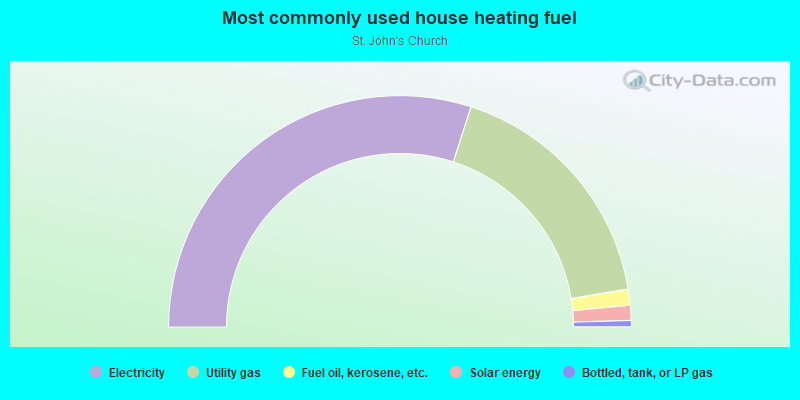
- 59.9%Electricity
- 34.8%Utility gas
- 2.2%Fuel oil, kerosene, etc.
- 2.1%Solar energy
- 0.9%Bottled, tank, or LP gas
Highways in this neighborhood:
E Broad St (US Hwy 60)
Length: 0.73 miles
Direction: SE-NW
Address range: 2200 to 3199
Direction: SE-NW
Address range: 2200 to 3199
Roads and streets:
E Grace St
Length: 0.67 miles
Direction: SE-NW
Address range: 2101 to 3199
Direction: SE-NW
Address range: 2101 to 3199
E Franklin St
Length: 0.65 miles
Direction: SE-NW
Address range: 2200 to 3099
Direction: SE-NW
Address range: 2200 to 3099
N 29th St
Length: 0.27 miles
Directions: E-W, N-S, SE-NW, SW-NE
Address range: 1 to 299
Directions: E-W, N-S, SE-NW, SW-NE
Address range: 1 to 299
N 23rd St
Length: 0.17 miles
Directions: N-S, SW-NE
Address range: 100 to 299
Directions: N-S, SW-NE
Address range: 100 to 299
N 26th St
Length: 0.17 miles
Direction: SW-NE
Address range: 100 to 299
Direction: SW-NE
Address range: 100 to 299
N 28th St
Length: 0.17 miles
Direction: SW-NE
Address range: 100 to 299
Direction: SW-NE
Address range: 100 to 299
N 27th St
Length: 0.17 miles
Direction: SW-NE
Address range: 100 to 299
Direction: SW-NE
Address range: 100 to 299
N 25th St
Length: 0.17 miles
Direction: SW-NE
Address range: 100 to 299
Direction: SW-NE
Address range: 100 to 299
N 31st St
Length: 0.15 miles
Directions: N-S, SW-NE
Address range: 1 to 299
Directions: N-S, SW-NE
Address range: 1 to 299
Libby Ter
Length: 0.14 miles
Directions: E-W, N-S, SE-NW, SW-NE
Address range: 2900 to 3049
Directions: E-W, N-S, SE-NW, SW-NE
Address range: 2900 to 3049
N 24th St
Length: 0.13 miles
Direction: SW-NE
Address range: 100 to 299
Direction: SW-NE
Address range: 100 to 299
N 30th St
Length: 0.11 miles
Direction: SW-NE
Address range: 1 to 299
Direction: SW-NE
Address range: 1 to 299
S 31st St
Length: 0.09 miles
Directions: N-S, SW-NE
Address range: 1 to 91
Directions: N-S, SW-NE
Address range: 1 to 91
N 22nd St
Length: 0.08 miles
Directions: E-W, SW-NE
Address range: 200 to 299
Directions: E-W, SW-NE
Address range: 200 to 299
N 32nd St
Length: 0.08 miles
Directions: N-S, SW-NE
Address range: 124 to 299
Directions: N-S, SW-NE
Address range: 124 to 299