Stadium District neighborhood in Lansing, Michigan (MI), 48906, 48912, 48933 detailed profile
Settings
X


Business Search - 14 Million verified businesses
Area: 0.342 square miles
Population: 841
Population density:
| Stadium District: | 2,458 people per square mile |
| Lansing: | 3,223 people per square mile |

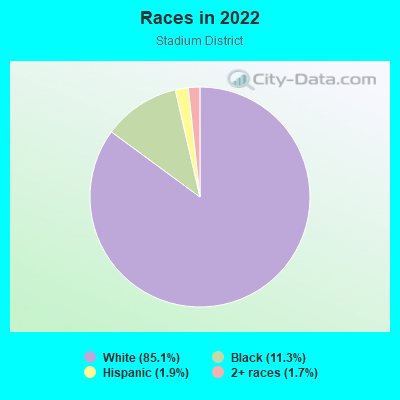
- 71485.1%White
- 9511.3%Black
- 161.9%Hispanic or Latino
- 141.7%Two or more races
Median household income in 2022:
| Stadium District: | $47,630 |
| Lansing: | $48,962 |
Distribution of median household income
![Distribution of median household income]()
- 98Less than $10,000
- 62$10,000 to $19,999
- 98$20,000 to $29,999
- 98$30,000 to $39,999
- 102$40,000 to $49,999
- 75$50,000 to $59,999
- 11$60,000 to $74,999
- 70$75,000 to $99,999
- 39$100,000 to $124,999
- 25$125,000 to $149,999
- 59$150,000 to $199,999
- 36$200,000 or more

Distribution of owner-occupied house/condo value
![Distribution of owner-occupied house/condo value]()
- 118Less than $50,000
- 147$50,000 to $99,999
- 62$100,000 to $149,999
- 6$150,000 to $199,999
- 17$200,000 to $249,999

Distribution of rent paid by renters
![Distribution of rent paid by renters]()
- 44Less than $100
- 25$400 to $499
- 30$500 to $599
- 103$600 to $699
- 20$700 to $799
- 59$800 to $899
- 48$900 to $999
- 121$1,000 to $1,249
- 185$1,250 to $1,499
- 30$1,500 to $1,999
- 133$2,000 or more

Median rent in 2022:
| Stadium District: | $1,357 |
| Lansing: | $773 |
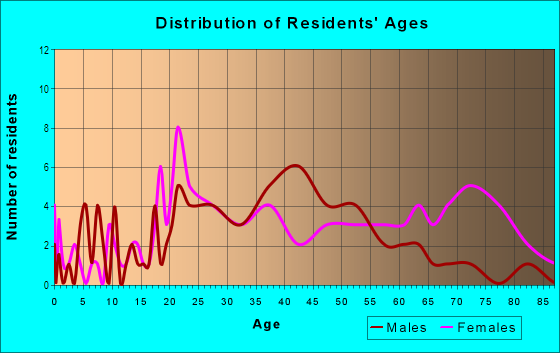
| Males: | 593 |
| Females: | 247 |
Males:
| This neighborhood: | 31.8 years |
| Whole city: | 33.0 years |
| This neighborhood: | 38.4 years |
| Whole city: | 34.5 years |
Average household size:
| Stadium District: | 1.4 people |
| Lansing: | 2.1 people |
Percentage of family households:
| Stadium District: | 14.3% |
| Lansing: | 33.9% |
| Here: | 9.8% |
| Lansing: | 27.4% |
Percentage of married-couple families with children (among all households):
| Stadium District: | 903.3% |
| Lansing: | 23.0% |
Percentage of single-mother households (among all households):
| Stadium District: | 642.7% |
| Lansing: | 14.1% |
Percentage of never married males 15 years old and over:
Percentage of never married females 15 years old and over:
| Stadium District: | 31.7% |
| Lansing: | 24.9% |
Percentage of never married females 15 years old and over:
| Stadium District: | 15.0% |
| city: | 21.6% |
Percentage of people that speak English not well or not at all:
| Stadium District: | 0.0% |
| Lansing: | 2.3% |
Percentage of people born in this state:
Percentage of people born in another U.S. state:
Percentage of native residents but born outside the U.S.:
Percentage of foreign born residents:
| Here: | 77.7% |
| Lansing: | 72.5% |
Percentage of people born in another U.S. state:
| Stadium District: | 14.7% |
| Lansing: | 19.1% |
Percentage of native residents but born outside the U.S.:
| Here: | 0.0% |
| city: | 0.8% |
Percentage of foreign born residents:
| Here: | 7.6% |
| Lansing: | 7.6% |
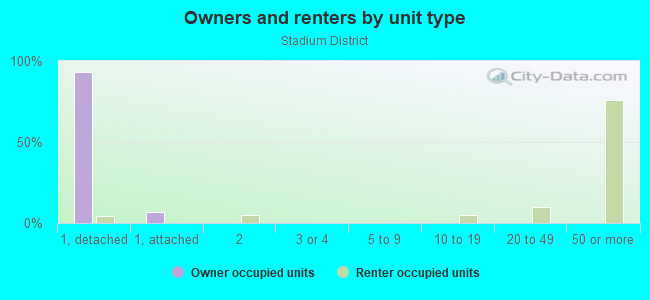
Owner-occupied
Renter-occupied

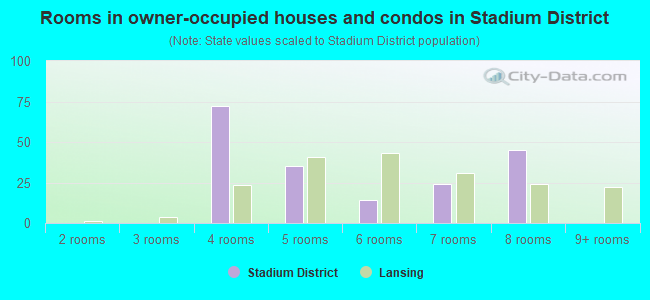
- Rooms in owner-occupied houses and condos in Stadium District
- 01 room
- 02 rooms
- 03 rooms
- 724 rooms
- 355 rooms
- 146 rooms
- 247 rooms
- 458 rooms
- 09+ rooms
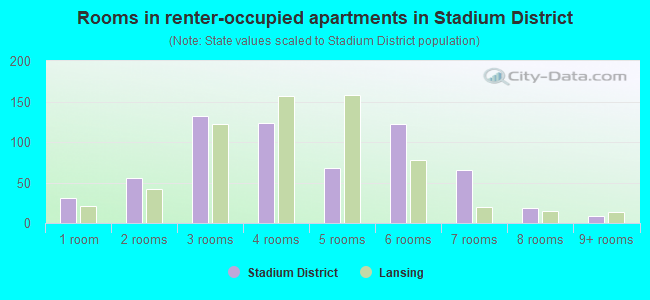
- Rooms in renter-occupied apartments in Stadium District
- 311 room
- 562 rooms
- 1323 rooms
- 1244 rooms
- 685 rooms
- 1226 rooms
- 657 rooms
- 198 rooms
- 99+ rooms
Owner-occupied
Renter-occupied
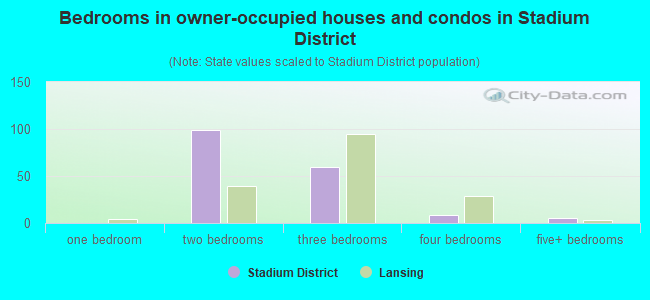
- Bedrooms in owner-occupied houses and condos in Stadium District
- 0no bedroom
- 01 bedroom
- 992 bedrooms
- 603 bedrooms
- 84 bedrooms
- 55+ bedrooms
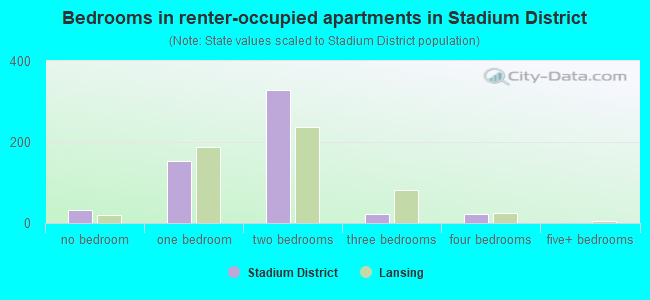
- Bedrooms in renter-occupied apartments in Stadium District
- 31no bedroom
- 1531 bedroom
- 3282 bedrooms
- 223 bedrooms
- 224 bedrooms
- 05+ bedrooms
Average number of cars or other vehicles available in houses/condos:
Average number of cars or other vehicles available in apartments:
| This neighborhood: | 7.8 |
| Lansing: | 1.7 |
Average number of cars or other vehicles available in apartments:
| Here: | 1.5 |
| city: | 1.1 |
Percentage of units with a mortgage:
| Stadium District: | 71.5% |
| Lansing: | 65.6% |
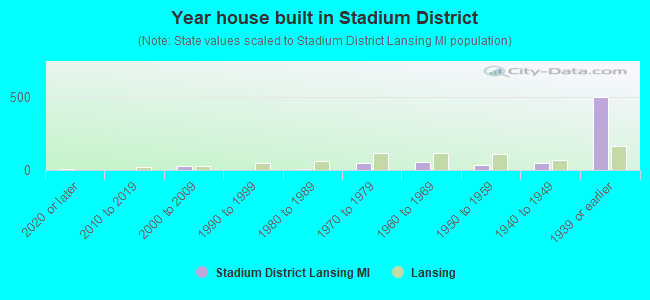
- Year house built in Stadium District
- 92020 or later
- 02010 to 2019
- 262000 to 2009
- 01990 to 1999
- 51980 to 1989
- 511970 to 1979
- 561960 to 1969
- 351950 to 1959
- 511940 to 1949
- 5001939 or earlier
City-data.com crime index for city in 2020 (higher means more crime):
| City: | 553.0 |
| U.S. average: | 219.5 |
Travel time to work (commute)
![Travel time to work (commute)]()
- 55Less than 5 minutes
- 1735 to 9 minutes
- 20410 to 14 minutes
- 14015 to 19 minutes
- 13720 to 24 minutes
- 2925 to 29 minutes
- 4730 to 34 minutes
- 840 to 44 minutes
- 1145 to 59 minutes
- 560 to 89 minutes
- 1390 or more minutes

Means of transportation to work
![Means of transportation to work]()
- 82.8%251Drove a car alone
- 9.6%29Carpooled
- 7.3%22Worked at home

Time leaving home to go to work
![Time leaving home to go to work]()
- 4512:00 a.m. to 4:59 a.m.
- 635:00 a.m. to 5:29 a.m.
- 335:30 a.m. to 5:59 a.m.
- 996:00 a.m. to 6:29 a.m.
- 726:30 a.m. to 6:59 a.m.
- 1027:00 a.m. to 7:29 a.m.
- 907:30 a.m. to 7:59 a.m.
- 1138:00 a.m. to 8:29 a.m.
- 278:30 a.m. to 8:59 a.m.
- 59:00 a.m. to 9:59 a.m.
- 1110:00 a.m. to 10:59 a.m.
- 5211:00 a.m. to 11:59 a.m.
- 1512:00 p.m. to 3:59 p.m.
- 924:00 p.m. to 11:59 p.m.

Occupations of males:
- Percentage of males in management occupations (except farmers):
Here: 15.8% city: 6.2%
- Percentage of males in business and financial operations occupations:
Here: 13.6% city: 4.1%
- Percentage of males in computer and mathematical occupations:
Here: 18.5% city: 6.1%
- Percentage of males in life, physical, and social science occupations:
Here: 14.8% city: 1.9%
- Percentage of males in legal occupations:
Here: 17.3% city: 0.7%
- Percentage of males in education, training, and library occupations:
Here: 21.1% city: 4.9%
- Percentage of males in arts, design, entertainment, sports, and media occupations:
Here: 6.2% city: 1.9%
- Percentage of males in healthcare practitioners and technical occupations:
Here: 14.8% city: 2.5%
- Percentage of males in service occupations:
Here: 12.3% city: 17.2%
- Percentage of males in sales and office occupations:
Here: 21.0% city: 13.3%
- Percentage of males in construction, extraction, and maintenance occupations:
Here: 71.3% city: 6.5%
- Percentage of males in production occupations:
Here: 3.5% city: 9.4%
- Percentage of males in material moving occupations:
Here: 43.1% city: 8.5%
Occupations of females:
- Percentage of females in business and financial operations occupations:
Here: 16.9% city: 6.7%
- Percentage of females in computer and mathematical occupations:
Here: 3.3% city: 2.4%
- Percentage of females in education, training, and library occupations:
Here: 46.2% city: 8.7%
- Percentage of females in arts, design, entertainment, sports, and media occupations:
Here: 11.0% city: 1.7%
- Percentage of females in healthcare practitioners and technical occupations:
Here: 36.9% city: 6.7%
- Percentage of females in service occupations:
Here: 149.8% city: 25.0%
- Percentage of females in sales and office occupations:
Here: 32.4% city: 25.9%
- Percentage of females in production occupations:
Here: 4.4% city: 5.6%
- Percentage of females in transportation occupations:
Here: 33.5% city: 1.5%
- Percentage of females in material moving occupations:
Here: 4.4% city: 2.3%
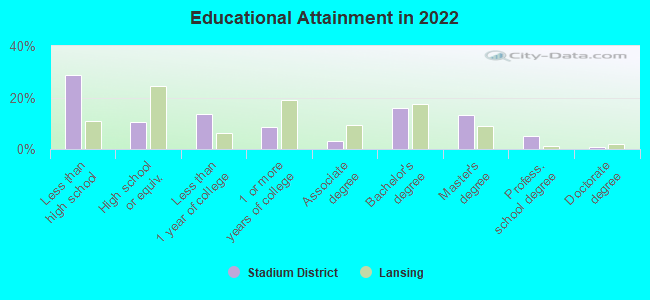
Education in this neighborhood (subdivision or community):
- Percentage of people 3 years and older in K-12 schools:
Stadium District: 48.0% Lansing: 14.3%
- Percentage of people 3 years and older in undergraduate colleges:
Stadium District: 9.0% Lansing: 4.6%
- Percentage of people 3 years and older in grad. or professional schools:
Stadium District: 6.1% Lansing: 2.6%
- Percentage of students K-12 enrolled in private schools:
Stadium District: 6.4% Lansing: 7.9%
Percentage of population below poverty level:
| Stadium District: | 26.1% |
| Lansing: | 22.2% |
Median year renter moved in (as recorded in 2022):
| Stadium District: | 2017 |
| Lansing: | 2020 |
Percentage of married-couple families with both working:
| Stadium District: | 62.0% |
| Lansing: | 59.6% |
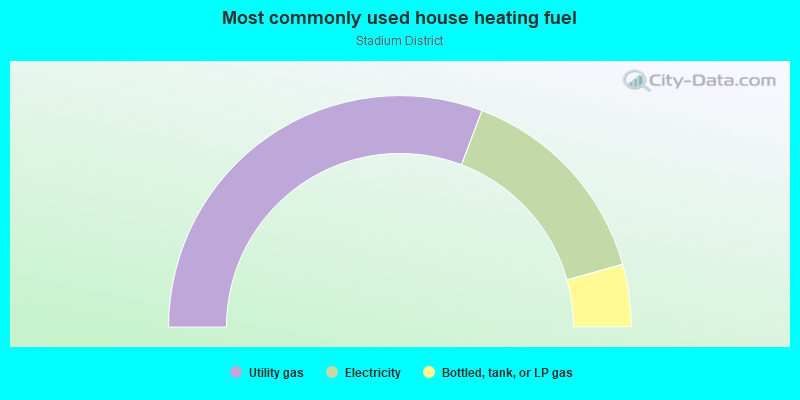
- 61.5%Utility gas
- 29.7%Electricity
- 8.7%Bottled, tank, or LP gas
Highways in this neighborhood:
US Hwy 27 Bus (S Cedar St, I- 96 Bus)
Length: 2.04 miles
Direction: N-S
Address range: 100 to 899
Direction: N-S
Address range: 100 to 899
State Hwy 43 (I- 69 Bus, E Saginaw St)
Length: 0.92 miles
Direction: E-W
Address range: 300 to 703
Direction: E-W
Address range: 300 to 703
Roads and streets:
Museum Dr
Length: 0.50 miles
Directions: E-W, N-S, SE-NW, SW-NE
Address range: 208 to 299
Directions: E-W, N-S, SE-NW, SW-NE
Address range: 208 to 299
E Michigan Ave
Length: 0.46 miles
Direction: E-W
Address range: 300 to 699
Direction: E-W
Address range: 300 to 699
E Shiawassee St
Length: 0.41 miles
Direction: E-W
Address range: 300 to 699
Direction: E-W
Address range: 300 to 699
Pere Marquette Dr
Length: 0.25 miles
Direction: N-S
Address range: 100 to 299
Direction: N-S
Address range: 100 to 299
E Kalamazoo St
Length: 0.24 miles
Direction: E-W
Address range: 400 to 627
Direction: E-W
Address range: 400 to 627
Monroe St
Length: 0.23 miles
Direction: E-W
Address range: 400 to 599
Direction: E-W
Address range: 400 to 599
Center St
Length: 0.18 miles
Direction: N-S
Address range: 700 to 899
Direction: N-S
Address range: 700 to 899
May St
Length: 0.13 miles
Direction: E-W
Address range: 600 to 699
Direction: E-W
Address range: 600 to 699
Erie St
Length: 0.13 miles
Direction: E-W
Address range: 500 to 599
Direction: E-W
Address range: 500 to 599
Sheridan St
Length: 0.13 miles
Direction: E-W
Address range: 600 to 681
Direction: E-W
Address range: 600 to 681
Barnard St
Length: 0.11 miles
Direction: E-W
Address range: 600 to 699
Direction: E-W
Address range: 600 to 699
Park Pl
Length: 0.10 miles
Direction: E-W
Address range: 600 to 699
Direction: E-W
Address range: 600 to 699
Truck Ct
Length: 0.08 miles
Directions: E-W, SE-NW
Address range: 600 to 699
Directions: E-W, SE-NW
Address range: 600 to 699
Manchester Ct
Length: 0.07 miles
Direction: E-W
Address range: 600 to 699
Direction: E-W
Address range: 600 to 699
Jay St
Length: 0.05 miles
Direction: E-W
Direction: E-W
Railroad features:
Conrail RR
Length: 1.49 miles
Directions: E-W, N-S, SE-NW, SW-NE
Directions: E-W, N-S, SE-NW, SW-NE