Stoney Brook Estates neighborhood in Silver Spring, Maryland (MD), 20906 detailed profile
Settings
X


Business Search - 14 Million verified businesses
Area: 0.294 square miles
Population: 2,012
Population density:
| Stoney Brook Estates: | 6,855 people per square mile |
| Silver Spring: | 7,993 people per square mile |

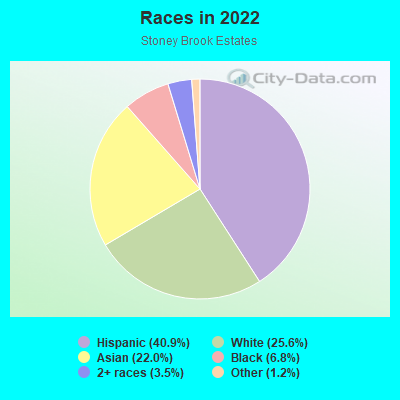
- 83340.9%Hispanic or Latino
- 52325.6%White
- 44822.0%Asian
- 1396.8%Black
- 713.5%Two or more races
- 251.2%Some other race
Median household income in 2022:
| Stoney Brook Estates: | $123,239 |
| Silver Spring: | $81,557 |
Distribution of median household income
![Distribution of median household income]()
- 11Less than $10,000
- 37$10,000 to $19,999
- 37$20,000 to $29,999
- 23$30,000 to $39,999
- 38$40,000 to $49,999
- 27$50,000 to $59,999
- 64$60,000 to $74,999
- 96$75,000 to $99,999
- 93$100,000 to $124,999
- 46$125,000 to $149,999
- 60$150,000 to $199,999
- 88$200,000 or more

Distribution of owner-occupied house/condo value
![Distribution of owner-occupied house/condo value]()
- 12Less than $50,000
- 15$50,000 to $99,999
- 4$200,000 to $249,999
- 22$250,000 to $299,999
- 68$300,000 to $399,999
- 339$400,000 to $499,999
- 64$500,000 to $749,999
- 6$750,000 to $999,999
- 10$1,000,000 or more

Distribution of rent paid by renters
![Distribution of rent paid by renters]()
- 20$900 to $999
- 12$1,250 to $1,499
- 27$1,500 to $1,999
- 134$2,000 or more

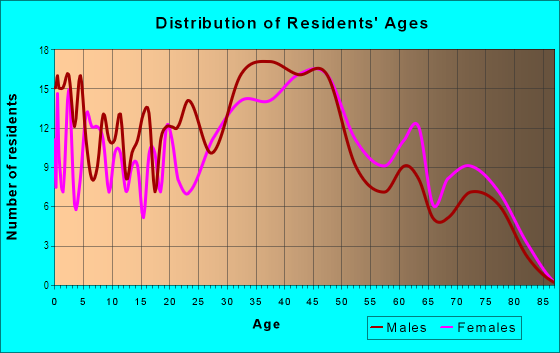
| Males: | 953 |
| Females: | 1,059 |
Males:
| This neighborhood: | 37.0 years |
| Whole city: | 36.7 years |
| This neighborhood: | 37.4 years |
| Whole city: | 36.5 years |
Average household size:
| Stoney Brook Estates: | 20.0 people |
| Silver Spring: | 2.2 people |
Percentage of family households:
| Stoney Brook Estates: | 54.3% |
| Silver Spring: | 38.8% |
| Here: | 62.5% |
| Silver Spring: | 32.5% |
Percentage of married-couple families with children (among all households):
| Stoney Brook Estates: | 26.8% |
| Silver Spring: | 34.5% |
Percentage of single-mother households (among all households):
| Stoney Brook Estates: | 1.0% |
| Silver Spring: | 6.6% |
Percentage of never married males 15 years old and over:
Percentage of never married females 15 years old and over:
| Stoney Brook Estates: | 19.1% |
| Silver Spring: | 22.2% |
Percentage of never married females 15 years old and over:
| Stoney Brook Estates: | 17.1% |
| place: | 24.3% |
Percentage of people that speak English not well or not at all:
| Stoney Brook Estates: | 9.2% |
| Silver Spring: | 9.9% |
Percentage of people born in this state:
Percentage of people born in another U.S. state:
Percentage of native residents but born outside the U.S.:
Percentage of foreign born residents:
| Here: | 27.6% |
| Silver Spring: | 19.7% |
Percentage of people born in another U.S. state:
| Stoney Brook Estates: | 23.7% |
| Silver Spring: | 45.9% |
Percentage of native residents but born outside the U.S.:
| Here: | 3.6% |
| place: | 2.4% |
Percentage of foreign born residents:
| Here: | 45.1% |
| Silver Spring: | 32.0% |
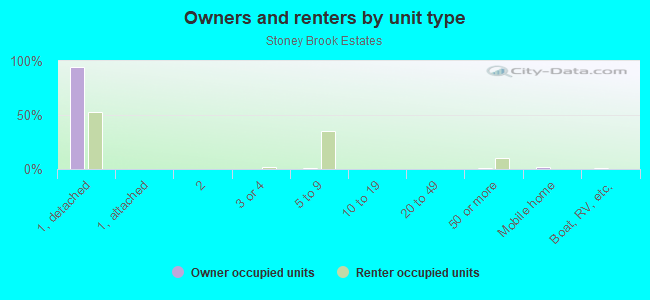
Owner-occupied
Renter-occupied

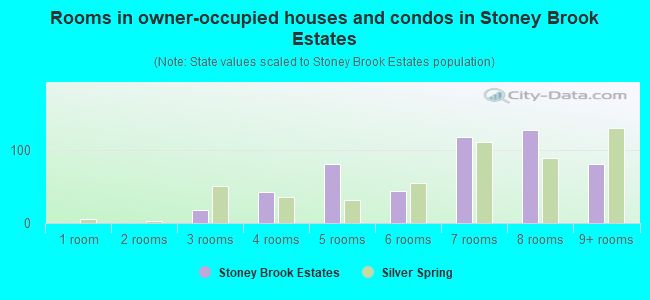
- Rooms in owner-occupied houses and condos in Stoney Brook Estates
- 01 room
- 02 rooms
- 183 rooms
- 424 rooms
- 815 rooms
- 436 rooms
- 1177 rooms
- 1268 rooms
- 819+ rooms
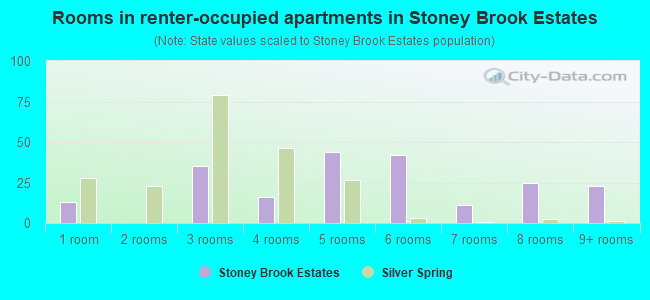
- Rooms in renter-occupied apartments in Stoney Brook Estates
- 131 room
- 02 rooms
- 353 rooms
- 164 rooms
- 445 rooms
- 426 rooms
- 117 rooms
- 258 rooms
- 239+ rooms
Owner-occupied
Renter-occupied
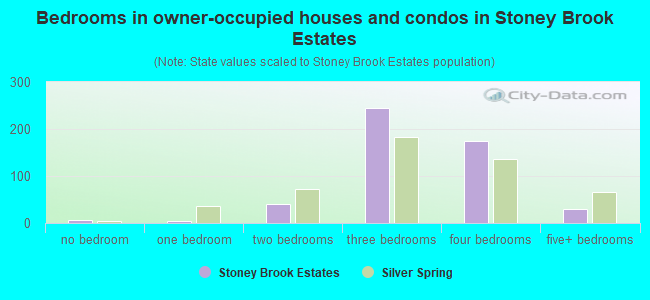
- Bedrooms in owner-occupied houses and condos in Stoney Brook Estates
- 6no bedroom
- 41 bedroom
- 412 bedrooms
- 2443 bedrooms
- 1754 bedrooms
- 305+ bedrooms
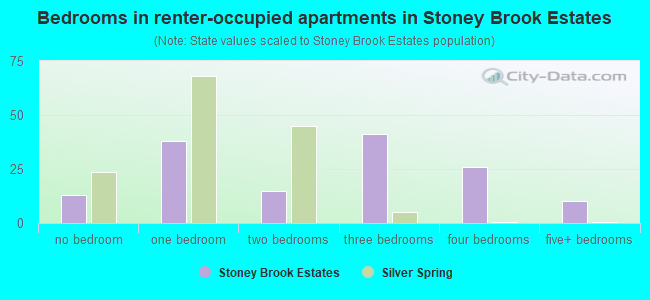
- Bedrooms in renter-occupied apartments in Stoney Brook Estates
- 13no bedroom
- 381 bedroom
- 152 bedrooms
- 413 bedrooms
- 264 bedrooms
- 105+ bedrooms
Average number of cars or other vehicles available in houses/condos:
Average number of cars or other vehicles available in apartments:
| This neighborhood: | 3.1 |
| Silver Spring: | 1.7 |
Average number of cars or other vehicles available in apartments:
| Here: | 4.8 |
| place: | 0.9 |
Percentage of units with a mortgage:
| Stoney Brook Estates: | 71.7% |
| Silver Spring: | 76.3% |
Average estimated value of detached houses in 2022 (100.0% of all units):
| Stoney Brook Estates: | $444,513 |
| Maryland: | $526,819 |
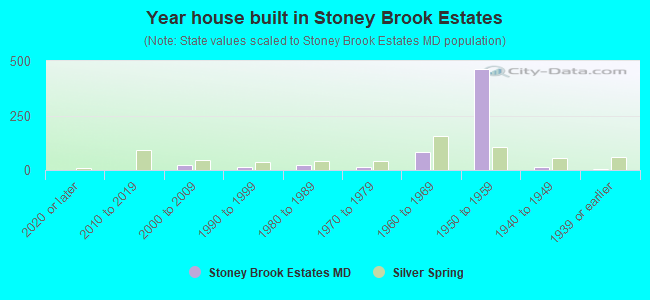
- Year house built in Stoney Brook Estates
- 02020 or later
- 02010 to 2019
- 242000 to 2009
- 161990 to 1999
- 251980 to 1989
- 151970 to 1979
- 841960 to 1969
- 4641950 to 1959
- 131940 to 1949
- 61939 or earlier
Travel time to work (commute)
![Travel time to work (commute)]()
- 12Less than 5 minutes
- 345 to 9 minutes
- 8110 to 14 minutes
- 15415 to 19 minutes
- 10620 to 24 minutes
- 6925 to 29 minutes
- 17930 to 34 minutes
- 3235 to 39 minutes
- 4140 to 44 minutes
- 15945 to 59 minutes
- 10560 to 89 minutes
- 2790 or more minutes

Means of transportation to work
![Means of transportation to work]()
- 69.5%619Drove a car alone
- 13.3%118Carpooled
- 7.8%69Bus
- 2.0%18Subway or elevated rail
- 2.0%18Long-distance train or commuter rail
- 4.0%36Taxi
- 6.9%61Walked
- 0.9%8Other means
- 6.1%54Worked at home

Time leaving home to go to work
![Time leaving home to go to work]()
- 3412:00 a.m. to 4:59 a.m.
- 845:00 a.m. to 5:29 a.m.
- 405:30 a.m. to 5:59 a.m.
- 1216:00 a.m. to 6:29 a.m.
- 1126:30 a.m. to 6:59 a.m.
- 1277:00 a.m. to 7:29 a.m.
- 627:30 a.m. to 7:59 a.m.
- 1718:00 a.m. to 8:29 a.m.
- 318:30 a.m. to 8:59 a.m.
- 599:00 a.m. to 9:59 a.m.
- 5410:00 a.m. to 10:59 a.m.
- 911:00 a.m. to 11:59 a.m.
- 5512:00 p.m. to 3:59 p.m.
- 384:00 p.m. to 11:59 p.m.

Occupations of males:
- Percentage of males in management occupations (except farmers):
Here: 2.1% place: 11.4%
- Percentage of males in computer and mathematical occupations:
Here: 3.3% place: 9.4%
- Percentage of males in life, physical, and social science occupations:
Here: 2.7% place: 5.3%
- Percentage of males in education, training, and library occupations:
Here: 4.1% place: 6.2%
- Percentage of males in arts, design, entertainment, sports, and media occupations:
Here: 3.0% place: 3.9%
- Percentage of males in healthcare practitioners and technical occupations:
Here: 1.1% place: 2.5%
- Percentage of males in service occupations:
Here: 11.2% place: 10.9%
- Percentage of males in sales and office occupations:
Here: 19.5% place: 9.6%
- Percentage of males in construction, extraction, and maintenance occupations:
Here: 30.7% place: 11.6%
- Percentage of males in production occupations:
Here: 3.0% place: 2.2%
- Percentage of males in material moving occupations:
Here: 4.6% place: 2.2%
Occupations of females:
- Percentage of females in management occupations (except farmers):
Here: 7.5% place: 13.0%
- Percentage of females in business and financial operations occupations:
Here: 3.9% place: 8.9%
- Percentage of females in computer and mathematical occupations:
Here: 7.2% place: 5.0%
- Percentage of females in architecture and engineering occupations:
Here: 1.4% place: 1.3%
- Percentage of females in community and social services occupations:
Here: 3.9% place: 2.9%
- Percentage of females in education, training, and library occupations:
Here: 8.0% place: 11.2%
- Percentage of females in arts, design, entertainment, sports, and media occupations:
Here: 2.6% place: 4.5%
- Percentage of females in healthcare practitioners and technical occupations:
Here: 10.4% place: 5.3%
- Percentage of females in service occupations:
Here: 34.2% place: 20.4%
- Percentage of females in sales and office occupations:
Here: 20.5% place: 16.7%
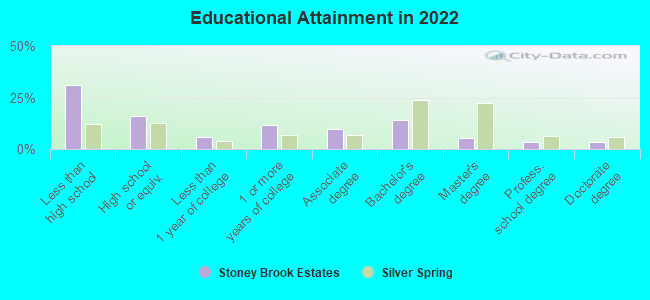
Education in this neighborhood (subdivision or community):
- Percentage of people 3 years and older in K-12 schools:
Stoney Brook Estates: 19.5% Silver Spring: 14.1%
- Percentage of people 3 years and older in undergraduate colleges:
Stoney Brook Estates: 2.9% Silver Spring: 3.4%
- Percentage of people 3 years and older in grad. or professional schools:
Stoney Brook Estates: 1.0% Silver Spring: 2.0%
- Percentage of students K-12 enrolled in private schools:
Stoney Brook Estates: 30.0% Silver Spring: 12.6%
Percentage of population below poverty level:
| Stoney Brook Estates: | 7.7% |
| Silver Spring: | 11.0% |
Median year owner moved in (as recorded in 2022):
| Stoney Brook Estates: | 2005 |
| Silver Spring: | 2011 |
Percentage of married-couple families with both working:
| Stoney Brook Estates: | 83.6% |
| Silver Spring: | 80.2% |
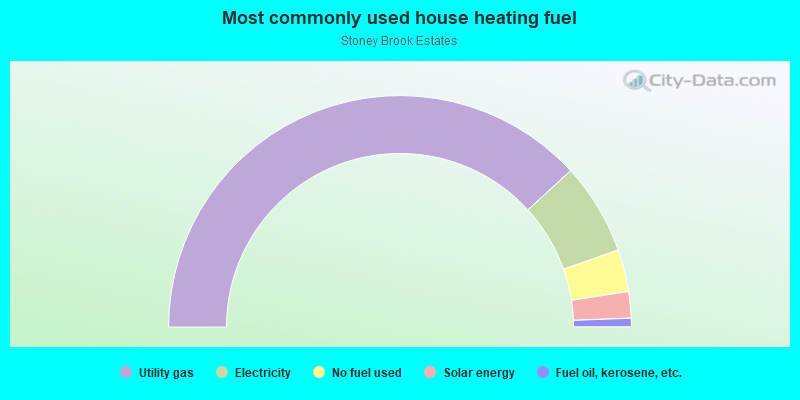
- 76.5%Utility gas
- 12.8%Electricity
- 5.9%No fuel used
- 3.7%Solar energy
- 1.2%Fuel oil, kerosene, etc.
Highways in this neighborhood:
Connecticut Ave (State Hwy 185)
Length: 0.35 miles
Directions: N-S, SE-NW
Address range: 12711 to 12999
Directions: N-S, SE-NW
Address range: 12711 to 12999
Roads and streets:
Littleton St
Length: 1.04 miles
Directions: E-W, N-S, SE-NW, SW-NE
Address range: 3800 to 12899
Directions: E-W, N-S, SE-NW, SW-NE
Address range: 3800 to 12899
Isbell St
Length: 1.01 miles
Directions: E-W, N-S, SE-NW, SW-NE
Address range: 3700 to 4299
Directions: E-W, N-S, SE-NW, SW-NE
Address range: 3700 to 4299
Jeffry St
Length: 0.56 miles
Directions: E-W, SE-NW, SW-NE
Address range: 3711 to 4099
Directions: E-W, SE-NW, SW-NE
Address range: 3711 to 4099
Havard St
Length: 0.52 miles
Directions: E-W, SW-NE
Address range: 3923 to 4299
Directions: E-W, SW-NE
Address range: 3923 to 4299
Bushey Dr
Length: 0.37 miles
Directions: N-S, SE-NW
Address range: 12700 to 12899
Directions: N-S, SE-NW
Address range: 12700 to 12899
Atherton Dr
Length: 0.30 miles
Directions: E-W, N-S, SE-NW, SW-NE
Address range: 12700 to 12899
Directions: E-W, N-S, SE-NW, SW-NE
Address range: 12700 to 12899
Delancy Dr
Length: 0.29 miles
Directions: E-W, SE-NW
Address range: 4000 to 4299
Directions: E-W, SE-NW
Address range: 4000 to 4299
Joliet St
Length: 0.28 miles
Directions: E-W, SE-NW
Address range: 3900 to 3999
Directions: E-W, SE-NW
Address range: 3900 to 3999
Neola Rd
Length: 0.19 miles
Directions: N-S, SE-NW
Address range: 12900 to 12999
Directions: N-S, SE-NW
Address range: 12900 to 12999
Kelsey St
Length: 0.19 miles
Direction: E-W
Address range: 3800 to 3899
Direction: E-W
Address range: 3800 to 3899
Moray Rd
Length: 0.17 miles
Directions: N-S, SE-NW
Address range: 12900 to 12999
Directions: N-S, SE-NW
Address range: 12900 to 12999
Fogel Ln
Length: 0.17 miles
Directions: E-W, SE-NW, SW-NE
Address range: 4100 to 4199
Directions: E-W, SE-NW, SW-NE
Address range: 4100 to 4199
Kayson St
Length: 0.17 miles
Direction: E-W
Address range: 3800 to 3899
Direction: E-W
Address range: 3800 to 3899
Barbara Rd
Length: 0.15 miles
Directions: N-S, SW-NE
Address range: 12700 to 12799
Directions: N-S, SW-NE
Address range: 12700 to 12799
Feldon St
Length: 0.12 miles
Directions: N-S, SE-NW, SW-NE
Address range: 12715 to 12799
Directions: N-S, SE-NW, SW-NE
Address range: 12715 to 12799
Laclede St
Length: 0.07 miles
Directions: N-S, SE-NW
Address range: 12800 to 12899
Directions: N-S, SE-NW
Address range: 12800 to 12899