Surrey Downs neighborhood in Bellevue, Washington (WA), 98004 detailed profile
Settings
X


Business Search - 14 Million verified businesses
Area: 0.148 square miles
Population: 1,364
Population density:
| Surrey Downs: | 9,233 people per square mile |
| Bellevue: | 4,968 people per square mile |

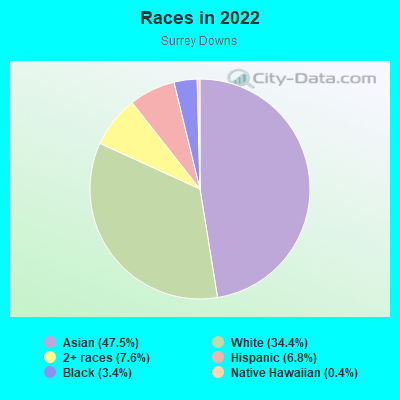
- 65247.5%Asian
- 47234.4%White
- 1057.6%Two or more races
- 936.8%Hispanic or Latino
- 473.4%Black
- 50.4%Native Hawaiian and Other
Pacific Islander
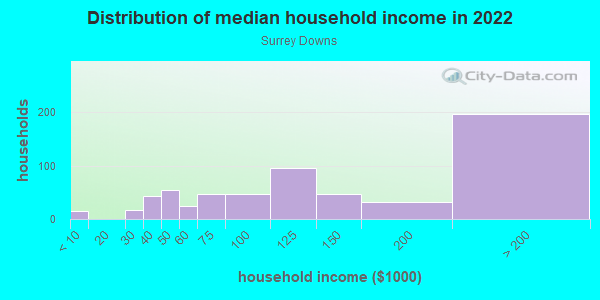
Median household income in 2022:
| Surrey Downs: | $142,708 |
| Bellevue: | $153,779 |
Distribution of median household income
![Distribution of median household income]()
- 15Less than $10,000
- 16$20,000 to $29,999
- 43$30,000 to $39,999
- 55$40,000 to $49,999
- 24$50,000 to $59,999
- 46$60,000 to $74,999
- 47$75,000 to $99,999
- 95$100,000 to $124,999
- 46$125,000 to $149,999
- 31$150,000 to $199,999
- 197$200,000 or more
Distribution of owner-occupied house/condo value
![Distribution of owner-occupied house/condo value]()
- 6$200,000 to $249,999
- 54$400,000 to $499,999
- 13$500,000 to $749,999
- 50$750,000 to $999,999
- 184$1,000,000 or more

Distribution of rent paid by renters
![Distribution of rent paid by renters]()
- 18$900 to $999
- 7$1,000 to $1,249
- 11$1,250 to $1,499
- 93$1,500 to $1,999
- 170$2,000 or more

Median rent in 2022:
| Surrey Downs: | $2,140 |
| Bellevue: | $2,001 |
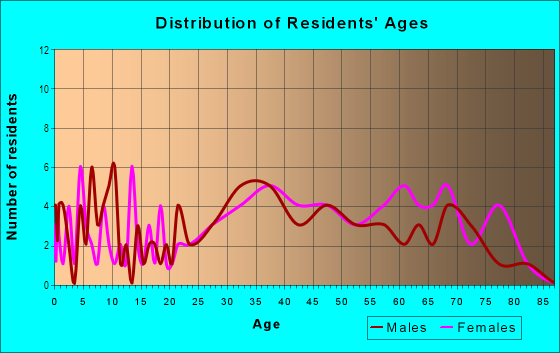
| Males: | 641 |
| Females: | 723 |
Males:
| This neighborhood: | 35.2 years |
| Whole city: | 37.5 years |
| This neighborhood: | 34.8 years |
| Whole city: | 40.9 years |
Average household size:
| Surrey Downs: | 16.3 people |
| Bellevue: | 2.4 people |
Percentage of family households:
| Surrey Downs: | 46.2% |
| Bellevue: | 51.7% |
| Here: | 51.0% |
| Bellevue: | 56.6% |
Percentage of married-couple families with children (among all households):
| Surrey Downs: | 41.9% |
| Bellevue: | 35.0% |
Percentage of single-mother households (among all households):
| Surrey Downs: | 3.9% |
| Bellevue: | 5.0% |
Percentage of never married males 15 years old and over:
Percentage of never married females 15 years old and over:
| Surrey Downs: | 14.7% |
| Bellevue: | 18.3% |
Percentage of never married females 15 years old and over:
| Surrey Downs: | 18.4% |
| city: | 11.9% |
Percentage of people that speak English not well or not at all:
| Surrey Downs: | 8.3% |
| Bellevue: | 5.7% |
Percentage of people born in this state:
Percentage of people born in another U.S. state:
Percentage of native residents but born outside the U.S.:
Percentage of foreign born residents:
| Here: | 23.4% |
| Bellevue: | 27.4% |
Percentage of people born in another U.S. state:
| Surrey Downs: | 32.3% |
| Bellevue: | 27.2% |
Percentage of native residents but born outside the U.S.:
| Here: | 1.7% |
| city: | 2.3% |
Percentage of foreign born residents:
| Here: | 42.5% |
| Bellevue: | 43.1% |
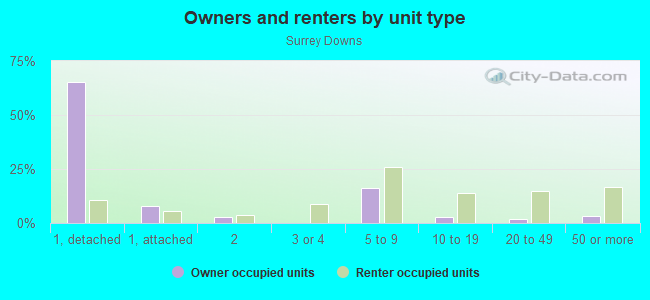
Owner-occupied
Renter-occupied

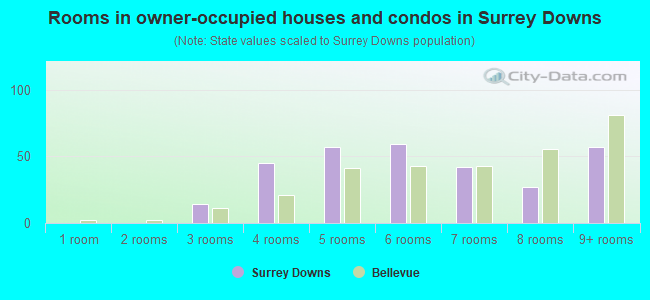
- Rooms in owner-occupied houses and condos in Surrey Downs
- 01 room
- 02 rooms
- 143 rooms
- 454 rooms
- 575 rooms
- 596 rooms
- 427 rooms
- 278 rooms
- 579+ rooms
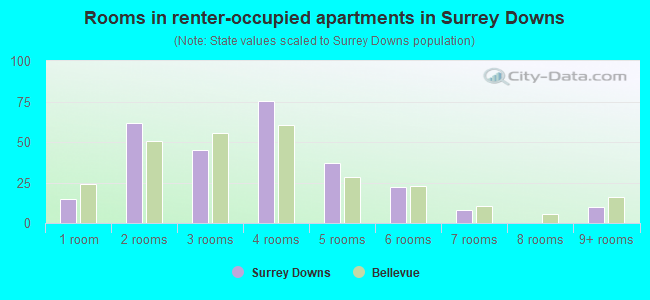
- Rooms in renter-occupied apartments in Surrey Downs
- 151 room
- 622 rooms
- 453 rooms
- 754 rooms
- 375 rooms
- 226 rooms
- 87 rooms
- 08 rooms
- 109+ rooms
Owner-occupied
Renter-occupied
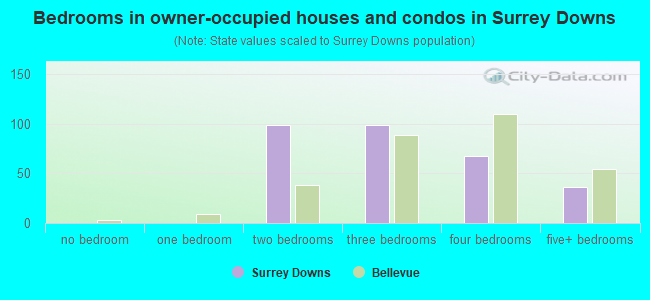
- Bedrooms in owner-occupied houses and condos in Surrey Downs
- 0no bedroom
- 01 bedroom
- 992 bedrooms
- 993 bedrooms
- 684 bedrooms
- 365+ bedrooms
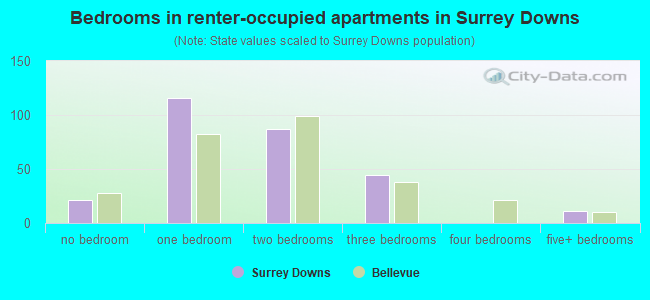
- Bedrooms in renter-occupied apartments in Surrey Downs
- 21no bedroom
- 1161 bedroom
- 872 bedrooms
- 443 bedrooms
- 04 bedrooms
- 115+ bedrooms
Average number of cars or other vehicles available in houses/condos:
Average number of cars or other vehicles available in apartments:
| This neighborhood: | 1.6 |
| Bellevue: | 2.1 |
Average number of cars or other vehicles available in apartments:
| Here: | 1.4 |
| city: | 1.3 |
Percentage of units with a mortgage:
| Surrey Downs: | 65.3% |
| Bellevue: | 62.8% |
Housing prices:
- Average estimated value of detached houses in 2022 (41.2% of all units):
Surrey Downs: $1,617,969 Washington: $734,307
- Average estimated value of townhouses or other attached units in 2022 (7.0% of all units):
This neighborhood: $1,034,021 Washington: $657,697
- Average estimated '22 value of housing units in 5-or-more-unit structures (11.5% of all units):
Surrey Downs: $615,465 Washington: $503,183
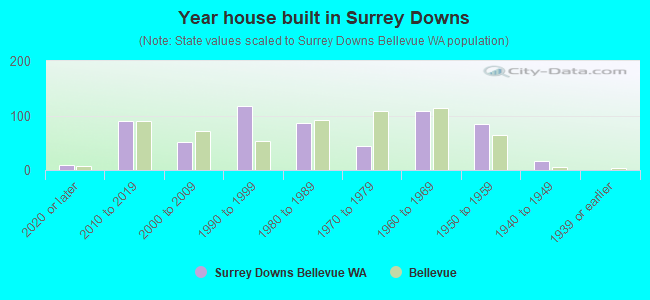
- Year house built in Surrey Downs
- 102020 or later
- 892010 to 2019
- 512000 to 2009
- 1181990 to 1999
- 861980 to 1989
- 441970 to 1979
- 1081960 to 1969
- 851950 to 1959
- 171940 to 1949
- 01939 or earlier
City-data.com crime index for city in 2020 (higher means more crime):
| City: | 179.9 |
| U.S. average: | 219.5 |
Travel time to work (commute)
![Travel time to work (commute)]()
- 22Less than 5 minutes
- 465 to 9 minutes
- 9510 to 14 minutes
- 7115 to 19 minutes
- 6920 to 24 minutes
- 1125 to 29 minutes
- 3630 to 34 minutes
- 3040 to 44 minutes
- 6945 to 59 minutes
- 1060 to 89 minutes

Means of transportation to work
![Means of transportation to work]()
- 41.2%319Drove a car alone
- 17.1%132Carpooled
- 12.0%93Bus
- 2.8%22Taxi
- 2.2%17Bicycle
- 18.1%140Walked
- 21.3%165Worked at home

Time leaving home to go to work
![Time leaving home to go to work]()
- 412:00 a.m. to 4:59 a.m.
- 65:30 a.m. to 5:59 a.m.
- 106:00 a.m. to 6:29 a.m.
- 206:30 a.m. to 6:59 a.m.
- 237:00 a.m. to 7:29 a.m.
- 407:30 a.m. to 7:59 a.m.
- 648:00 a.m. to 8:29 a.m.
- 528:30 a.m. to 8:59 a.m.
- 1249:00 a.m. to 9:59 a.m.
- 4610:00 a.m. to 10:59 a.m.
- 411:00 a.m. to 11:59 a.m.
- 2012:00 p.m. to 3:59 p.m.
- 114:00 p.m. to 11:59 p.m.

Occupations of males:
- Percentage of males in management occupations (except farmers):
Here: 26.0% city: 18.0%
- Percentage of males in business and financial operations occupations:
Here: 3.2% city: 6.4%
- Percentage of males in computer and mathematical occupations:
Here: 34.1% city: 32.5%
- Percentage of males in architecture and engineering occupations:
Here: 2.2% city: 4.9%
- Percentage of males in community and social services occupations:
Here: 1.5% city: 0.6%
- Percentage of males in education, training, and library occupations:
Here: 1.7% city: 2.3%
- Percentage of males in arts, design, entertainment, sports, and media occupations:
Here: 1.9% city: 1.8%
- Percentage of males in healthcare practitioners and technical occupations:
Here: 1.4% city: 3.9%
- Percentage of males in service occupations:
Here: 10.4% city: 6.2%
- Percentage of males in sales and office occupations:
Here: 6.2% city: 11.6%
- Percentage of males in construction, extraction, and maintenance occupations:
Here: 7.8% city: 2.2%
- Percentage of males in transportation occupations:
Here: 2.0% city: 1.5%
Occupations of females:
- Percentage of females in management occupations (except farmers):
Here: 19.4% city: 16.1%
- Percentage of females in business and financial operations occupations:
Here: 10.4% city: 10.5%
- Percentage of females in computer and mathematical occupations:
Here: 12.3% city: 13.9%
- Percentage of females in architecture and engineering occupations:
Here: 5.6% city: 2.1%
- Percentage of females in life, physical, and social science occupations:
Here: 2.9% city: 1.2%
- Percentage of females in community and social services occupations:
Here: 3.6% city: 1.7%
- Percentage of females in legal occupations:
Here: 1.3% city: 1.4%
- Percentage of females in education, training, and library occupations:
Here: 12.6% city: 7.5%
- Percentage of females in arts, design, entertainment, sports, and media occupations:
Here: 2.8% city: 3.2%
- Percentage of females in healthcare practitioners and technical occupations:
Here: 1.2% city: 8.3%
- Percentage of females in service occupations:
Here: 17.3% city: 12.4%
- Percentage of females in sales and office occupations:
Here: 6.5% city: 17.9%
- Percentage of females in production occupations:
Here: 1.3% city: 1.7%
- Percentage of females in material moving occupations:
Here: 2.7% city: 0.8%
Percentage of people 16-64 in Armed Forces:
| Surrey Downs: | 0.4% |
| Bellevue: | 0.1% |
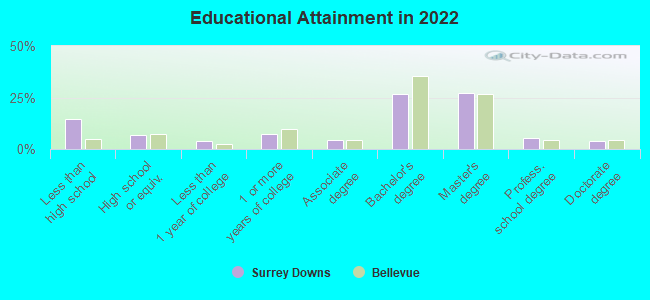
Education in this neighborhood (subdivision or community):
- Percentage of people 3 years and older in K-12 schools:
Surrey Downs: 14.2% Bellevue: 16.8%
- Percentage of people 3 years and older in undergraduate colleges:
Surrey Downs: 1.4% Bellevue: 3.2%
- Percentage of people 3 years and older in grad. or professional schools:
Surrey Downs: 2.7% Bellevue: 2.0%
- Percentage of students K-12 enrolled in private schools:
Surrey Downs: 12.1% Bellevue: 16.0%
Percentage of population below poverty level:
| Surrey Downs: | 2.0% |
| Bellevue: | 7.4% |
Median year owner moved in (as recorded in 2022):
Median year renter moved in (as recorded in 2022):
| Surrey Downs: | 2010 |
| Bellevue: | 2010 |
Median year renter moved in (as recorded in 2022):
| Surrey Downs: | 2019 |
| Bellevue: | 2021 |
Percentage of married-couple families with both working:
| Surrey Downs: | 64.0% |
| Bellevue: | 56.4% |
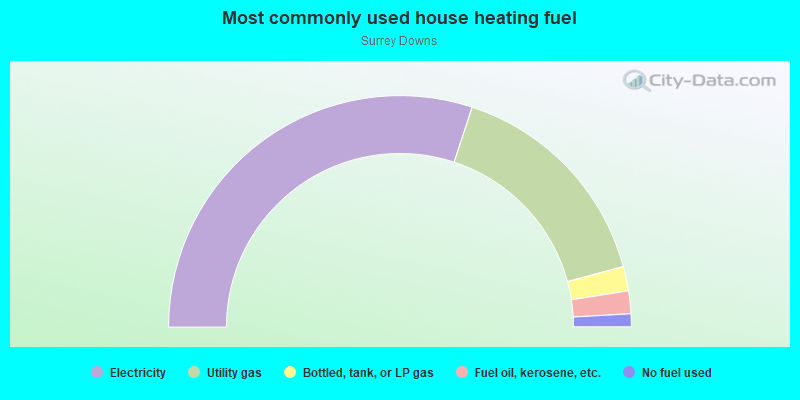
- 60.1%Electricity
- 31.5%Utility gas
- 3.4%Bottled, tank, or LP gas
- 3.2%Fuel oil, kerosene, etc.
- 1.8%No fuel used
Roads and streets:
109th Ave SE
Length: 0.68 miles
Directions: E-W, N-S, SE-NW, SW-NE
Address range: 100 to 1099
Directions: E-W, N-S, SE-NW, SW-NE
Address range: 100 to 1099
110th Ave SE
Length: 0.46 miles
Directions: N-S, SE-NW, SW-NE
Address range: 100 to 1099
Directions: N-S, SE-NW, SW-NE
Address range: 100 to 1099
112th Ave SE
Length: 0.32 miles
Directions: N-S, SW-NE
Address range: 100 to 399
Directions: N-S, SW-NE
Address range: 100 to 399
111th Ave SE
Length: 0.31 miles
Directions: N-S, SW-NE
Address range: 100 to 813
Directions: N-S, SW-NE
Address range: 100 to 813
SE 4th St
Length: 0.30 miles
Direction: E-W
Address range: 10900 to 11199
Direction: E-W
Address range: 10900 to 11199
111th Pl SE
Length: 0.24 miles
Directions: N-S, SE-NW, SW-NE
Address range: 809 to 11099
Directions: N-S, SE-NW, SW-NE
Address range: 809 to 11099
SE 9th St
Length: 0.22 miles
Directions: E-W, N-S
Address range: 10901 to 11199
Directions: E-W, N-S
Address range: 10901 to 11199
110th Pl SE
Length: 0.20 miles
Directions: E-W, N-S, SE-NW, SW-NE
Address range: 200 to 399
Directions: E-W, N-S, SE-NW, SW-NE
Address range: 200 to 399
SE 2nd St
Length: 0.14 miles
Direction: E-W
Address range: 11000 to 11099
Direction: E-W
Address range: 11000 to 11099
SE 3rd St
Length: 0.08 miles
Directions: E-W, N-S, SW-NE
Address range: 10900 to 11007
Directions: E-W, N-S, SW-NE
Address range: 10900 to 11007
SE 6th St
Length: 0.08 miles
Directions: E-W, SW-NE
Address range: 10900 to 10999
Directions: E-W, SW-NE
Address range: 10900 to 10999
SE 10th St
Length: 0.08 miles
Directions: E-W, N-S, SE-NW, SW-NE
Address range: 11000 to 11199
Directions: E-W, N-S, SE-NW, SW-NE
Address range: 11000 to 11199
SE 1st Pl
Length: 0.07 miles
Directions: E-W, SW-NE
Address range: 11100 to 11199
Directions: E-W, SW-NE
Address range: 11100 to 11199
SE 1st St
Length: 0.06 miles
Direction: E-W
Address range: 10900 to 10999
Direction: E-W
Address range: 10900 to 10999
SE 10th Pl
Length: 0.05 miles
Directions: E-W, SE-NW
Address range: 10900 to 11099
Directions: E-W, SE-NW
Address range: 10900 to 11099