Tappan Manor neighborhood in Tarrytown, New York (NY), 10591 detailed profile
Settings
X


Business Search - 14 Million verified businesses
Area: 0.031 square miles
Population: 411
Population density:
| Tappan Manor: | 13,125 people per square mile |
| Tarrytown: | 3,955 people per square mile |

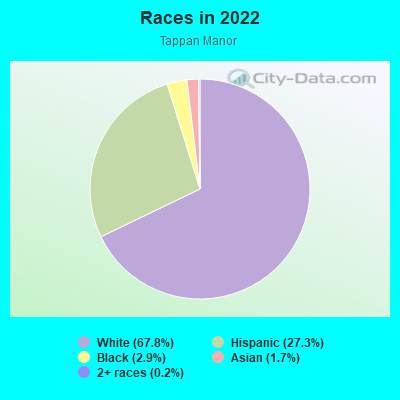
- 27867.8%White
- 11227.3%Hispanic or Latino
- 122.9%Black
- 71.7%Asian
- 10.2%Two or more races
Median household income in 2022:
| Tappan Manor: | $87,053 |
| Tarrytown: | $109,945 |
Distribution of median household income
![Distribution of median household income]()
- 1Less than $10,000
- 18$10,000 to $19,999
- 14$20,000 to $29,999
- 3$30,000 to $39,999
- 12$40,000 to $49,999
- 80$50,000 to $59,999
- 8$60,000 to $74,999
- 13$75,000 to $99,999
- 24$100,000 to $124,999
- 1$125,000 to $149,999
- 23$150,000 to $199,999
- 11$200,000 or more

Distribution of owner-occupied house/condo value
![Distribution of owner-occupied house/condo value]()
- 1$50,000 to $99,999
- 2$100,000 to $149,999
- 10$150,000 to $199,999
- 1$200,000 to $249,999
- 12$250,000 to $299,999
- 7$300,000 to $399,999
- 9$400,000 to $499,999
- 3$500,000 to $749,999
- 9$750,000 to $999,999
- 21$1,000,000 or more

Distribution of rent paid by renters
![Distribution of rent paid by renters]()
- 1$300 to $399
- 8$400 to $499
- 2$500 to $599
- 2$600 to $699
- 1$800 to $899
- 7$900 to $999
- 10$1,000 to $1,249
- 56$1,250 to $1,499
- 18$1,500 to $1,999
- 54$2,000 or more

Median rent in 2022:
| Tappan Manor: | $1,692 |
| Tarrytown: | $1,776 |
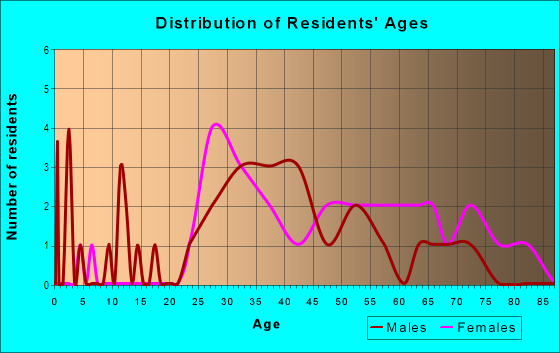
| Males: | 199 |
| Females: | 211 |
Males:
| This neighborhood: | 50.1 years |
| Whole city: | 38.8 years |
| This neighborhood: | 52.1 years |
| Whole city: | 47.0 years |
Average household size:
| Tappan Manor: | 1.9 people |
| Tarrytown: | 2.3 people |
Percentage of family households:
| Tappan Manor: | 28.1% |
| Tarrytown: | 41.6% |
| Here: | 34.8% |
| Tarrytown: | 47.3% |
Percentage of married-couple families with children (among all households):
| Tappan Manor: | 42.9% |
| Tarrytown: | 40.1% |
Percentage of single-mother households (among all households):
| Tappan Manor: | 6.4% |
| Tarrytown: | 1.7% |
Percentage of never married males 15 years old and over:
Percentage of never married females 15 years old and over:
| Tappan Manor: | 30.9% |
| Tarrytown: | 19.3% |
Percentage of never married females 15 years old and over:
| Tappan Manor: | 29.0% |
| village: | 14.4% |
Percentage of people that speak English not well or not at all:
| Tappan Manor: | 0.3% |
| Tarrytown: | 1.4% |
Percentage of people born in this state:
Percentage of people born in another U.S. state:
Percentage of native residents but born outside the U.S.:
Percentage of foreign born residents:
| Here: | 61.1% |
| Tarrytown: | 59.7% |
Percentage of people born in another U.S. state:
| Tappan Manor: | 15.4% |
| Tarrytown: | 14.8% |
Percentage of native residents but born outside the U.S.:
| Here: | 0.0% |
| village: | 0.9% |
Percentage of foreign born residents:
| Here: | 23.4% |
| Tarrytown: | 24.6% |
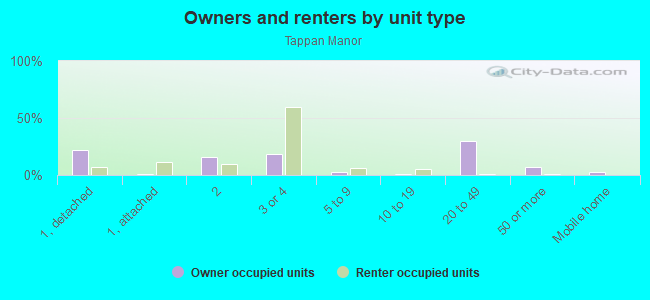
Owner-occupied
Renter-occupied

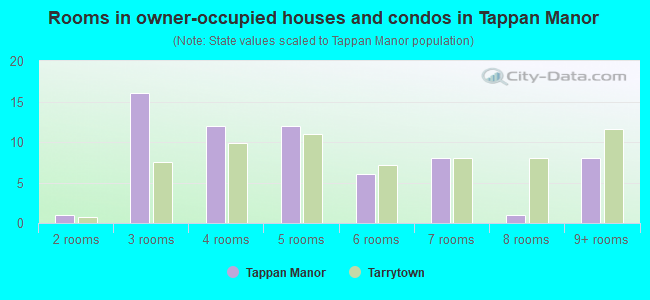
- Rooms in owner-occupied houses and condos in Tappan Manor
- 01 room
- 12 rooms
- 163 rooms
- 124 rooms
- 125 rooms
- 66 rooms
- 87 rooms
- 18 rooms
- 89+ rooms
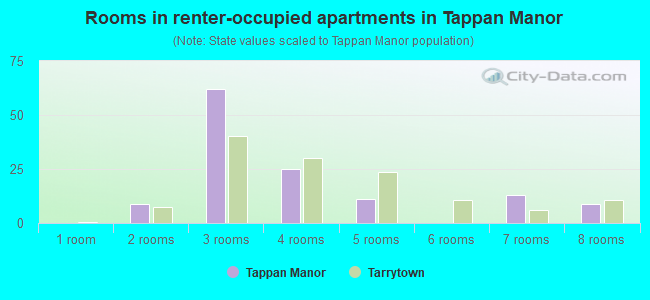
- Rooms in renter-occupied apartments in Tappan Manor
- 01 room
- 92 rooms
- 623 rooms
- 254 rooms
- 115 rooms
- 06 rooms
- 137 rooms
- 98 rooms
- 09+ rooms
Owner-occupied
Renter-occupied
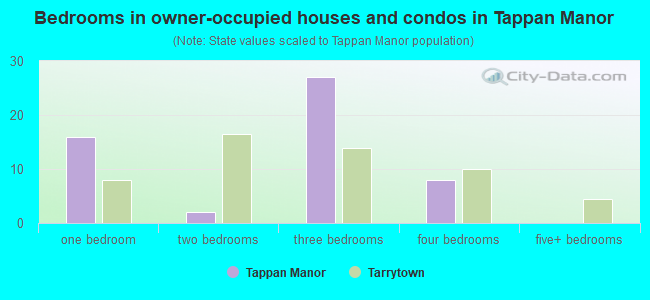
- Bedrooms in owner-occupied houses and condos in Tappan Manor
- 0no bedroom
- 161 bedroom
- 22 bedrooms
- 273 bedrooms
- 84 bedrooms
- 05+ bedrooms
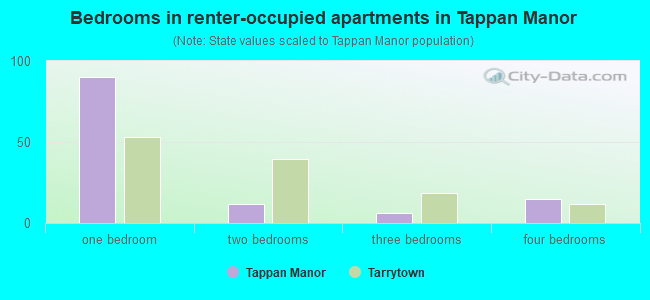
- Bedrooms in renter-occupied apartments in Tappan Manor
- 0no bedroom
- 901 bedroom
- 122 bedrooms
- 63 bedrooms
- 154 bedrooms
- 05+ bedrooms
Average number of cars or other vehicles available in houses/condos:
Average number of cars or other vehicles available in apartments:
| This neighborhood: | 1.6 |
| Tarrytown: | 1.7 |
Average number of cars or other vehicles available in apartments:
| Here: | 1.9 |
| village: | 1.5 |
Percentage of units with a mortgage:
| Tappan Manor: | 55.0% |
| Tarrytown: | 55.1% |
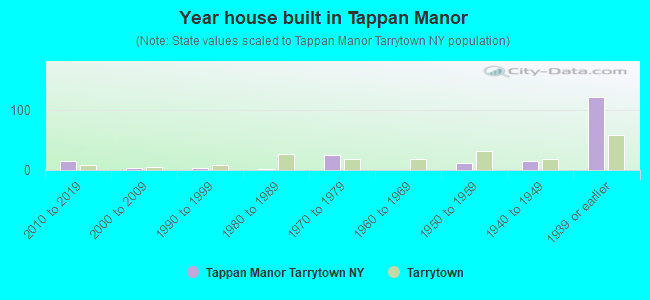
- Year house built in Tappan Manor
- 02020 or later
- 152010 to 2019
- 32000 to 2009
- 31990 to 1999
- 21980 to 1989
- 261970 to 1979
- 01960 to 1969
- 111950 to 1959
- 151940 to 1949
- 1221939 or earlier
City-data.com crime index for village in 2020 (higher means more crime):
| City: | 58.1 |
| U.S. average: | 219.5 |
Travel time to work (commute)
![Travel time to work (commute)]()
- 8Less than 5 minutes
- 195 to 9 minutes
- 1610 to 14 minutes
- 2815 to 19 minutes
- 3020 to 24 minutes
- 225 to 29 minutes
- 3630 to 34 minutes
- 235 to 39 minutes
- 140 to 44 minutes
- 4645 to 59 minutes
- 1960 to 89 minutes
- 1690 or more minutes

Means of transportation to work
![Means of transportation to work]()
- 68.4%173Drove a car alone
- 5.9%15Carpooled
- 2.4%6Bus
- 7.5%19Subway or elevated rail
- 14.6%37Long-distance train or commuter rail
- 0.8%2Bicycle
- 0.4%1Walked
- 0.8%2Worked at home

Time leaving home to go to work
![Time leaving home to go to work]()
- 312:00 a.m. to 4:59 a.m.
- 25:30 a.m. to 5:59 a.m.
- 116:00 a.m. to 6:29 a.m.
- 126:30 a.m. to 6:59 a.m.
- 157:00 a.m. to 7:29 a.m.
- 217:30 a.m. to 7:59 a.m.
- 458:00 a.m. to 8:29 a.m.
- 368:30 a.m. to 8:59 a.m.
- 309:00 a.m. to 9:59 a.m.
- 1310:00 a.m. to 10:59 a.m.
- 1212:00 p.m. to 3:59 p.m.

Occupations of males:
- Percentage of males in management occupations (except farmers):
Here: 44.0% village: 20.5%
- Percentage of males in business and financial operations occupations:
Here: 13.1% village: 13.7%
- Percentage of males in computer and mathematical occupations:
Here: 12.7% village: 10.1%
- Percentage of males in life, physical, and social science occupations:
Here: 2.0% village: 2.5%
- Percentage of males in legal occupations:
Here: 5.0% village: 3.7%
- Percentage of males in arts, design, entertainment, sports, and media occupations:
Here: 4.8% village: 7.8%
- Percentage of males in service occupations:
Here: 5.7% village: 16.9%
- Percentage of males in sales and office occupations:
Here: 18.5% village: 10.6%
- Percentage of males in construction, extraction, and maintenance occupations:
Here: 5.5% village: 2.0%
- Percentage of males in production occupations:
Here: 8.5% village: 2.3%
Occupations of females:
- Percentage of females in management occupations (except farmers):
Here: 10.0% village: 10.4%
- Percentage of females in computer and mathematical occupations:
Here: 2.1% village: 5.0%
- Percentage of females in life, physical, and social science occupations:
Here: 2.4% village: 2.9%
- Percentage of females in community and social services occupations:
Here: 2.3% village: 1.9%
- Percentage of females in arts, design, entertainment, sports, and media occupations:
Here: 12.8% village: 10.4%
- Percentage of females in service occupations:
Here: 64.1% village: 12.9%
- Percentage of females in sales and office occupations:
Here: 25.6% village: 21.7%
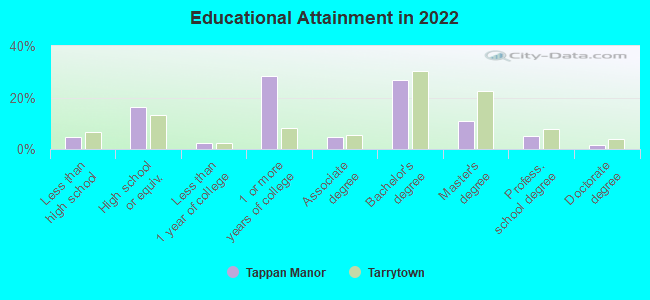
Education in this neighborhood (subdivision or community):
- Percentage of people 3 years and older in K-12 schools:
Tappan Manor: 5.4% Tarrytown: 11.4%
- Percentage of people 3 years and older in undergraduate colleges:
Tappan Manor: 1.2% Tarrytown: 2.9%
- Percentage of people 3 years and older in grad. or professional schools:
Tappan Manor: 17.6% Tarrytown: 3.0%
- Percentage of students K-12 enrolled in private schools:
Tappan Manor: 0.0% Tarrytown: 12.0%
Percentage of population below poverty level:
| Tappan Manor: | 8.1% |
| Tarrytown: | 6.1% |
Median year owner moved in (as recorded in 2022):
Median year renter moved in (as recorded in 2022):
| Tappan Manor: | 2008 |
| Tarrytown: | 2005 |
Median year renter moved in (as recorded in 2022):
| Tappan Manor: | 2014 |
| Tarrytown: | 2014 |
Percentage of married-couple families with both working:
| Tappan Manor: | 76.6% |
| Tarrytown: | 75.8% |
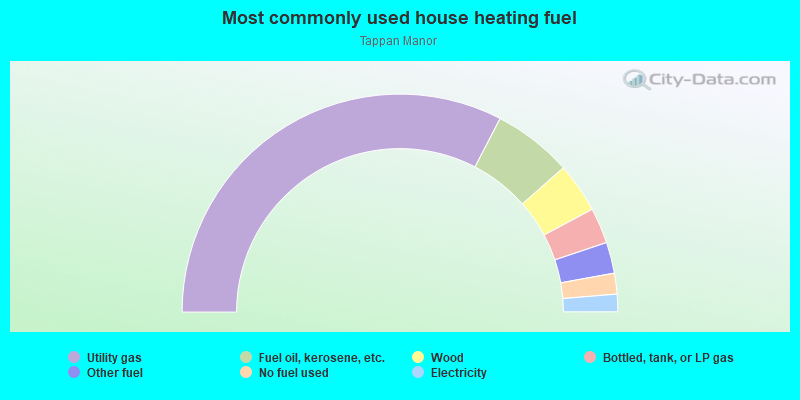
- 65.2%Utility gas
- 11.8%Fuel oil, kerosene, etc.
- 7.4%Wood
- 5.3%Bottled, tank, or LP gas
- 4.6%Other fuel
- 3.1%No fuel used
- 2.6%Electricity
Highways in this neighborhood:
S Broadway (US Hwy 9)
Length: 0.19 miles
Direction: N-S
Address range: 301 to 398
Direction: N-S
Address range: 301 to 398
State Hwy 119 (White Plains Rd)
Length: 0.12 miles
Direction: E-W
Address range: 1 to 96
Direction: E-W
Address range: 1 to 96