The Lane neighborhood in Lexington, Kentucky (KY), 40504 detailed profile
Settings
X


Area: 0.087 square miles
Population: 380
Population density: 4,346 people per square mile

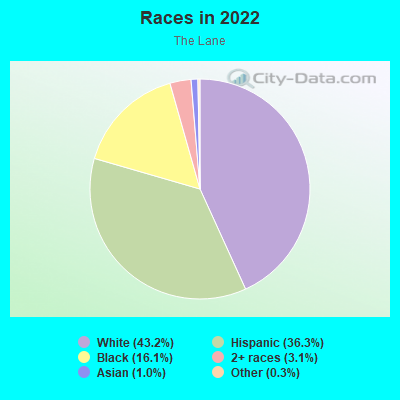
- 16943.2%White
- 14236.3%Hispanic or Latino
- 6316.1%Black
- 123.1%Two or more races
- 41.0%Asian
- 10.3%Some other race
Median household income in 2022:
| The Lane: | $47,224 |
| Kentucky: | $59,341 |
Distribution of median household income
![Distribution of median household income]()
- 14Less than $10,000
- 38$10,000 to $19,999
- 23$20,000 to $29,999
- 20$30,000 to $39,999
- 10$40,000 to $49,999
- 9$50,000 to $59,999
- 31$60,000 to $74,999
- 40$75,000 to $99,999
- 3$100,000 to $124,999
- 20$125,000 to $149,999
- 2$150,000 to $199,999
- 2$200,000 or more

Distribution of owner-occupied house/condo value
![Distribution of owner-occupied house/condo value]()
- 2Less than $50,000
- 7$50,000 to $99,999
- 3$100,000 to $149,999
- 4$150,000 to $199,999
- 33$200,000 to $249,999
- 8$250,000 to $299,999
- 5$300,000 to $399,999
- 2$400,000 to $499,999
- 1$500,000 to $749,999
- 3$750,000 to $999,999

Distribution of rent paid by renters
![Distribution of rent paid by renters]()
- 1Less than $100
- 5$100 to $199
- 3$200 to $299
- 4$300 to $399
- 79$400 to $499
- 2$500 to $599
- 46$600 to $699
- 53$700 to $799
- 20$800 to $899
- 5$900 to $999
- 32$1,000 to $1,249
- 10$1,250 to $1,499
- 6$1,500 to $1,999
- 8$2,000 or more

Median rent in 2022:
| The Lane: | $733 |
| Kentucky: | $702 |
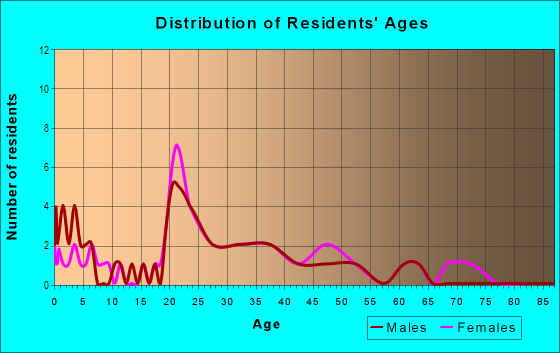
| Males: | 204 |
| Females: | 175 |
| Males: | 27.7 years |
| Females: | 28.6 years |
Average household size:
| The Lane: | 2.2 people |
| Kentucky: | 2.4 people |
Percentage of family households:
| The Lane: | 54.2% |
| Kentucky: | 45.9% |
| Here: | 13.6% |
| Kentucky: | 47.1% |
Percentage of married-couple families with children (among all households):
| The Lane: | 6.8% |
| Kentucky: | 58.4% |
Percentage of single-mother households (among all households):
| The Lane: | 29.7% |
| Kentucky: | 9.3% |
Percentage of never married males 15 years old and over:
Percentage of never married females 15 years old and over:
| The Lane: | 28.1% |
| Kentucky: | 16.3% |
Percentage of never married females 15 years old and over:
| The Lane: | 18.9% |
| Kentucky: | 13.5% |
Percentage of people that speak English not well or not at all:
| The Lane: | 16.6% |
| Kentucky: | 1.1% |
Percentage of people born in this state:
Percentage of people born in another U.S. state:
Percentage of native residents but born outside the U.S.:
Percentage of foreign born residents:
| Here: | 57.0% |
| Kentucky: | 67.2% |
Percentage of people born in another U.S. state:
| The Lane: | 31.5% |
| Kentucky: | 28.0% |
Percentage of native residents but born outside the U.S.:
| Here: | 1.9% |
| Kentucky: | 0.8% |
Percentage of foreign born residents:
| Here: | 11.4% |
| Kentucky: | 4.0% |
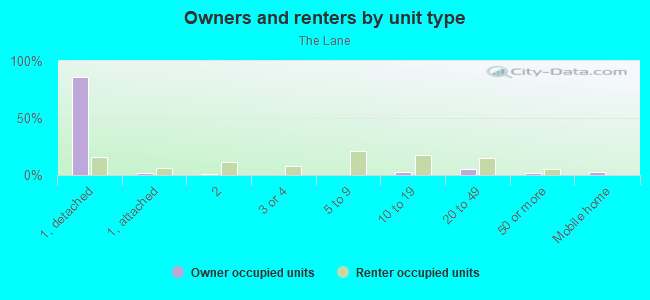
Owner-occupied
Renter-occupied

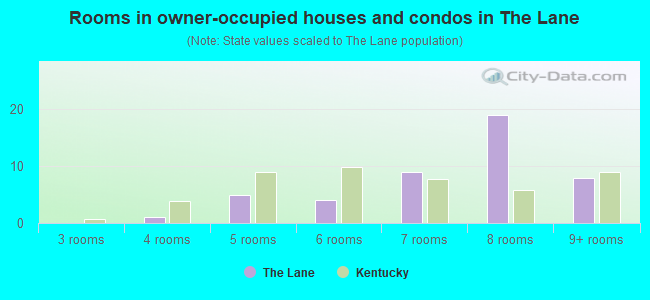
- Rooms in owner-occupied houses and condos in The Lane
- 01 room
- 02 rooms
- 03 rooms
- 14 rooms
- 55 rooms
- 46 rooms
- 97 rooms
- 198 rooms
- 89+ rooms
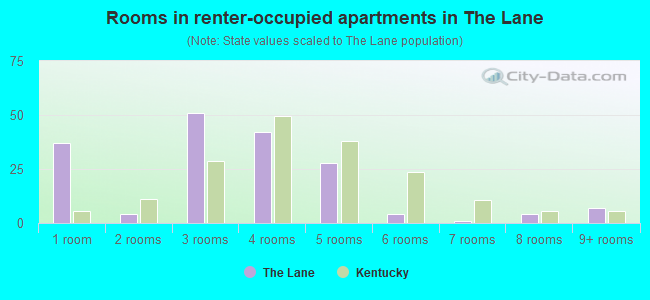
- Rooms in renter-occupied apartments in The Lane
- 371 room
- 42 rooms
- 513 rooms
- 424 rooms
- 285 rooms
- 46 rooms
- 17 rooms
- 48 rooms
- 79+ rooms
Owner-occupied
Renter-occupied
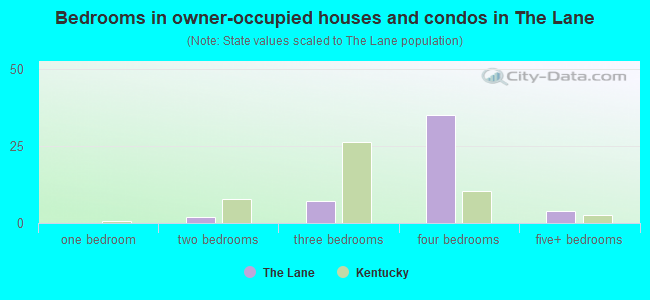
- Bedrooms in owner-occupied houses and condos in The Lane
- 0no bedroom
- 01 bedroom
- 22 bedrooms
- 73 bedrooms
- 354 bedrooms
- 45+ bedrooms
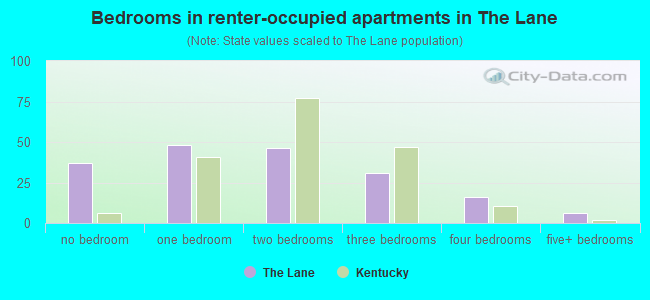
- Bedrooms in renter-occupied apartments in The Lane
- 37no bedroom
- 481 bedroom
- 462 bedrooms
- 313 bedrooms
- 164 bedrooms
- 65+ bedrooms
Average number of cars or other vehicles available in houses/condos:
Average number of cars or other vehicles available in apartments:
| This neighborhood: | 2.0 |
| Kentucky: | 2.1 |
Average number of cars or other vehicles available in apartments:
| Here: | 1.3 |
| Kentucky: | 1.3 |
Percentage of units with a mortgage:
| The Lane: | 51.3% |
| Kentucky: | 56.7% |
Average estimated value of detached houses in 2022 (39.3% of all units):
| The Lane: | $227,158 |
| Kentucky: | $256,452 |
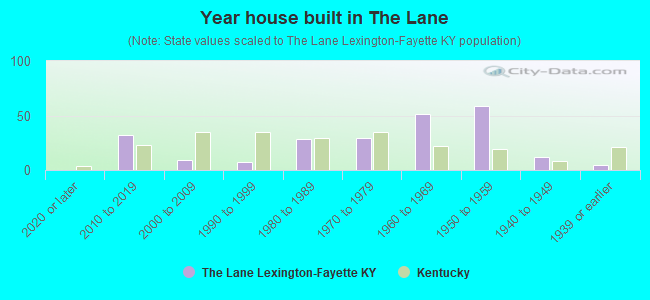
- Year house built in The Lane
- 02020 or later
- 322010 to 2019
- 92000 to 2009
- 71990 to 1999
- 281980 to 1989
- 291970 to 1979
- 511960 to 1969
- 591950 to 1959
- 121940 to 1949
- 51939 or earlier
Travel time to work (commute)
![Travel time to work (commute)]()
- 3Less than 5 minutes
- 245 to 9 minutes
- 3710 to 14 minutes
- 3215 to 19 minutes
- 1820 to 24 minutes
- 525 to 29 minutes
- 1030 to 34 minutes
- 135 to 39 minutes
- 240 to 44 minutes
- 1145 to 59 minutes
- 160 to 89 minutes

Means of transportation to work
![Means of transportation to work]()
- 75.3%163Drove a car alone
- 21.7%47Carpooled
- 3.7%8Bus
- 0.9%2Bicycle
- 5.1%11Walked
- 2.3%5Worked at home

Time leaving home to go to work
![Time leaving home to go to work]()
- 412:00 a.m. to 4:59 a.m.
- 105:30 a.m. to 5:59 a.m.
- 26:00 a.m. to 6:29 a.m.
- 126:30 a.m. to 6:59 a.m.
- 147:00 a.m. to 7:29 a.m.
- 247:30 a.m. to 7:59 a.m.
- 248:00 a.m. to 8:29 a.m.
- 48:30 a.m. to 8:59 a.m.
- 159:00 a.m. to 9:59 a.m.
- 210:00 a.m. to 10:59 a.m.
- 211:00 a.m. to 11:59 a.m.
- 912:00 p.m. to 3:59 p.m.
- 74:00 p.m. to 11:59 p.m.

Occupations of males:
- Percentage of males in legal occupations:
Here: 3.5% Kentucky: 0.8%
- Percentage of males in service occupations:
Here: 21.7% Kentucky: 12.5%
- Percentage of males in sales and office occupations:
Here: 4.5% Kentucky: 14.0%
- Percentage of males in farming, fishing, and forestry occupations:
Here: 27.2% Kentucky: 0.8%
- Percentage of males in construction, extraction, and maintenance occupations:
Here: 14.1% Kentucky: 8.7%
- Percentage of males in transportation occupations:
Here: 1.8% Kentucky: 6.7%
Occupations of females:
- Percentage of females in management occupations (except farmers):
Here: 6.3% Kentucky: 8.4%
- Percentage of females in life, physical, and social science occupations:
Here: 28.3% Kentucky: 0.8%
- Percentage of females in community and social services occupations:
Here: 1.5% Kentucky: 2.8%
- Percentage of females in legal occupations:
Here: 4.0% Kentucky: 1.1%
- Percentage of females in education, training, and library occupations:
Here: 15.6% Kentucky: 9.3%
- Percentage of females in arts, design, entertainment, sports, and media occupations:
Here: 6.3% Kentucky: 1.5%
- Percentage of females in service occupations:
Here: 32.8% Kentucky: 19.1%
- Percentage of females in sales and office occupations:
Here: 1.5% Kentucky: 27.8%
- Percentage of females in material moving occupations:
Here: 8.7% Kentucky: 3.2%
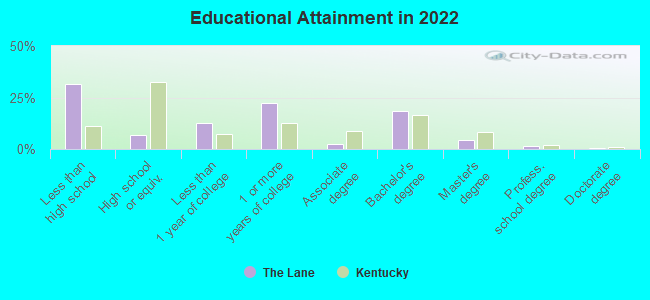
Education in this neighborhood (subdivision or community):
- Percentage of people 3 years and older in K-12 schools:
The Lane: 10.4% Kentucky: 16.5%
- Percentage of people 3 years and older in undergraduate colleges:
The Lane: 12.1% Kentucky: 4.1%
- Percentage of people 3 years and older in grad. or professional schools:
The Lane: 6.0% Kentucky: 1.3%
- Percentage of students K-12 enrolled in private schools:
The Lane: 7.9% Kentucky: 16.3%
Percentage of population below poverty level:
| The Lane: | 7.1% |
| Kentucky: | 16.5% |
Median year renter moved in (as recorded in 2022):
| The Lane: | 2018 |
| Kentucky: | 2020 |
Percentage of married-couple families with both working:
| The Lane: | 104.0% |
| Kentucky: | 70.7% |
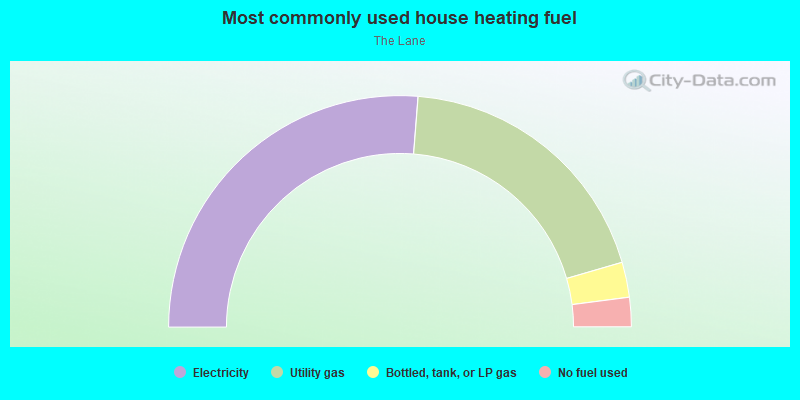
- 52.5%Electricity
- 38.5%Utility gas
- 4.9%Bottled, tank, or LP gas
- 4.1%No fuel used
Roads and streets:
The Lane
Length: 0.56 miles
Direction: E-W
Address range: 1000 to 1199
Direction: E-W
Address range: 1000 to 1199
Mason Headley Rd
Length: 0.04 miles
Direction: SE-NW
Address range: 963 to 999
Direction: SE-NW
Address range: 963 to 999