The Villas neighborhood in San Jose, California (CA), 95128 detailed profile
Settings
X


Business Search - 14 Million verified businesses
Area: 0.076 square miles
Population: 80
Population density:
| The Villas: | 1,059 people per square mile |
| San Jose: | 5,554 people per square mile |

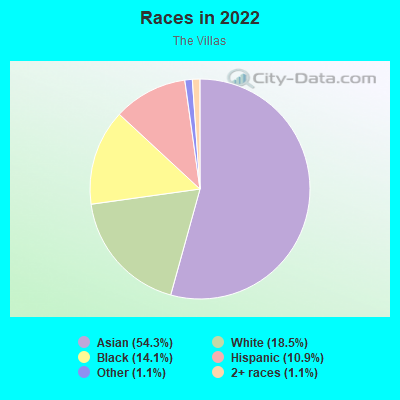
- 5054.3%Asian
- 1718.5%White
- 1314.1%Black
- 1010.9%Hispanic or Latino
- 11.1%Some other race
- 11.1%Two or more races
Median household income in 2022:
| The Villas: | $202,235 |
| San Jose: | $133,835 |
Distribution of median household income
![Distribution of median household income]()
- 3Less than $10,000
- 10$10,000 to $19,999
- 10$20,000 to $29,999
- 7$30,000 to $39,999
- 3$40,000 to $49,999
- 1$50,000 to $59,999
- 21$60,000 to $74,999
- 9$75,000 to $99,999
- 4$100,000 to $124,999
- 13$125,000 to $149,999
- 2$150,000 to $199,999
- 24$200,000 or more

Distribution of owner-occupied house/condo value
![Distribution of owner-occupied house/condo value]()
- 3$100,000 to $149,999
- 1$500,000 to $749,999
- 11$750,000 to $999,999
- 45$1,000,000 or more

Distribution of rent paid by renters
![Distribution of rent paid by renters]()
- 2$300 to $399
- 2$400 to $499
- 4$500 to $599
- 14$1,250 to $1,499
- 4$1,500 to $1,999
- 38$2,000 or more

Median rent in 2022:
| The Villas: | $3,464 |
| San Jose: | $2,001 |
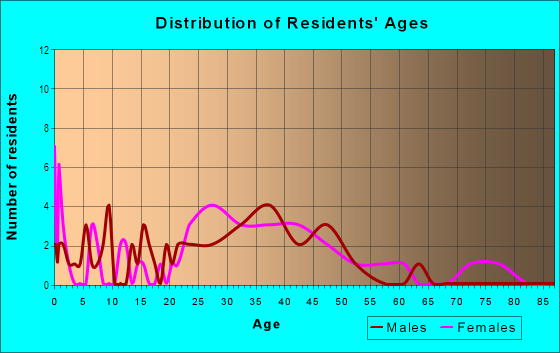
| Males: | 37 |
| Females: | 43 |
Males:
| This neighborhood: | 31.5 years |
| Whole city: | 37.6 years |
| This neighborhood: | 27.5 years |
| Whole city: | 39.1 years |
Average household size:
| The Villas: | 2.1 people |
| San Jose: | 2.9 people |
Percentage of family households:
| The Villas: | 66.7% |
| San Jose: | 49.9% |
| Here: | 56.5% |
| San Jose: | 53.0% |
Percentage of married-couple families with children (among all households):
| The Villas: | 378.2% |
| San Jose: | 25.8% |
Percentage of single-mother households (among all households):
| The Villas: | 14.8% |
| San Jose: | 5.2% |
Percentage of never married males 15 years old and over:
Percentage of never married females 15 years old and over:
| The Villas: | 7.8% |
| San Jose: | 20.9% |
Percentage of never married females 15 years old and over:
| The Villas: | 15.0% |
| city: | 16.7% |
Percentage of people that speak English not well or not at all:
| The Villas: | 39.7% |
| San Jose: | 11.4% |
Percentage of people born in this state:
Percentage of people born in another U.S. state:
Percentage of native residents but born outside the U.S.:
Percentage of foreign born residents:
| Here: | 49.9% |
| San Jose: | 46.1% |
Percentage of people born in another U.S. state:
| The Villas: | 11.6% |
| San Jose: | 10.4% |
Percentage of native residents but born outside the U.S.:
| Here: | 2.0% |
| city: | 1.7% |
Percentage of foreign born residents:
| Here: | 36.5% |
| San Jose: | 41.8% |
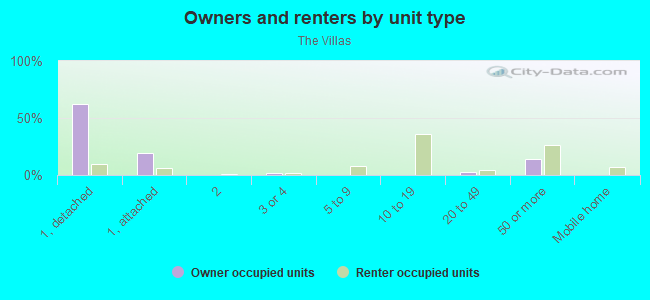
Owner-occupied
Renter-occupied

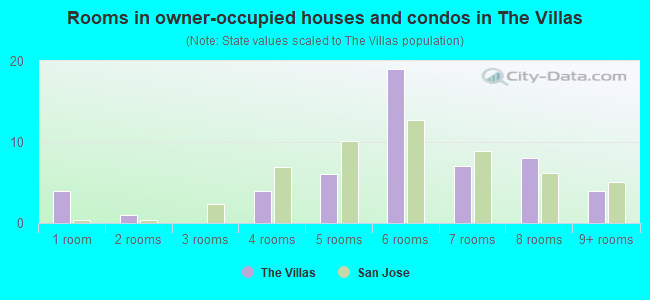
- Rooms in owner-occupied houses and condos in The Villas
- 41 room
- 12 rooms
- 03 rooms
- 44 rooms
- 65 rooms
- 196 rooms
- 77 rooms
- 88 rooms
- 49+ rooms
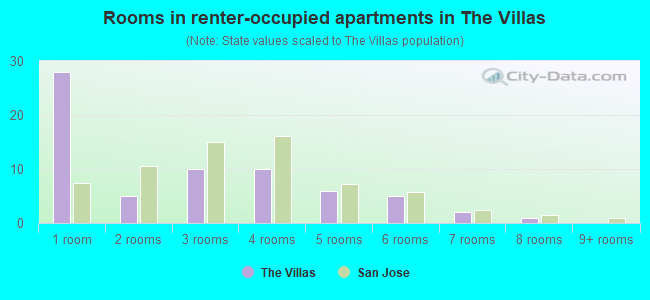
- Rooms in renter-occupied apartments in The Villas
- 281 room
- 52 rooms
- 103 rooms
- 104 rooms
- 65 rooms
- 56 rooms
- 27 rooms
- 18 rooms
- 09+ rooms
Owner-occupied
Renter-occupied
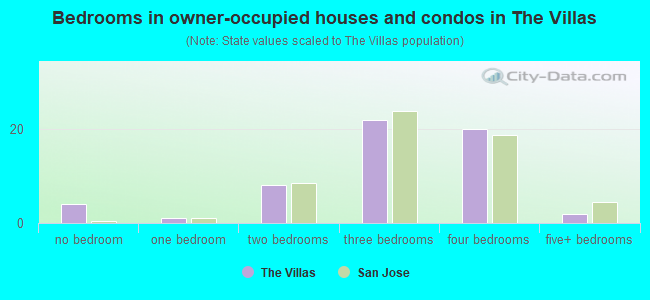
- Bedrooms in owner-occupied houses and condos in The Villas
- 4no bedroom
- 11 bedroom
- 82 bedrooms
- 223 bedrooms
- 204 bedrooms
- 25+ bedrooms
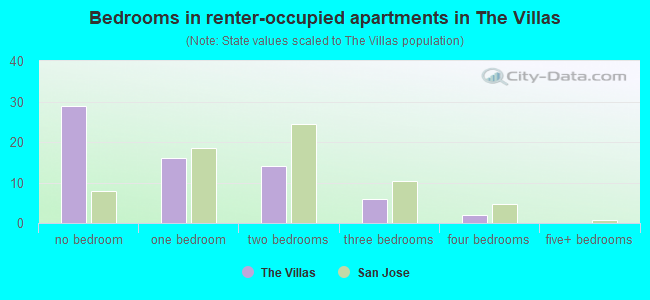
- Bedrooms in renter-occupied apartments in The Villas
- 29no bedroom
- 161 bedroom
- 142 bedrooms
- 63 bedrooms
- 24 bedrooms
- 05+ bedrooms
Average number of cars or other vehicles available in houses/condos:
Average number of cars or other vehicles available in apartments:
| This neighborhood: | |
| San Jose: |
Average number of cars or other vehicles available in apartments:
| Here: | 1.4 |
| city: | 1.6 |
Percentage of units with a mortgage:
| The Villas: | 64.9% |
| San Jose: | 66.9% |
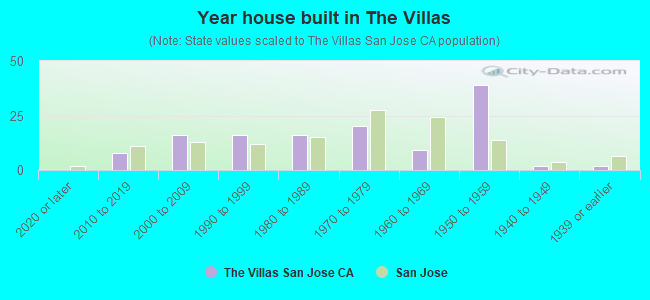
- Year house built in The Villas
- 02020 or later
- 82010 to 2019
- 162000 to 2009
- 161990 to 1999
- 161980 to 1989
- 201970 to 1979
- 91960 to 1969
- 391950 to 1959
- 21940 to 1949
- 21939 or earlier
City-data.com crime index for city in 2020 (higher means more crime):
| City: | 268.4 |
| U.S. average: | 219.5 |
Travel time to work (commute)
![Travel time to work (commute)]()
- 5Less than 5 minutes
- 135 to 9 minutes
- 2210 to 14 minutes
- 3515 to 19 minutes
- 4720 to 24 minutes
- 425 to 29 minutes
- 3630 to 34 minutes
- 535 to 39 minutes
- 1240 to 44 minutes
- 1745 to 59 minutes
- 460 to 89 minutes
- 1290 or more minutes

Means of transportation to work
![Means of transportation to work]()
- 60.0%29Drove a car alone
- 14.5%7Carpooled
- 18.6%9Bus
- 2.1%1Long-distance train or commuter rail
- 2.1%1Light rail, streetcar or trolley
- 10.3%5Bicycle
- 10.3%5Walked
- 12.4%6Other means
- 22.8%11Worked at home

Time leaving home to go to work
![Time leaving home to go to work]()
- 112:00 a.m. to 4:59 a.m.
- 65:00 a.m. to 5:29 a.m.
- 85:30 a.m. to 5:59 a.m.
- 216:00 a.m. to 6:29 a.m.
- 26:30 a.m. to 6:59 a.m.
- 267:00 a.m. to 7:29 a.m.
- 447:30 a.m. to 7:59 a.m.
- 238:00 a.m. to 8:29 a.m.
- 228:30 a.m. to 8:59 a.m.
- 319:00 a.m. to 9:59 a.m.
- 310:00 a.m. to 10:59 a.m.
- 411:00 a.m. to 11:59 a.m.
- 812:00 p.m. to 3:59 p.m.
- 144:00 p.m. to 11:59 p.m.

Occupations of males:
- Percentage of males in management occupations (except farmers):
Here: 42.1% city: 13.0%
- Percentage of males in business and financial operations occupations:
Here: 21.3% city: 4.6%
- Percentage of males in computer and mathematical occupations:
Here: 15.8% city: 13.6%
- Percentage of males in architecture and engineering occupations:
Here: 12.0% city: 10.2%
- Percentage of males in life, physical, and social science occupations:
Here: 2.5% city: 1.1%
- Percentage of males in community and social services occupations:
Here: 3.6% city: 0.8%
- Percentage of males in legal occupations:
Here: 18.6% city: 0.8%
- Percentage of males in education, training, and library occupations:
Here: 6.1% city: 2.8%
- Percentage of males in arts, design, entertainment, sports, and media occupations:
Here: 6.0% city: 1.8%
- Percentage of males in healthcare practitioners and technical occupations:
Here: 2.7% city: 2.0%
- Percentage of males in service occupations:
Here: 78.7% city: 12.7%
- Percentage of males in sales and office occupations:
Here: 75.5% city: 12.8%
- Percentage of males in construction, extraction, and maintenance occupations:
Here: 37.2% city: 7.8%
- Percentage of males in production occupations:
Here: 12.2% city: 5.5%
- Percentage of males in transportation occupations:
Here: 15.0% city: 3.6%
- Percentage of males in material moving occupations:
Here: 2.1% city: 3.1%
Occupations of females:
- Percentage of females in management occupations (except farmers):
Here: 73.6% city: 11.0%
- Percentage of females in business and financial operations occupations:
Here: 23.4% city: 8.6%
- Percentage of females in computer and mathematical occupations:
Here: 37.0% city: 5.4%
- Percentage of females in architecture and engineering occupations:
Here: 22.1% city: 2.8%
- Percentage of females in life, physical, and social science occupations:
Here: 7.7% city: 1.7%
- Percentage of females in community and social services occupations:
Here: 7.6% city: 1.8%
- Percentage of females in education, training, and library occupations:
Here: 43.8% city: 8.1%
- Percentage of females in healthcare practitioners and technical occupations:
Here: 2.8% city: 6.8%
- Percentage of females in service occupations:
Here: 70.9% city: 21.7%
- Percentage of females in sales and office occupations:
Here: 44.1% city: 22.0%
- Percentage of females in production occupations:
Here: 34.8% city: 4.0%
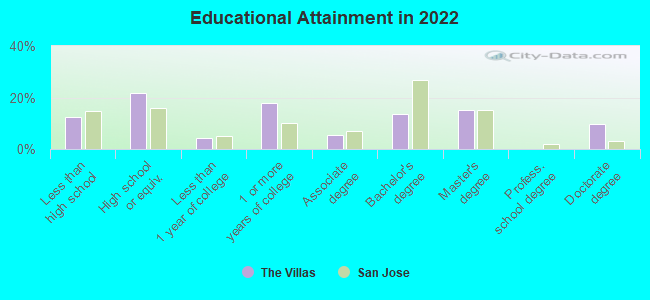
Education in this neighborhood (subdivision or community):
- Percentage of people 3 years and older in K-12 schools:
The Villas: 56.2% San Jose: 16.1%
- Percentage of people 3 years and older in undergraduate colleges:
The Villas: 12.5% San Jose: 6.5%
- Percentage of people 3 years and older in grad. or professional schools:
The Villas: 1.2% San Jose: 2.0%
- Percentage of students K-12 enrolled in private schools:
The Villas: 44.4% San Jose: 14.9%
Percentage of population below poverty level:
| The Villas: | 7.1% |
| San Jose: | 9.0% |
Median year renter moved in (as recorded in 2022):
| The Villas: | 2018 |
| San Jose: | 2020 |
Percentage of married-couple families with both working:
| The Villas: | 72.1% |
| San Jose: | 72.5% |
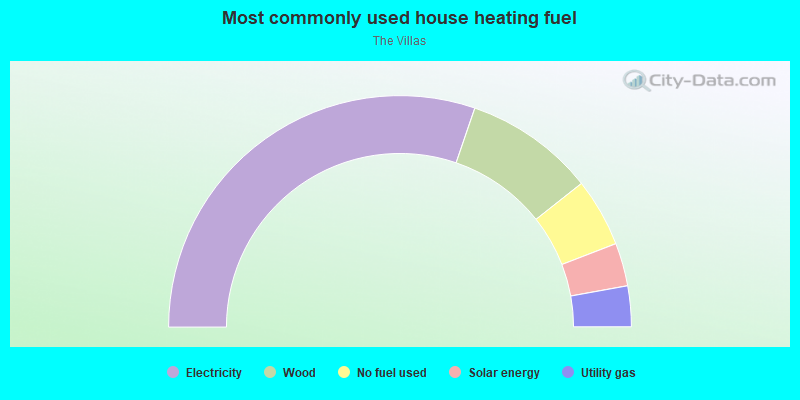
- 60.5%Electricity
- 18.2%Wood
- 9.6%No fuel used
- 6.0%Solar energy
- 5.7%Utility gas
Roads and streets:
Villa Centre Way
Length: 0.32 miles
Directions: E-W, N-S, SE-NW, SW-NE
Address range: 500 to 799
Directions: E-W, N-S, SE-NW, SW-NE
Address range: 500 to 799
Scott St
Length: 0.15 miles
Direction: E-W
Address range: 2651 to 2799
Direction: E-W
Address range: 2651 to 2799
S Genevieve Ln
Length: 0.11 miles
Direction: N-S
Address range: 460 to 599
Direction: N-S
Address range: 460 to 599
S Monroe St
Length: 0.11 miles
Direction: N-S
Address range: 400 to 463
Direction: N-S
Address range: 400 to 463
Hemlock Ave
Length: 0.08 miles
Direction: E-W
Address range: 2800 to 2849
Direction: E-W
Address range: 2800 to 2849
S Daniel Way
Length: 0.05 miles
Directions: N-S, SW-NE
Address range: 450 to 499
Directions: N-S, SW-NE
Address range: 450 to 499