Three Rivers neighborhood in Richland, Washington (WA), 99352 detailed profile
Settings
X


Business Search - 14 Million verified businesses
Area: 0.238 square miles
Population: 1,187
Population density:
| Three Rivers: | 4,986 people per square mile |
| Richland: | 1,748 people per square mile |

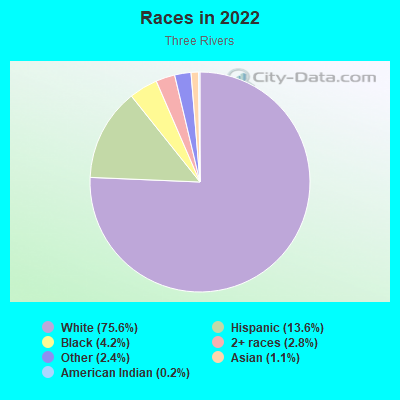
- 96575.6%White
- 17413.6%Hispanic or Latino
- 544.2%Black
- 362.8%Two or more races
- 312.4%Some other race
- 141.1%Asian
- 30.2%American Indian
Median household income in 2022:
| Three Rivers: | $64,018 |
| Richland: | $89,283 |
Distribution of median household income
![Distribution of median household income]()
- 7Less than $10,000
- 33$10,000 to $19,999
- 24$20,000 to $29,999
- 42$30,000 to $39,999
- 46$40,000 to $49,999
- 22$50,000 to $59,999
- 32$60,000 to $74,999
- 100$75,000 to $99,999
- 38$100,000 to $124,999
- 50$125,000 to $149,999
- 34$150,000 to $199,999
- 14$200,000 or more

Distribution of owner-occupied house/condo value
![Distribution of owner-occupied house/condo value]()
- 8Less than $50,000
- 1$50,000 to $99,999
- 2$100,000 to $149,999
- 17$150,000 to $199,999
- 20$200,000 to $249,999
- 37$250,000 to $299,999
- 65$300,000 to $399,999
- 15$400,000 to $499,999
- 6$500,000 to $749,999
- 3$750,000 to $999,999
- 13$1,000,000 or more

Distribution of rent paid by renters
![Distribution of rent paid by renters]()
- 6$200 to $299
- 2$300 to $399
- 15$400 to $499
- 14$500 to $599
- 4$600 to $699
- 13$700 to $799
- 23$800 to $899
- 42$900 to $999
- 66$1,000 to $1,249
- 42$1,250 to $1,499
- 18$1,500 to $1,999
- 17$2,000 or more

Median rent in 2022:
| Three Rivers: | $1,066 |
| Richland: | $1,145 |
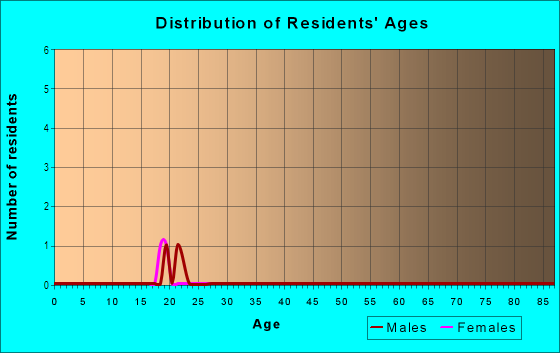
| Males: | 548 |
| Females: | 639 |
Males:
| This neighborhood: | 30.6 years |
| Whole city: | 35.0 years |
| This neighborhood: | 35.9 years |
| Whole city: | 39.1 years |
Average household size:
| Three Rivers: | 2.4 people |
| Richland: | 2.5 people |
Percentage of family households:
| Three Rivers: | 51.1% |
| Richland: | 46.0% |
| Here: | 44.5% |
| Richland: | 46.9% |
Percentage of married-couple families with children (among all households):
| Three Rivers: | 22.0% |
| Richland: | 26.4% |
Percentage of single-mother households (among all households):
| Three Rivers: | 9.6% |
| Richland: | 9.1% |
Percentage of never married males 15 years old and over:
Percentage of never married females 15 years old and over:
| Three Rivers: | 16.5% |
| Richland: | 18.2% |
Percentage of never married females 15 years old and over:
| Three Rivers: | 14.6% |
| city: | 14.0% |
Percentage of people that speak English not well or not at all:
| Three Rivers: | 2.4% |
| Richland: | 1.4% |
Percentage of people born in this state:
Percentage of people born in another U.S. state:
Percentage of native residents but born outside the U.S.:
Percentage of foreign born residents:
| Here: | 53.0% |
| Richland: | 49.4% |
Percentage of people born in another U.S. state:
| Three Rivers: | 38.2% |
| Richland: | 40.4% |
Percentage of native residents but born outside the U.S.:
| Here: | 1.5% |
| city: | 1.4% |
Percentage of foreign born residents:
| Here: | 7.3% |
| Richland: | 8.9% |
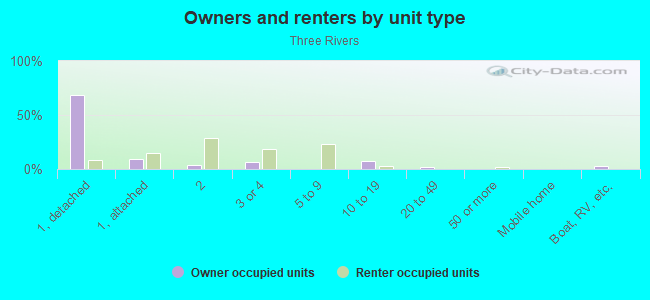
Owner-occupied
Renter-occupied

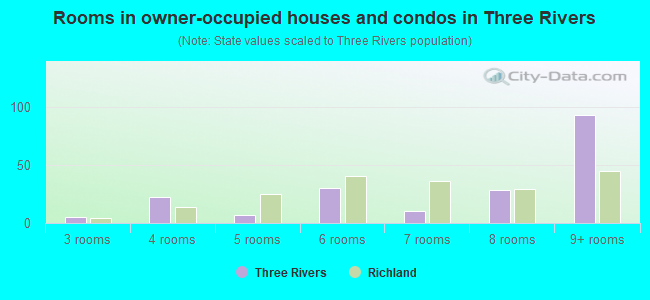
- Rooms in owner-occupied houses and condos in Three Rivers
- 01 room
- 02 rooms
- 53 rooms
- 224 rooms
- 75 rooms
- 306 rooms
- 107 rooms
- 288 rooms
- 939+ rooms
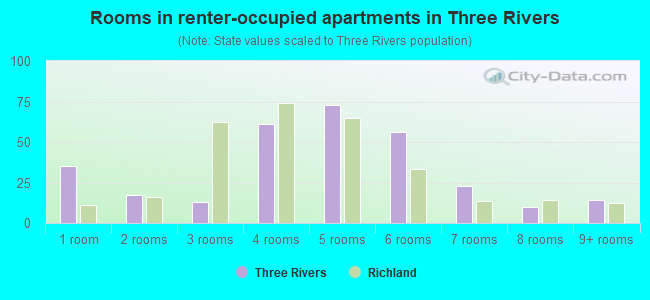
- Rooms in renter-occupied apartments in Three Rivers
- 351 room
- 172 rooms
- 133 rooms
- 614 rooms
- 735 rooms
- 566 rooms
- 237 rooms
- 108 rooms
- 149+ rooms
Owner-occupied
Renter-occupied
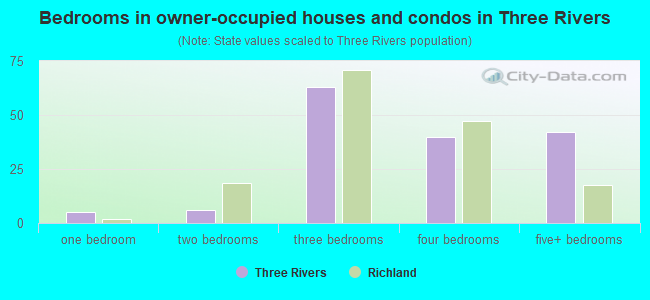
- Bedrooms in owner-occupied houses and condos in Three Rivers
- 0no bedroom
- 51 bedroom
- 62 bedrooms
- 633 bedrooms
- 404 bedrooms
- 425+ bedrooms
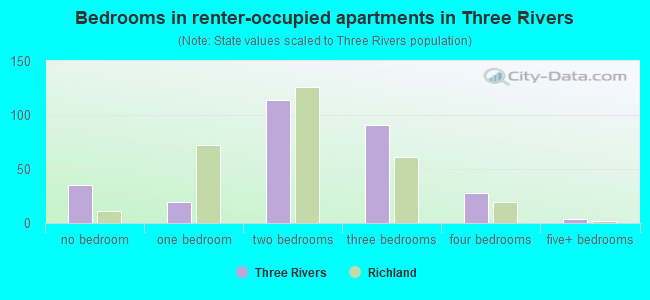
- Bedrooms in renter-occupied apartments in Three Rivers
- 35no bedroom
- 191 bedroom
- 1142 bedrooms
- 913 bedrooms
- 284 bedrooms
- 45+ bedrooms
Average number of cars or other vehicles available in houses/condos:
Average number of cars or other vehicles available in apartments:
| This neighborhood: | 2.2 |
| Richland: | 2.2 |
Average number of cars or other vehicles available in apartments:
| Here: | 2.3 |
| city: | 1.5 |
Percentage of units with a mortgage:
| Three Rivers: | 54.6% |
| Richland: | 62.9% |
Housing prices:
- Average estimated value of detached houses in 2022 (39.5% of all units):
Three Rivers: $323,953 Washington: $734,307
- Average estimated value of townhouses or other attached units in 2022 (21.3% of all units):
This neighborhood: $346,054 Washington: $657,697
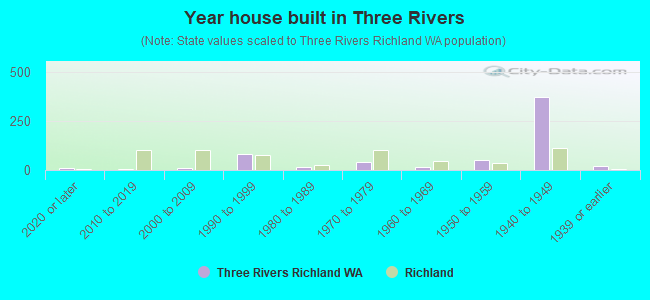
- Year house built in Three Rivers
- 92020 or later
- 72010 to 2019
- 112000 to 2009
- 831990 to 1999
- 151980 to 1989
- 421970 to 1979
- 131960 to 1969
- 491950 to 1959
- 3711940 to 1949
- 211939 or earlier
City-data.com crime index for city in 2020 (higher means more crime):
| City: | 223.6 |
| U.S. average: | 219.5 |
Travel time to work (commute)
![Travel time to work (commute)]()
- 6Less than 5 minutes
- 185 to 9 minutes
- 3410 to 14 minutes
- 3315 to 19 minutes
- 2320 to 24 minutes
- 325 to 29 minutes
- 730 to 34 minutes
- 635 to 39 minutes
- 240 to 44 minutes
- 1945 to 59 minutes
- 460 to 89 minutes
- 190 or more minutes

Means of transportation to work
![Means of transportation to work]()
- 71.5%363Drove a car alone
- 11.0%56Carpooled
- 2.6%13Bus
- 1.0%5Bicycle
- 3.2%16Walked
- 0.2%1Other means
- 14.8%75Worked at home

Time leaving home to go to work
![Time leaving home to go to work]()
- 1112:00 a.m. to 4:59 a.m.
- 115:00 a.m. to 5:29 a.m.
- 105:30 a.m. to 5:59 a.m.
- 66:00 a.m. to 6:29 a.m.
- 166:30 a.m. to 6:59 a.m.
- 207:00 a.m. to 7:29 a.m.
- 177:30 a.m. to 7:59 a.m.
- 168:00 a.m. to 8:29 a.m.
- 98:30 a.m. to 8:59 a.m.
- 99:00 a.m. to 9:59 a.m.
- 310:00 a.m. to 10:59 a.m.
- 311:00 a.m. to 11:59 a.m.
- 812:00 p.m. to 3:59 p.m.
- 64:00 p.m. to 11:59 p.m.

Occupations of males:
- Percentage of males in business and financial operations occupations:
Here: 1.8% city: 5.3%
- Percentage of males in computer and mathematical occupations:
Here: 18.5% city: 7.0%
- Percentage of males in architecture and engineering occupations:
Here: 3.4% city: 10.2%
- Percentage of males in life, physical, and social science occupations:
Here: 3.1% city: 8.1%
- Percentage of males in education, training, and library occupations:
Here: 4.1% city: 3.6%
- Percentage of males in arts, design, entertainment, sports, and media occupations:
Here: 1.8% city: 1.3%
- Percentage of males in healthcare practitioners and technical occupations:
Here: 2.6% city: 5.0%
- Percentage of males in service occupations:
Here: 18.1% city: 8.5%
- Percentage of males in sales and office occupations:
Here: 13.5% city: 9.2%
- Percentage of males in farming, fishing, and forestry occupations:
Here: 1.4% city: 0.2%
- Percentage of males in construction, extraction, and maintenance occupations:
Here: 13.3% city: 7.1%
- Percentage of males in production occupations:
Here: 9.0% city: 4.5%
- Percentage of males in transportation occupations:
Here: 4.9% city: 5.3%
- Percentage of males in material moving occupations:
Here: 2.8% city: 5.5%
Occupations of females:
- Percentage of females in management occupations (except farmers):
Here: 16.2% city: 11.4%
- Percentage of females in business and financial operations occupations:
Here: 1.7% city: 7.6%
- Percentage of females in architecture and engineering occupations:
Here: 2.3% city: 1.2%
- Percentage of females in life, physical, and social science occupations:
Here: 1.2% city: 3.9%
- Percentage of females in community and social services occupations:
Here: 2.5% city: 2.6%
- Percentage of females in legal occupations:
Here: 1.9% city: 1.8%
- Percentage of females in education, training, and library occupations:
Here: 6.4% city: 12.0%
- Percentage of females in healthcare practitioners and technical occupations:
Here: 1.4% city: 9.5%
- Percentage of females in service occupations:
Here: 32.8% city: 17.4%
- Percentage of females in sales and office occupations:
Here: 28.4% city: 23.3%
- Percentage of females in construction, extraction, and maintenance occupations:
Here: 2.3% city: 0.4%
- Percentage of females in production occupations:
Here: 1.0% city: 1.0%
- Percentage of females in transportation occupations:
Here: 1.0% city: 1.0%
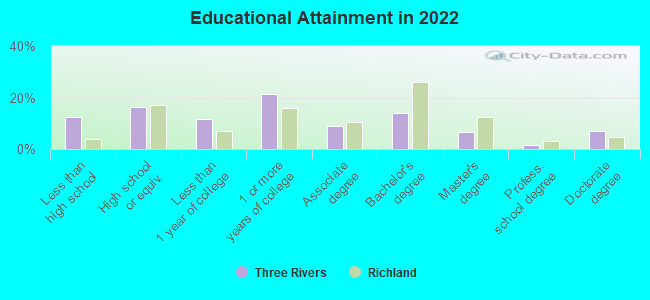
Education in this neighborhood (subdivision or community):
- Percentage of people 3 years and older in K-12 schools:
Three Rivers: 21.4% Richland: 18.9%
- Percentage of people 3 years and older in undergraduate colleges:
Three Rivers: 3.7% Richland: 3.9%
- Percentage of people 3 years and older in grad. or professional schools:
Three Rivers: 1.2% Richland: 1.5%
- Percentage of students K-12 enrolled in private schools:
Three Rivers: 31.7% Richland: 7.9%
Percentage of population below poverty level:
| Three Rivers: | 8.7% |
| Richland: | 7.5% |
Median year owner moved in (as recorded in 2022):
Median year renter moved in (as recorded in 2022):
| Three Rivers: | 2003 |
| Richland: | 2011 |
Median year renter moved in (as recorded in 2022):
| Three Rivers: | 2016 |
| Richland: | 2018 |
Percentage of married-couple families with both working:
| Three Rivers: | 90.9% |
| Richland: | 69.6% |
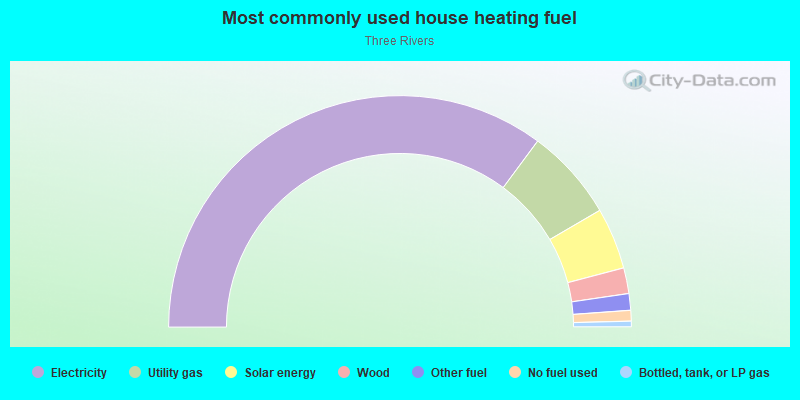
- 70.3%Electricity
- 12.9%Utility gas
- 8.6%Solar energy
- 3.6%Wood
- 2.3%Other fuel
- 1.5%No fuel used
- 0.8%Bottled, tank, or LP gas
Roads and streets:
Lee Blvd
Length: 0.68 miles
Directions: E-W, N-S
Address range: 89 to 1299
Directions: E-W, N-S
Address range: 89 to 1299
George Washington Way
Length: 0.56 miles
Directions: N-S, SE-NW
Address range: 500 to 899
Directions: N-S, SE-NW
Address range: 500 to 899
Knight St
Length: 0.42 miles
Direction: E-W
Address range: 100 to 1299
Direction: E-W
Address range: 100 to 1299
Amon Park Rd N
Length: 0.29 miles
Directions: N-S, SW-NE
Directions: N-S, SW-NE
Harding St
Length: 0.26 miles
Directions: E-W, N-S, SE-NW
Directions: E-W, N-S, SE-NW
The Parkway
Length: 0.25 miles
Directions: E-W, N-S
Address range: 600 to 799
Directions: E-W, N-S
Address range: 600 to 799
Jadwin Ave
Length: 0.22 miles
Direction: N-S
Address range: 600 to 799
Direction: N-S
Address range: 600 to 799
Newton St
Length: 0.17 miles
Direction: E-W
Address range: 89 to 100
Direction: E-W
Address range: 89 to 100
Cullum Ave
Length: 0.13 miles
Direction: SW-NE
Address range: 616 to 699
Direction: SW-NE
Address range: 616 to 699
Goethals Dr
Length: 0.12 miles
Direction: N-S
Address range: 700 to 799
Direction: N-S
Address range: 700 to 799