Tijuana River Valley neighborhood in San Diego, California (CA), 92154, 92173 detailed profile
Settings
X


Business Search - 14 Million verified businesses
Area: 5.392 square miles
Population: 2,856
Population density:
| Tijuana River Valley: | 530 people per square mile |
| San Diego: | 4,258 people per square mile |

- 2,60547.7%Native Hawaiian and Other
Pacific Islander - 2,17339.8%Hispanic or Latino
- 3376.2%White
- 1422.6%Black
- 1112.0%Asian
- 981.8%Two or more races
- 2,60547.7%Native Hawaiian and Other

Median household income in 2022:
| Tijuana River Valley: | $99,984 |
| San Diego: | $100,010 |
Distribution of median household income
![Distribution of median household income]()
- 94Less than $10,000
- 215$10,000 to $19,999
- 58$20,000 to $29,999
- 22$30,000 to $39,999
- 84$40,000 to $49,999
- 69$50,000 to $59,999
- 139$60,000 to $74,999
- 82$75,000 to $99,999
- 36$100,000 to $124,999
- 26$125,000 to $149,999
- 157$150,000 to $199,999
- 35$200,000 or more

Distribution of owner-occupied house/condo value
![Distribution of owner-occupied house/condo value]()
- 124Less than $50,000
- 79$50,000 to $99,999
- 102$100,000 to $149,999
- 45$250,000 to $299,999
- 43$300,000 to $399,999
- 59$400,000 to $499,999
- 312$500,000 to $749,999
- 1,020$750,000 to $999,999
- 12$1,000,000 or more

Distribution of rent paid by renters
![Distribution of rent paid by renters]()
- 78$200 to $299
- 121$300 to $399
- 215$400 to $499
- 59$500 to $599
- 24$700 to $799
- 179$800 to $899
- 69$900 to $999
- 104$1,000 to $1,249
- 304$1,250 to $1,499
- 337$1,500 to $1,999
- 405$2,000 or more

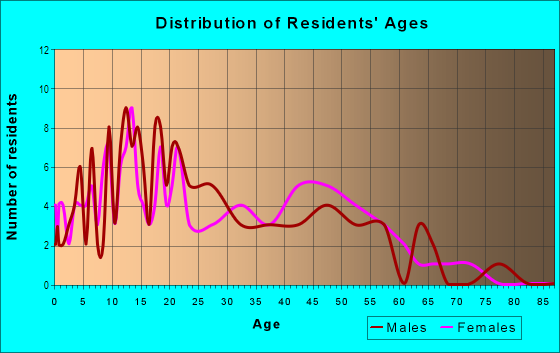
| Males: | 1,475 |
| Females: | 1,381 |
Males:
| This neighborhood: | 30.5 years |
| Whole city: | 35.4 years |
| This neighborhood: | 41.7 years |
| Whole city: | 37.2 years |
Average household size:
| Tijuana River Valley: | 4.2 people |
| San Diego: | 2.5 people |
Percentage of family households:
| Tijuana River Valley: | 57.6% |
| San Diego: | 41.7% |
| Here: | 63.6% |
| San Diego: | 43.2% |
Percentage of married-couple families with children (among all households):
| Tijuana River Valley: | 19.2% |
| San Diego: | 27.8% |
Percentage of single-mother households (among all households):
| Tijuana River Valley: | 5.0% |
| San Diego: | 7.9% |
Percentage of never married males 15 years old and over:
Percentage of never married females 15 years old and over:
| Tijuana River Valley: | 20.8% |
| San Diego: | 23.4% |
Percentage of never married females 15 years old and over:
| Tijuana River Valley: | 18.0% |
| city: | 18.8% |
Percentage of people that speak English not well or not at all:
| Tijuana River Valley: | 16.0% |
| San Diego: | 5.9% |
Percentage of people born in this state:
Percentage of people born in another U.S. state:
Percentage of native residents but born outside the U.S.:
Percentage of foreign born residents:
| Here: | 51.6% |
| San Diego: | 48.1% |
Percentage of people born in another U.S. state:
| Tijuana River Valley: | 7.1% |
| San Diego: | 24.9% |
Percentage of native residents but born outside the U.S.:
| Here: | 2.6% |
| city: | 2.4% |
Percentage of foreign born residents:
| Here: | 38.7% |
| San Diego: | 24.6% |

Owner-occupied
Renter-occupied


- Rooms in owner-occupied houses and condos in Tijuana River Valley
- 01 room
- 02 rooms
- 283 rooms
- 1374 rooms
- 625 rooms
- 1236 rooms
- 647 rooms
- 148 rooms
- 1359+ rooms

- Rooms in renter-occupied apartments in Tijuana River Valley
- 241 room
- 322 rooms
- 2143 rooms
- 5824 rooms
- 3155 rooms
- 986 rooms
- 267 rooms
- 608 rooms
- 269+ rooms
Owner-occupied
Renter-occupied

- Bedrooms in owner-occupied houses and condos in Tijuana River Valley
- 0no bedroom
- 01 bedroom
- 1212 bedrooms
- 1203 bedrooms
- 1464 bedrooms
- 1285+ bedrooms

- Bedrooms in renter-occupied apartments in Tijuana River Valley
- 24no bedroom
- 321 bedroom
- 9102 bedrooms
- 943 bedrooms
- 654 bedrooms
- 265+ bedrooms
Average number of cars or other vehicles available in houses/condos:
Average number of cars or other vehicles available in apartments:
| This neighborhood: | 2.7 |
| San Diego: | 2.1 |
Average number of cars or other vehicles available in apartments:
| Here: | |
| city: |
Percentage of units with a mortgage:
| Tijuana River Valley: | 71.2% |
| San Diego: | 69.2% |
Average estimated value of detached houses in 2022 (76.9% of all units):
| Tijuana River Valley: | $562,600 |
| San Diego: | $1,227,596 |

- Year house built in Tijuana River Valley
- 02020 or later
- 602010 to 2019
- 2002000 to 2009
- 571990 to 1999
- 1911980 to 1989
- 3821970 to 1979
- 261960 to 1969
- 841950 to 1959
- 241940 to 1949
- 121939 or earlier

City-data.com crime index for city in 2020 (higher means more crime):
| City: | 197.8 |
| U.S. average: | 219.5 |
Travel time to work (commute)
![Travel time to work (commute)]()
- 25Less than 5 minutes
- 955 to 9 minutes
- 16710 to 14 minutes
- 25515 to 19 minutes
- 21020 to 24 minutes
- 13625 to 29 minutes
- 24030 to 34 minutes
- 7935 to 39 minutes
- 2840 to 44 minutes
- 8245 to 59 minutes
- 7660 to 89 minutes
- 4990 or more minutes

Means of transportation to work
![Means of transportation to work]()
- 71.1%809Drove a car alone
- 9.1%103Carpooled
- 1.1%13Bus
- 4.7%54Light rail, streetcar or trolley
- 0.4%5Motorcycle
- 4.0%46Walked
- 11.2%127Worked at home

Time leaving home to go to work
![Time leaving home to go to work]()
- 7912:00 a.m. to 4:59 a.m.
- 1095:00 a.m. to 5:29 a.m.
- 695:30 a.m. to 5:59 a.m.
- 1276:00 a.m. to 6:29 a.m.
- 1246:30 a.m. to 6:59 a.m.
- 1587:00 a.m. to 7:29 a.m.
- 947:30 a.m. to 7:59 a.m.
- 1458:00 a.m. to 8:29 a.m.
- 508:30 a.m. to 8:59 a.m.
- 1179:00 a.m. to 9:59 a.m.
- 2910:00 a.m. to 10:59 a.m.
- 511:00 a.m. to 11:59 a.m.
- 10512:00 p.m. to 3:59 p.m.
- 1734:00 p.m. to 11:59 p.m.

Occupations of males:
- Percentage of males in management occupations (except farmers):
Here: 5.1% city: 12.7%
- Percentage of males in business and financial operations occupations:
Here: 3.0% city: 6.6%
- Percentage of males in architecture and engineering occupations:
Here: 12.9% city: 6.5%
- Percentage of males in community and social services occupations:
Here: 1.5% city: 1.0%
- Percentage of males in education, training, and library occupations:
Here: 4.3% city: 3.8%
- Percentage of males in service occupations:
Here: 24.7% city: 14.6%
- Percentage of males in sales and office occupations:
Here: 11.2% city: 13.9%
- Percentage of males in construction, extraction, and maintenance occupations:
Here: 13.1% city: 5.9%
- Percentage of males in production occupations:
Here: 9.4% city: 4.6%
- Percentage of males in transportation occupations:
Here: 4.8% city: 3.9%
- Percentage of males in material moving occupations:
Here: 8.2% city: 3.3%
Occupations of females:
- Percentage of females in management occupations (except farmers):
Here: 3.7% city: 10.2%
- Percentage of females in business and financial operations occupations:
Here: 5.1% city: 9.0%
- Percentage of females in community and social services occupations:
Here: 1.2% city: 2.5%
- Percentage of females in legal occupations:
Here: 1.1% city: 1.8%
- Percentage of females in education, training, and library occupations:
Here: 6.1% city: 8.2%
- Percentage of females in healthcare practitioners and technical occupations:
Here: 15.9% city: 9.7%
- Percentage of females in service occupations:
Here: 30.9% city: 19.9%
- Percentage of females in sales and office occupations:
Here: 31.6% city: 22.0%
- Percentage of females in production occupations:
Here: 2.3% city: 2.8%
- Percentage of females in transportation occupations:
Here: 1.2% city: 0.8%
- Percentage of females in material moving occupations:
Here: 3.0% city: 1.5%
Percentage of people 16-64 in Armed Forces:
| Tijuana River Valley: | 0.8% |
| San Diego: | 4.0% |
Education in this neighborhood (subdivision or community):
- Percentage of people 3 years and older in K-12 schools:
Tijuana River Valley: 33.3% San Diego: 13.8%
- Percentage of people 3 years and older in undergraduate colleges:
Tijuana River Valley: 6.7% San Diego: 8.5%
- Percentage of people 3 years and older in grad. or professional schools:
Tijuana River Valley: 3.3% San Diego: 2.3%
- Percentage of students K-12 enrolled in private schools:
Tijuana River Valley: 0.0% San Diego: 13.6%
Percentage of population below poverty level:
| Tijuana River Valley: | 6.2% |
| San Diego: | 11.3% |
Median year owner moved in (as recorded in 2022):
| Tijuana River Valley: | 2019 |
| San Diego: | 2010 |
Percentage of married-couple families with both working:
| Tijuana River Valley: | 51.3% |
| San Diego: | 66.0% |

- 59.3%Utility gas
- 28.8%Electricity
- 5.7%No fuel used
- 3.3%Bottled, tank, or LP gas
- 2.9%Solar energy
Roads and streets:
Monument Rd
Length: 3.93 miles
Directions: E-W, N-S, SE-NW, SW-NE
Address range: 898 to 3399
Directions: E-W, N-S, SE-NW, SW-NE
Address range: 898 to 3399
Dairy Mart Rd
Length: 1.59 miles
Directions: E-W, N-S, SW-NE
Address range: 2320 to 3099
Directions: E-W, N-S, SW-NE
Address range: 2320 to 3099
Camino de la Plz
Length: 0.84 miles
Directions: N-S, SE-NW
Address range: 2200 to 2999
Directions: N-S, SE-NW
Address range: 2200 to 2999
Hollister St
Length: 0.79 miles
Direction: N-S
Address range: 2243 to 2999
Direction: N-S
Address range: 2243 to 2999
Saturn Blvd
Length: 0.68 miles
Direction: N-S
Direction: N-S
Sunset Ave
Length: 0.38 miles
Direction: E-W
Address range: 2512 to 2699
Direction: E-W
Address range: 2512 to 2699
Clearwater Way
Length: 0.32 miles
Directions: E-W, N-S, SE-NW
Directions: E-W, N-S, SE-NW
Old Dairy Mart Rd
Length: 0.32 miles
Direction: N-S
Direction: N-S
Saturn Blvd (19th St)
Length: 0.24 miles
Direction: N-S
Address range: 2110 to 2199
Direction: N-S
Address range: 2110 to 2199
W Tia Juana St
Length: 0.15 miles
Direction: E-W
Direction: E-W
International Rd
Length: 0.12 miles
Direction: N-S
Address range: 1968 to 2099
Direction: N-S
Address range: 1968 to 2099