Timp neighborhood in Provo, Utah (UT), 84601 detailed profile
Settings
X


Business Search - 14 Million verified businesses
Area: 0.093 square miles
Population: 1,085
Population density:
| Timp: | 11,677 people per square mile |
| Provo: | 2,864 people per square mile |

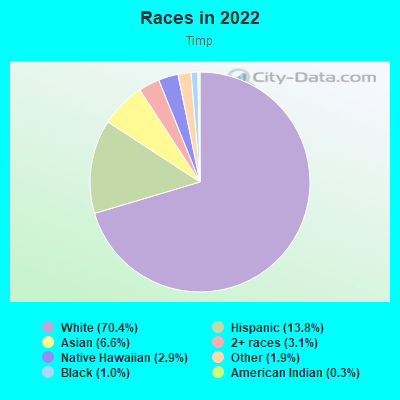
- 78470.4%White
- 15413.8%Hispanic or Latino
- 736.6%Asian
- 353.1%Two or more races
- 322.9%Native Hawaiian and Other
Pacific Islander - 211.9%Some other race
- 111.0%Black
- 30.3%American Indian
Median household income in 2022:
| Timp: | $41,438 |
| Provo: | $59,290 |
Distribution of median household income
![Distribution of median household income]()
- 40Less than $10,000
- 78$10,000 to $19,999
- 50$20,000 to $29,999
- 67$30,000 to $39,999
- 51$40,000 to $49,999
- 42$50,000 to $59,999
- 42$60,000 to $74,999
- 46$75,000 to $99,999
- 20$100,000 to $124,999
- 6$125,000 to $149,999
- 26$150,000 to $199,999
- 6$200,000 or more

Distribution of owner-occupied house/condo value
![Distribution of owner-occupied house/condo value]()
- 5$200,000 to $249,999
- 13$250,000 to $299,999
- 9$300,000 to $399,999
- 22$400,000 to $499,999
- 8$500,000 to $749,999
- 2$750,000 to $999,999
- 2$1,000,000 or more

Distribution of rent paid by renters
![Distribution of rent paid by renters]()
- 6$100 to $199
- 42$300 to $399
- 13$400 to $499
- 11$500 to $599
- 7$600 to $699
- 35$700 to $799
- 121$800 to $899
- 118$900 to $999
- 82$1,000 to $1,249
- 15$1,250 to $1,499
- 33$1,500 to $1,999
- 9$2,000 or more

Median rent in 2022:
| Timp: | $937 |
| Provo: | $982 |
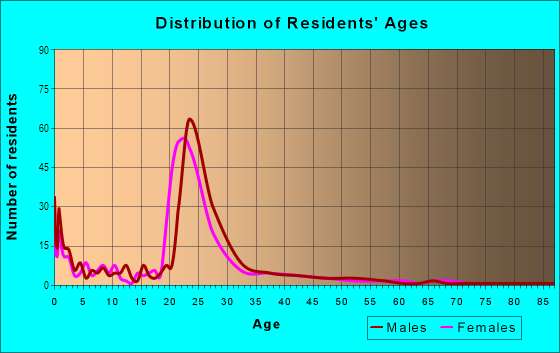
| Males: | 569 |
| Females: | 515 |
Males:
| This neighborhood: | 24.5 years |
| Whole city: | 23.9 years |
| This neighborhood: | 23.5 years |
| Whole city: | 22.9 years |
Average household size:
| Timp: | 11.1 people |
| Provo: | 3.0 people |
Percentage of family households:
| Timp: | 70.4% |
| Provo: | 58.8% |
| Here: | 64.9% |
| Provo: | 54.9% |
Percentage of married-couple families with children (among all households):
| Timp: | 38.0% |
| Provo: | 25.8% |
Percentage of single-mother households (among all households):
| Timp: | 4.8% |
| Provo: | 3.4% |
Percentage of never married males 15 years old and over:
Percentage of never married females 15 years old and over:
| Timp: | 21.9% |
| Provo: | 24.4% |
Percentage of never married females 15 years old and over:
| Timp: | 12.1% |
| city: | 25.0% |
Percentage of people that speak English not well or not at all:
| Timp: | 5.3% |
| Provo: | 2.7% |
Percentage of people born in this state:
Percentage of people born in another U.S. state:
Percentage of native residents but born outside the U.S.:
Percentage of foreign born residents:
| Here: | 36.3% |
| Provo: | 47.6% |
Percentage of people born in another U.S. state:
| Timp: | 54.8% |
| Provo: | 40.4% |
Percentage of native residents but born outside the U.S.:
| Here: | 1.0% |
| city: | 1.4% |
Percentage of foreign born residents:
| Here: | 7.9% |
| Provo: | 10.6% |
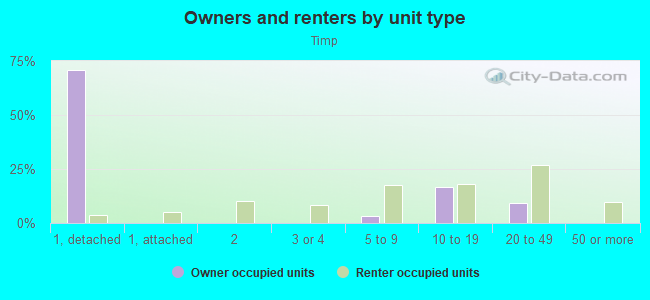
Owner-occupied
Renter-occupied

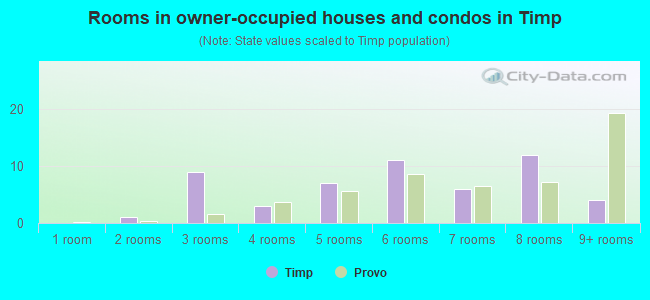
- Rooms in owner-occupied houses and condos in Timp
- 01 room
- 12 rooms
- 93 rooms
- 34 rooms
- 75 rooms
- 116 rooms
- 67 rooms
- 128 rooms
- 49+ rooms
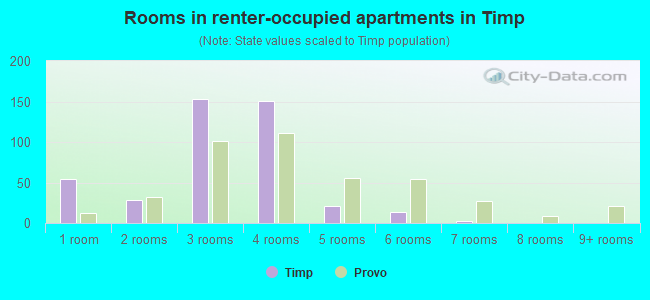
- Rooms in renter-occupied apartments in Timp
- 541 room
- 282 rooms
- 1533 rooms
- 1514 rooms
- 215 rooms
- 136 rooms
- 27 rooms
- 08 rooms
- 09+ rooms
Owner-occupied
Renter-occupied
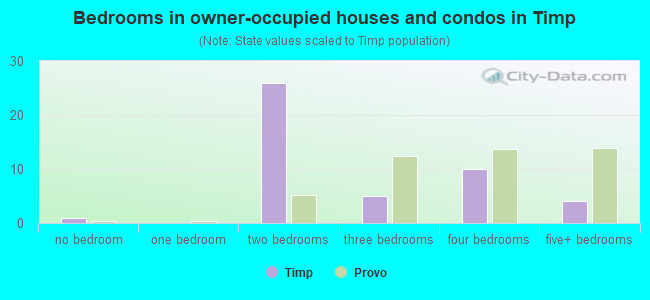
- Bedrooms in owner-occupied houses and condos in Timp
- 1no bedroom
- 01 bedroom
- 262 bedrooms
- 53 bedrooms
- 104 bedrooms
- 45+ bedrooms
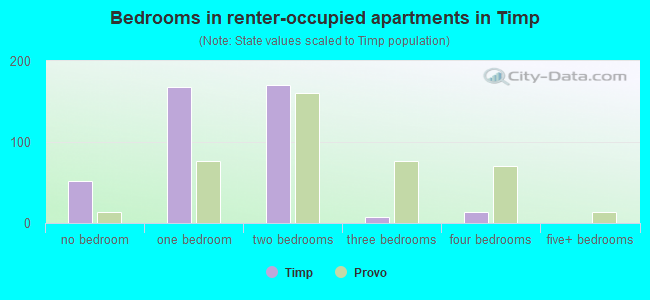
- Bedrooms in renter-occupied apartments in Timp
- 52no bedroom
- 1681 bedroom
- 1702 bedrooms
- 73 bedrooms
- 144 bedrooms
- 05+ bedrooms
Average number of cars or other vehicles available in houses/condos:
Average number of cars or other vehicles available in apartments:
| This neighborhood: | |
| Provo: |
Average number of cars or other vehicles available in apartments:
| Here: | 1.6 |
| city: | 2.0 |
Percentage of units with a mortgage:
| Timp: | 77.0% |
| Provo: | 64.3% |
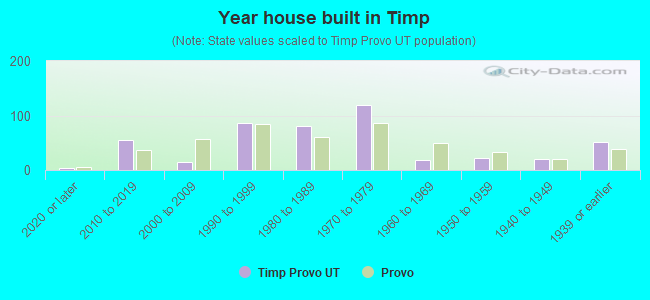
- Year house built in Timp
- 42020 or later
- 552010 to 2019
- 152000 to 2009
- 871990 to 1999
- 811980 to 1989
- 1191970 to 1979
- 181960 to 1969
- 221950 to 1959
- 201940 to 1949
- 521939 or earlier
City-data.com crime index for city in 2020 (higher means more crime):
| City: | 6.3 |
| U.S. average: | 219.5 |
Travel time to work (commute)
![Travel time to work (commute)]()
- 19Less than 5 minutes
- 1575 to 9 minutes
- 22710 to 14 minutes
- 14315 to 19 minutes
- 7420 to 24 minutes
- 2625 to 29 minutes
- 5530 to 34 minutes
- 1335 to 39 minutes
- 1540 to 44 minutes
- 2345 to 59 minutes
- 2560 to 89 minutes
- 890 or more minutes

Means of transportation to work
![Means of transportation to work]()
- 56.9%438Drove a car alone
- 15.1%116Carpooled
- 3.9%30Bus
- 3.5%27Long-distance train or commuter rail
- 0.4%3Light rail, streetcar or trolley
- 0.1%1Motorcycle
- 5.3%41Bicycle
- 3.0%23Walked
- 0.1%1Other means
- 12.3%95Worked at home

Time leaving home to go to work
![Time leaving home to go to work]()
- 2412:00 a.m. to 4:59 a.m.
- 95:00 a.m. to 5:29 a.m.
- 75:30 a.m. to 5:59 a.m.
- 166:00 a.m. to 6:29 a.m.
- 746:30 a.m. to 6:59 a.m.
- 667:00 a.m. to 7:29 a.m.
- 787:30 a.m. to 7:59 a.m.
- 738:00 a.m. to 8:29 a.m.
- 1178:30 a.m. to 8:59 a.m.
- 539:00 a.m. to 9:59 a.m.
- 6210:00 a.m. to 10:59 a.m.
- 2811:00 a.m. to 11:59 a.m.
- 10212:00 p.m. to 3:59 p.m.
- 544:00 p.m. to 11:59 p.m.

Occupations of males:
- Percentage of males in management occupations (except farmers):
Here: 4.9% city: 7.9%
- Percentage of males in business and financial operations occupations:
Here: 3.0% city: 5.2%
- Percentage of males in computer and mathematical occupations:
Here: 6.8% city: 8.6%
- Percentage of males in architecture and engineering occupations:
Here: 3.8% city: 2.3%
- Percentage of males in life, physical, and social science occupations:
Here: 1.5% city: 1.9%
- Percentage of males in community and social services occupations:
Here: 1.4% city: 1.2%
- Percentage of males in legal occupations:
Here: 2.3% city: 0.6%
- Percentage of males in education, training, and library occupations:
Here: 8.8% city: 9.6%
- Percentage of males in arts, design, entertainment, sports, and media occupations:
Here: 4.5% city: 3.5%
- Percentage of males in service occupations:
Here: 19.1% city: 16.2%
- Percentage of males in sales and office occupations:
Here: 21.0% city: 18.4%
- Percentage of males in construction, extraction, and maintenance occupations:
Here: 2.4% city: 6.6%
- Percentage of males in production occupations:
Here: 5.1% city: 5.2%
- Percentage of males in transportation occupations:
Here: 6.4% city: 3.7%
- Percentage of males in material moving occupations:
Here: 3.1% city: 4.3%
Occupations of females:
- Percentage of females in management occupations (except farmers):
Here: 9.6% city: 6.6%
- Percentage of females in business and financial operations occupations:
Here: 3.5% city: 4.4%
- Percentage of females in computer and mathematical occupations:
Here: 3.0% city: 1.5%
- Percentage of females in architecture and engineering occupations:
Here: 2.9% city: 0.7%
- Percentage of females in community and social services occupations:
Here: 5.1% city: 2.7%
- Percentage of females in education, training, and library occupations:
Here: 11.5% city: 14.2%
- Percentage of females in arts, design, entertainment, sports, and media occupations:
Here: 3.8% city: 5.0%
- Percentage of females in healthcare practitioners and technical occupations:
Here: 10.6% city: 4.9%
- Percentage of females in service occupations:
Here: 18.5% city: 22.0%
- Percentage of females in sales and office occupations:
Here: 28.2% city: 28.1%
- Percentage of females in construction, extraction, and maintenance occupations:
Here: 1.2% city: 0.6%
- Percentage of females in production occupations:
Here: 1.1% city: 3.5%
- Percentage of females in material moving occupations:
Here: 2.2% city: 2.9%
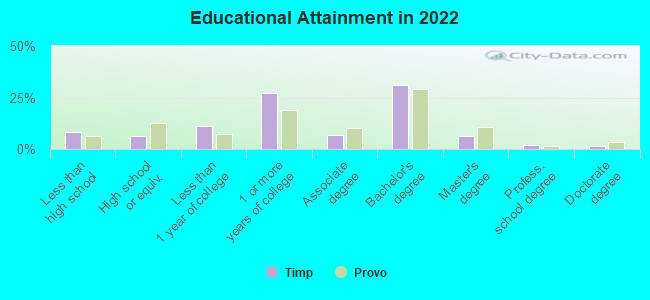
Education in this neighborhood (subdivision or community):
- Percentage of people 3 years and older in K-12 schools:
Timp: 7.3% Provo: 12.7%
- Percentage of people 3 years and older in undergraduate colleges:
Timp: 40.5% Provo: 35.3%
- Percentage of people 3 years and older in grad. or professional schools:
Timp: 3.5% Provo: 2.6%
- Percentage of students K-12 enrolled in private schools:
Timp: 0.0% Provo: 6.2%
Percentage of population below poverty level:
| Timp: | 31.9% |
| Provo: | 24.3% |
Percentage of married-couple families with both working:
| Timp: | 60.3% |
| Provo: | 65.5% |
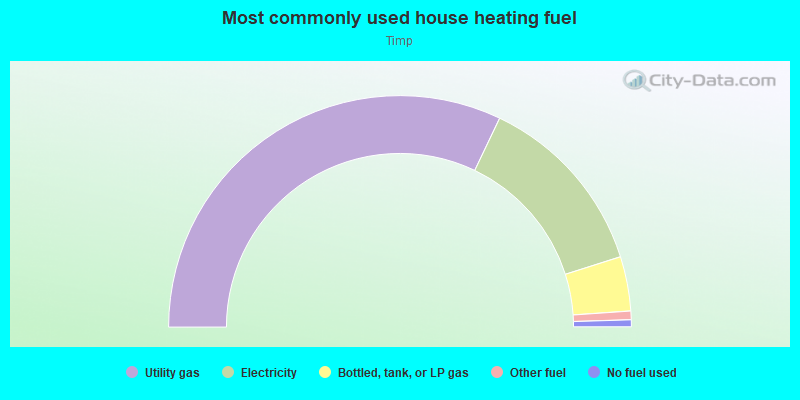
- 64.2%Utility gas
- 26.0%Electricity
- 7.6%Bottled, tank, or LP gas
- 1.2%Other fuel
- 1.0%No fuel used
Roads and streets:
N 400 West St
Length: 0.36 miles
Direction: N-S
Address range: 100 to 499
Direction: N-S
Address range: 100 to 499
N 300 West St (N 300 W)
Length: 0.27 miles
Direction: N-S
Address range: 200 to 499
Direction: N-S
Address range: 200 to 499
W 500 N (W 500 North St)
Length: 0.24 miles
Direction: E-W
Address range: 200 to 399
Direction: E-W
Address range: 200 to 399
W 400 North St (W 400 N)
Length: 0.24 miles
Direction: E-W
Address range: 200 to 399
Direction: E-W
Address range: 200 to 399
W 300 North St (W 300 N)
Length: 0.24 miles
Direction: E-W
Address range: 201 to 399
Direction: E-W
Address range: 201 to 399
N Freedom Blvd (N 200 W, N 200 West St, Freedom Blvd)
Length: 0.18 miles
Direction: N-S
Address range: 300 to 499
Direction: N-S
Address range: 300 to 499
W 200 N (W 200 North St)
Length: 0.12 miles
Direction: E-W
Address range: 300 to 399
Direction: E-W
Address range: 300 to 399