Tower District neighborhood in Fresno, California (CA), 93728 detailed profile
Settings
X


Business Search - 14 Million verified businesses
Area: 0.193 square miles
Population: 1,189
Population density:
| Tower District: | 6,163 people per square mile |
| Fresno: | 5,228 people per square mile |

- 63752.4%Hispanic or Latino
- 41934.5%White
- 705.8%Two or more races
- 534.4%Asian
- 131.1%Native Hawaiian and Other
Pacific Islander - 121.0%Some other race
- 110.9%Black
- 10.08%American Indian

Distribution of median household income
![Distribution of median household income]()
- 55Less than $10,000
- 85$10,000 to $19,999
- 58$20,000 to $29,999
- 127$30,000 to $39,999
- 80$40,000 to $49,999
- 21$50,000 to $59,999
- 52$60,000 to $74,999
- 42$75,000 to $99,999
- 60$100,000 to $124,999
- 54$125,000 to $149,999
- 52$150,000 to $199,999
- 80$200,000 or more

Distribution of owner-occupied house/condo value
![Distribution of owner-occupied house/condo value]()
- 21Less than $50,000
- 23$50,000 to $99,999
- 10$100,000 to $149,999
- 45$150,000 to $199,999
- 26$200,000 to $249,999
- 67$250,000 to $299,999
- 62$300,000 to $399,999
- 43$400,000 to $499,999
- 27$500,000 to $749,999
- 26$750,000 to $999,999
- 6$1,000,000 or more

Distribution of rent paid by renters
![Distribution of rent paid by renters]()
- 14Less than $100
- 16$100 to $199
- 5$400 to $499
- 119$500 to $599
- 30$600 to $699
- 54$700 to $799
- 97$800 to $899
- 57$900 to $999
- 97$1,000 to $1,249
- 26$1,250 to $1,499
- 40$1,500 to $1,999

Median rent in 2022:
| Tower District: | $942 |
| Fresno: | $1,087 |
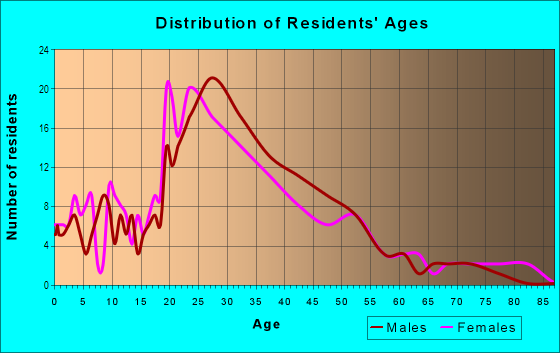
| Males: | 607 |
| Females: | 582 |
Males:
| This neighborhood: | 34.7 years |
| Whole city: | 31.0 years |
| This neighborhood: | 40.7 years |
| Whole city: | 34.0 years |
Average household size:
| Tower District: | 2.4 people |
| Fresno: | 2.9 people |
Percentage of family households:
| Tower District: | 34.9% |
| Fresno: | 48.0% |
| Here: | 18.9% |
| Fresno: | 39.7% |
Percentage of married-couple families with children (among all households):
| Tower District: | 22.3% |
| Fresno: | 20.0% |
Percentage of single-mother households (among all households):
| Tower District: | 14.7% |
| Fresno: | 9.6% |
Percentage of never married males 15 years old and over:
Percentage of never married females 15 years old and over:
| Tower District: | 22.9% |
| Fresno: | 23.7% |
Percentage of never married females 15 years old and over:
| Tower District: | 21.5% |
| city: | 20.2% |
Percentage of people that speak English not well or not at all:
| Tower District: | 1.9% |
| Fresno: | 8.1% |
Percentage of people born in this state:
Percentage of people born in another U.S. state:
Percentage of native residents but born outside the U.S.:
Percentage of foreign born residents:
| Here: | 82.0% |
| Fresno: | 71.7% |
Percentage of people born in another U.S. state:
| Tower District: | 6.1% |
| Fresno: | 9.2% |
Percentage of native residents but born outside the U.S.:
| Here: | 0.5% |
| city: | 0.8% |
Percentage of foreign born residents:
| Here: | 11.4% |
| Fresno: | 18.2% |

Owner-occupied
Renter-occupied


- Rooms in owner-occupied houses and condos in Tower District
- 01 room
- 02 rooms
- 63 rooms
- 284 rooms
- 665 rooms
- 626 rooms
- 307 rooms
- 548 rooms
- 259+ rooms

- Rooms in renter-occupied apartments in Tower District
- 1531 room
- 292 rooms
- 623 rooms
- 584 rooms
- 365 rooms
- 186 rooms
- 537 rooms
- 1148 rooms
- 279+ rooms
Owner-occupied
Renter-occupied

- Bedrooms in owner-occupied houses and condos in Tower District
- 0no bedroom
- 111 bedroom
- 382 bedrooms
- 973 bedrooms
- 474 bedrooms
- 325+ bedrooms
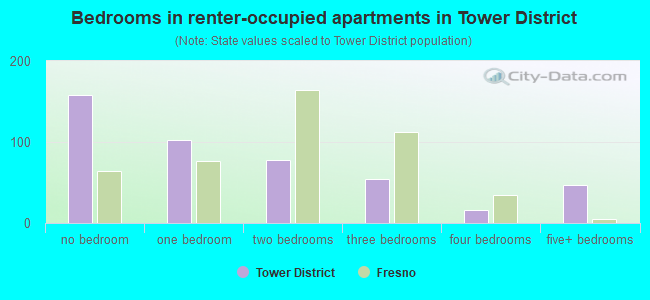
- Bedrooms in renter-occupied apartments in Tower District
- 158no bedroom
- 1031 bedroom
- 782 bedrooms
- 543 bedrooms
- 164 bedrooms
- 475+ bedrooms
Average number of cars or other vehicles available in houses/condos:
Average number of cars or other vehicles available in apartments:
| This neighborhood: | 2.4 |
| Fresno: | 2.1 |
Average number of cars or other vehicles available in apartments:
| Here: | 1.4 |
| city: | 1.5 |
Percentage of units with a mortgage:
| Tower District: | 72.9% |
| Fresno: | 67.5% |
Average estimated value of detached houses in 2022 (43.7% of all units):
| Tower District: | $263,067 |
| Fresno: | $404,942 |

- Year house built in Tower District
- 02020 or later
- 832010 to 2019
- 682000 to 2009
- 51990 to 1999
- 111980 to 1989
- 151970 to 1979
- 321960 to 1969
- 431950 to 1959
- 1151940 to 1949
- 3101939 or earlier

City-data.com crime index for city in 2020 (higher means more crime):
| City: | 351.9 |
| U.S. average: | 219.5 |
Travel time to work (commute)
![Travel time to work (commute)]()
- 24Less than 5 minutes
- 1035 to 9 minutes
- 15910 to 14 minutes
- 12215 to 19 minutes
- 12820 to 24 minutes
- 1925 to 29 minutes
- 2130 to 34 minutes
- 735 to 39 minutes
- 6645 to 59 minutes
- 2860 to 89 minutes
- 1090 or more minutes

Means of transportation to work
![Means of transportation to work]()
- 65.0%460Drove a car alone
- 4.9%35Carpooled
- 3.0%21Bus
- 0.1%1Subway or elevated rail
- 8.5%60Bicycle
- 17.7%125Walked
- 2.3%16Other means
- 12.1%86Worked at home

Time leaving home to go to work
![Time leaving home to go to work]()
- 5612:00 a.m. to 4:59 a.m.
- 105:00 a.m. to 5:29 a.m.
- 45:30 a.m. to 5:59 a.m.
- 446:00 a.m. to 6:29 a.m.
- 486:30 a.m. to 6:59 a.m.
- 1107:00 a.m. to 7:29 a.m.
- 1097:30 a.m. to 7:59 a.m.
- 1338:00 a.m. to 8:29 a.m.
- 168:30 a.m. to 8:59 a.m.
- 209:00 a.m. to 9:59 a.m.
- 810:00 a.m. to 10:59 a.m.
- 511:00 a.m. to 11:59 a.m.
- 6612:00 p.m. to 3:59 p.m.
- 214:00 p.m. to 11:59 p.m.

Occupations of males:
- Percentage of males in management occupations (except farmers):
Here: 22.5% city: 8.7%
- Percentage of males in business and financial operations occupations:
Here: 1.9% city: 3.8%
- Percentage of males in computer and mathematical occupations:
Here: 2.8% city: 2.6%
- Percentage of males in community and social services occupations:
Here: 2.0% city: 1.7%
- Percentage of males in legal occupations:
Here: 4.5% city: 0.9%
- Percentage of males in education, training, and library occupations:
Here: 3.1% city: 3.8%
- Percentage of males in arts, design, entertainment, sports, and media occupations:
Here: 1.4% city: 1.8%
- Percentage of males in healthcare practitioners and technical occupations:
Here: 2.8% city: 3.3%
- Percentage of males in service occupations:
Here: 24.1% city: 17.7%
- Percentage of males in sales and office occupations:
Here: 14.7% city: 15.8%
- Percentage of males in farming, fishing, and forestry occupations:
Here: 2.7% city: 4.3%
- Percentage of males in construction, extraction, and maintenance occupations:
Here: 10.1% city: 8.5%
- Percentage of males in production occupations:
Here: 3.0% city: 6.6%
- Percentage of males in transportation occupations:
Here: 3.3% city: 7.4%
Occupations of females:
- Percentage of females in management occupations (except farmers):
Here: 12.5% city: 8.1%
- Percentage of females in business and financial operations occupations:
Here: 2.6% city: 5.2%
- Percentage of females in life, physical, and social science occupations:
Here: 1.2% city: 0.8%
- Percentage of females in community and social services occupations:
Here: 3.2% city: 3.2%
- Percentage of females in education, training, and library occupations:
Here: 11.1% city: 8.5%
- Percentage of females in arts, design, entertainment, sports, and media occupations:
Here: 5.8% city: 1.5%
- Percentage of females in healthcare practitioners and technical occupations:
Here: 4.8% city: 8.3%
- Percentage of females in service occupations:
Here: 30.2% city: 24.6%
- Percentage of females in sales and office occupations:
Here: 22.4% city: 27.4%
- Percentage of females in production occupations:
Here: 1.2% city: 3.0%
- Percentage of females in transportation occupations:
Here: 4.8% city: 1.2%
Education in this neighborhood (subdivision or community):
- Percentage of people 3 years and older in K-12 schools:
Tower District: 34.4% Fresno: 21.3%
- Percentage of people 3 years and older in undergraduate colleges:
Tower District: 9.1% Fresno: 6.4%
- Percentage of people 3 years and older in grad. or professional schools:
Tower District: 6.7% Fresno: 1.3%
- Percentage of students K-12 enrolled in private schools:
Tower District: 33.0% Fresno: 5.1%
Percentage of population below poverty level:
| Tower District: | 22.6% |
| Fresno: | 20.6% |
Median year owner moved in (as recorded in 2022):
Median year renter moved in (as recorded in 2022):
| Tower District: | 2007 |
| Fresno: | 2013 |
Median year renter moved in (as recorded in 2022):
| Tower District: | 2015 |
| Fresno: | 2019 |
Percentage of married-couple families with both working:
| Tower District: | 72.7% |
| Fresno: | 60.2% |

- 52.6%Utility gas
- 21.4%Electricity
- 7.3%No fuel used
- 6.2%Wood
- 6.0%Other fuel
- 2.7%Bottled, tank, or LP gas
- 2.2%Fuel oil, kerosene, etc.
- 1.6%Solar energy
Roads and streets:
E Olive Ave
Length: 0.58 miles
Direction: E-W
Address range: 400 to 1099
Direction: E-W
Address range: 400 to 1099
N Van Ness Ave
Length: 0.57 miles
Direction: N-S
Address range: 1100 to 1599
Direction: N-S
Address range: 1100 to 1599
N Maroa Ave
Length: 0.45 miles
Direction: N-S
Address range: 1200 to 1550
Direction: N-S
Address range: 1200 to 1550
N Wishon Ave
Length: 0.45 miles
Direction: N-S
Address range: 1200 to 1550
Direction: N-S
Address range: 1200 to 1550
E Hedges Ave
Length: 0.31 miles
Direction: E-W
Address range: 700 to 1099
Direction: E-W
Address range: 700 to 1099
E Floradora Ave
Length: 0.31 miles
Direction: E-W
Address range: 711 to 1099
Direction: E-W
Address range: 711 to 1099
N Linden Ave
Length: 0.25 miles
Direction: N-S
Address range: 1200 to 1399
Direction: N-S
Address range: 1200 to 1399
E Home Ave
Length: 0.22 miles
Directions: E-W, SE-NW
Address range: 800 to 1099
Directions: E-W, SE-NW
Address range: 800 to 1099
E Fern Ave
Length: 0.19 miles
Direction: E-W
Address range: 700 to 899
Direction: E-W
Address range: 700 to 899
E Alhambra Ave
Length: 0.19 miles
Direction: E-W
Address range: 900 to 1099
Direction: E-W
Address range: 900 to 1099
N College Ave
Length: 0.13 miles
Direction: N-S
Address range: 1400 to 1499
Direction: N-S
Address range: 1400 to 1499
E Carmen Ave
Length: 0.10 miles
Direction: E-W
Address range: 800 to 899
Direction: E-W
Address range: 800 to 899
E Pine Ave
Length: 0.10 miles
Direction: E-W
Address range: 800 to 899
Direction: E-W
Address range: 800 to 899
N Fulton St
Length: 0.07 miles
Direction: N-S
Address range: 1100 to 1199
Direction: N-S
Address range: 1100 to 1199