Upper Tacoma District neighborhood in Tacoma, Washington (WA), 98405 detailed profile
Settings
X


Business Search - 14 Million verified businesses
Area: 1.356 square miles
Population: 13,758
Population density:
| Upper Tacoma District: | 10,149 people per square mile |
| Tacoma: | 4,429 people per square mile |

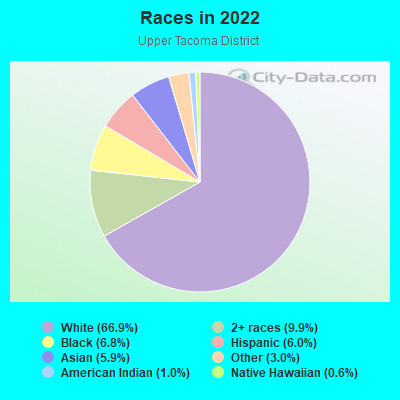
- 9,70866.9%White
- 1,4309.9%Two or more races
- 9816.8%Black
- 8646.0%Hispanic or Latino
- 8635.9%Asian
- 4373.0%Some other race
- 1491.0%American Indian
- 830.6%Native Hawaiian and Other
Pacific Islander
Median household income in 2022:
| Upper Tacoma District: | $90,053 |
| Tacoma: | $80,784 |
Distribution of median household income
![Distribution of median household income]()
- 131Less than $10,000
- 624$10,000 to $19,999
- 876$20,000 to $29,999
- 636$30,000 to $39,999
- 728$40,000 to $49,999
- 388$50,000 to $59,999
- 470$60,000 to $74,999
- 1,117$75,000 to $99,999
- 843$100,000 to $124,999
- 452$125,000 to $149,999
- 614$150,000 to $199,999
- 447$200,000 or more

Distribution of owner-occupied house/condo value
![Distribution of owner-occupied house/condo value]()
- 119Less than $50,000
- 97$50,000 to $99,999
- 199$100,000 to $149,999
- 266$150,000 to $199,999
- 338$200,000 to $249,999
- 350$250,000 to $299,999
- 1,417$300,000 to $399,999
- 1,336$400,000 to $499,999
- 855$500,000 to $749,999
- 226$750,000 to $999,999
- 196$1,000,000 or more

Distribution of rent paid by renters
![Distribution of rent paid by renters]()
- 51Less than $100
- 272$100 to $199
- 217$200 to $299
- 253$300 to $399
- 178$400 to $499
- 108$500 to $599
- 63$600 to $699
- 242$700 to $799
- 405$800 to $899
- 722$900 to $999
- 690$1,000 to $1,249
- 310$1,250 to $1,499
- 429$1,500 to $1,999
- 525$2,000 or more

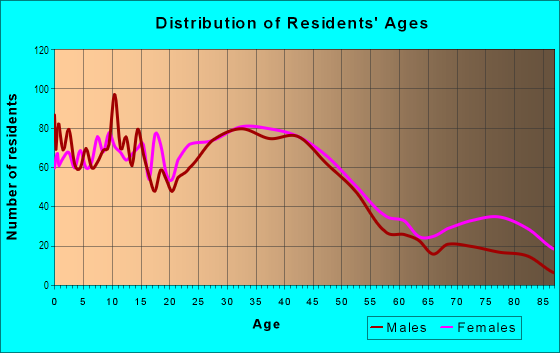
| Males: | 7,161 |
| Females: | 6,597 |
Males:
| This neighborhood: | 40.7 years |
| Whole city: | 36.0 years |
| This neighborhood: | 38.5 years |
| Whole city: | 38.1 years |
Average household size:
| Upper Tacoma District: | 3.0 people |
| Tacoma: | 2.4 people |
Percentage of family households:
| Upper Tacoma District: | 49.6% |
| Tacoma: | 43.7% |
| Here: | 48.3% |
| Tacoma: | 39.9% |
Percentage of married-couple families with children (among all households):
| Upper Tacoma District: | 35.2% |
| Tacoma: | 27.8% |
Percentage of single-mother households (among all households):
| Upper Tacoma District: | 7.1% |
| Tacoma: | 8.6% |
Percentage of never married males 15 years old and over:
Percentage of never married females 15 years old and over:
| Upper Tacoma District: | 19.8% |
| Tacoma: | 20.8% |
Percentage of never married females 15 years old and over:
| Upper Tacoma District: | 12.7% |
| city: | 17.5% |
Percentage of people that speak English not well or not at all:
| Upper Tacoma District: | 0.6% |
| Tacoma: | 3.1% |
Percentage of people born in this state:
Percentage of people born in another U.S. state:
Percentage of native residents but born outside the U.S.:
Percentage of foreign born residents:
| Here: | 45.3% |
| Tacoma: | 48.7% |
Percentage of people born in another U.S. state:
| Upper Tacoma District: | 42.5% |
| Tacoma: | 37.0% |
Percentage of native residents but born outside the U.S.:
| Here: | 2.4% |
| city: | 2.4% |
Percentage of foreign born residents:
| Here: | 9.8% |
| Tacoma: | 12.0% |
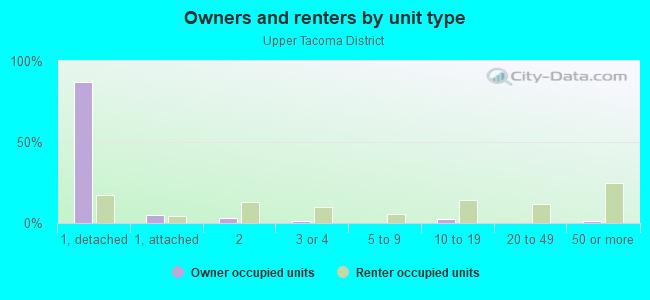
Owner-occupied
Renter-occupied

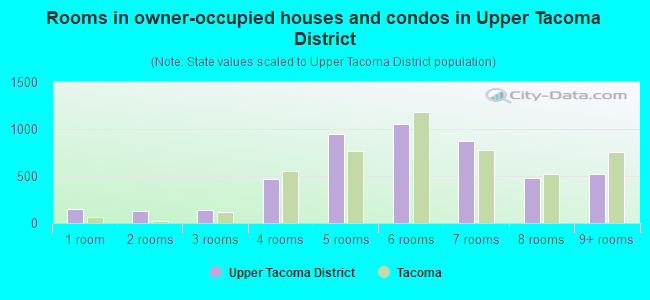
- Rooms in owner-occupied houses and condos in Upper Tacoma District
- 1481 room
- 1252 rooms
- 1343 rooms
- 4634 rooms
- 9515 rooms
- 1,0556 rooms
- 8757 rooms
- 4798 rooms
- 5209+ rooms
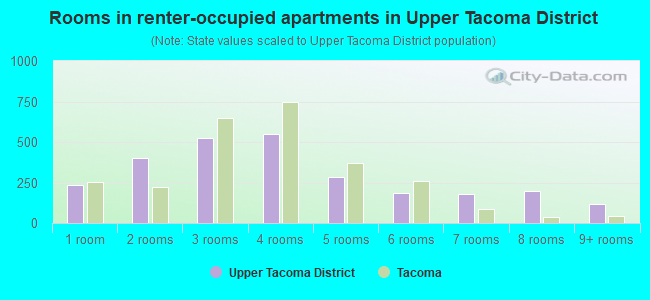
- Rooms in renter-occupied apartments in Upper Tacoma District
- 2331 room
- 4022 rooms
- 5263 rooms
- 5474 rooms
- 2815 rooms
- 1876 rooms
- 1797 rooms
- 1978 rooms
- 1189+ rooms
Owner-occupied
Renter-occupied
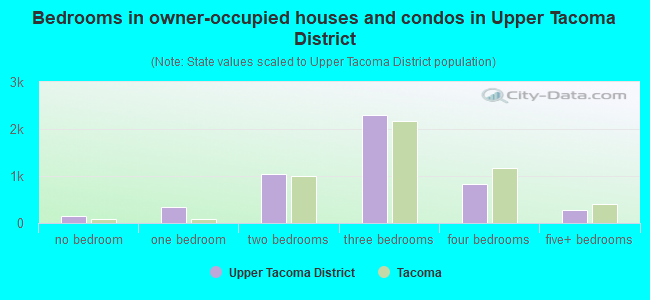
- Bedrooms in owner-occupied houses and condos in Upper Tacoma District
- 148no bedroom
- 3361 bedroom
- 1,0372 bedrooms
- 2,2883 bedrooms
- 8314 bedrooms
- 2775+ bedrooms
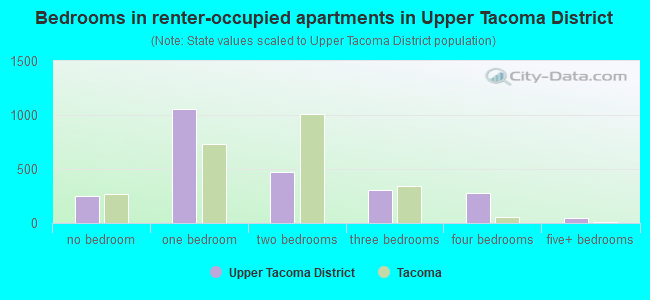
- Bedrooms in renter-occupied apartments in Upper Tacoma District
- 251no bedroom
- 1,0571 bedroom
- 4692 bedrooms
- 3053 bedrooms
- 2814 bedrooms
- 485+ bedrooms
Average number of cars or other vehicles available in houses/condos:
Average number of cars or other vehicles available in apartments:
| This neighborhood: | 2.1 |
| Tacoma: | 2.2 |
Average number of cars or other vehicles available in apartments:
| Here: | 1.5 |
| city: | 1.2 |
Percentage of units with a mortgage:
| Upper Tacoma District: | 80.2% |
| Tacoma: | 72.4% |
Average estimated value of detached houses in 2022 (84.3% of all units):
| Upper Tacoma District: | $434,297 |
| Washington: | $734,307 |
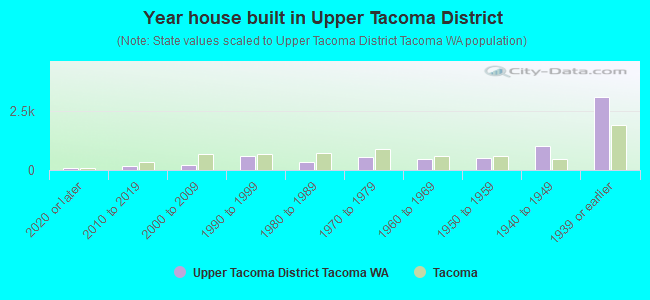
- Year house built in Upper Tacoma District
- 862020 or later
- 1532010 to 2019
- 1972000 to 2009
- 5881990 to 1999
- 3321980 to 1989
- 5491970 to 1979
- 4621960 to 1969
- 5191950 to 1959
- 1,0411940 to 1949
- 3,0981939 or earlier
City-data.com crime index for city in 2020 (higher means more crime):
| City: | 532.7 |
| U.S. average: | 219.5 |
Travel time to work (commute)
![Travel time to work (commute)]()
- 41Less than 5 minutes
- 3935 to 9 minutes
- 75610 to 14 minutes
- 42715 to 19 minutes
- 29720 to 24 minutes
- 14825 to 29 minutes
- 43330 to 34 minutes
- 13235 to 39 minutes
- 7640 to 44 minutes
- 55245 to 59 minutes
- 26260 to 89 minutes
- 22390 or more minutes

Means of transportation to work
![Means of transportation to work]()
- 62.8%4,836Drove a car alone
- 7.8%603Carpooled
- 2.8%214Bus
- 6.3%484Long-distance train or commuter rail
- 0.6%50Light rail, streetcar or trolley
- 4.1%316Motorcycle
- 2.2%170Bicycle
- 6.3%486Walked
- 5.1%395Other means
- 21.2%1,631Worked at home

Time leaving home to go to work
![Time leaving home to go to work]()
- 29812:00 a.m. to 4:59 a.m.
- 1145:00 a.m. to 5:29 a.m.
- 1525:30 a.m. to 5:59 a.m.
- 2706:00 a.m. to 6:29 a.m.
- 4696:30 a.m. to 6:59 a.m.
- 3977:00 a.m. to 7:29 a.m.
- 3697:30 a.m. to 7:59 a.m.
- 3488:00 a.m. to 8:29 a.m.
- 2218:30 a.m. to 8:59 a.m.
- 2429:00 a.m. to 9:59 a.m.
- 12310:00 a.m. to 10:59 a.m.
- 2811:00 a.m. to 11:59 a.m.
- 23812:00 p.m. to 3:59 p.m.
- 2014:00 p.m. to 11:59 p.m.

Occupations of males:
- Percentage of males in management occupations (except farmers):
Here: 10.4% city: 9.1%
- Percentage of males in business and financial operations occupations:
Here: 2.7% city: 5.1%
- Percentage of males in computer and mathematical occupations:
Here: 3.7% city: 4.4%
- Percentage of males in architecture and engineering occupations:
Here: 3.4% city: 2.7%
- Percentage of males in life, physical, and social science occupations:
Here: 3.4% city: 0.7%
- Percentage of males in legal occupations:
Here: 2.0% city: 1.1%
- Percentage of males in education, training, and library occupations:
Here: 6.4% city: 3.2%
- Percentage of males in arts, design, entertainment, sports, and media occupations:
Here: 2.2% city: 1.3%
- Percentage of males in healthcare practitioners and technical occupations:
Here: 1.5% city: 3.5%
- Percentage of males in service occupations:
Here: 11.6% city: 15.1%
- Percentage of males in sales and office occupations:
Here: 17.7% city: 13.9%
- Percentage of males in construction, extraction, and maintenance occupations:
Here: 8.7% city: 9.4%
- Percentage of males in production occupations:
Here: 4.0% city: 6.3%
- Percentage of males in transportation occupations:
Here: 1.8% city: 7.7%
- Percentage of males in material moving occupations:
Here: 17.8% city: 8.1%
Occupations of females:
- Percentage of females in management occupations (except farmers):
Here: 6.4% city: 9.6%
- Percentage of females in business and financial operations occupations:
Here: 10.0% city: 7.0%
- Percentage of females in computer and mathematical occupations:
Here: 3.7% city: 1.9%
- Percentage of females in community and social services occupations:
Here: 4.3% city: 3.4%
- Percentage of females in education, training, and library occupations:
Here: 10.0% city: 10.0%
- Percentage of females in arts, design, entertainment, sports, and media occupations:
Here: 3.5% city: 1.8%
- Percentage of females in healthcare practitioners and technical occupations:
Here: 10.2% city: 9.0%
- Percentage of females in service occupations:
Here: 14.5% city: 20.7%
- Percentage of females in sales and office occupations:
Here: 32.7% city: 25.0%
- Percentage of females in production occupations:
Here: 1.5% city: 2.5%
- Percentage of females in transportation occupations:
Here: 1.2% city: 1.7%
Percentage of people 16-64 in Armed Forces:
| Upper Tacoma District: | 0.9% |
| Tacoma: | 1.4% |
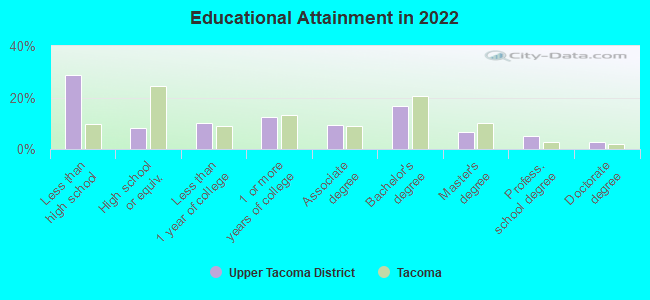
Education in this neighborhood (subdivision or community):
- Percentage of people 3 years and older in K-12 schools:
Upper Tacoma District: 16.7% Tacoma: 14.0%
- Percentage of people 3 years and older in undergraduate colleges:
Upper Tacoma District: 5.8% Tacoma: 5.4%
- Percentage of people 3 years and older in grad. or professional schools:
Upper Tacoma District: 5.9% Tacoma: 1.6%
- Percentage of students K-12 enrolled in private schools:
Upper Tacoma District: 68.4% Tacoma: 12.6%
Percentage of population below poverty level:
| Upper Tacoma District: | 8.3% |
| Tacoma: | 14.2% |
Median year owner moved in (as recorded in 2022):
| Upper Tacoma District: | 2009 |
| Tacoma: | 2013 |
Percentage of married-couple families with both working:
| Upper Tacoma District: | 95.7% |
| Tacoma: | 65.1% |
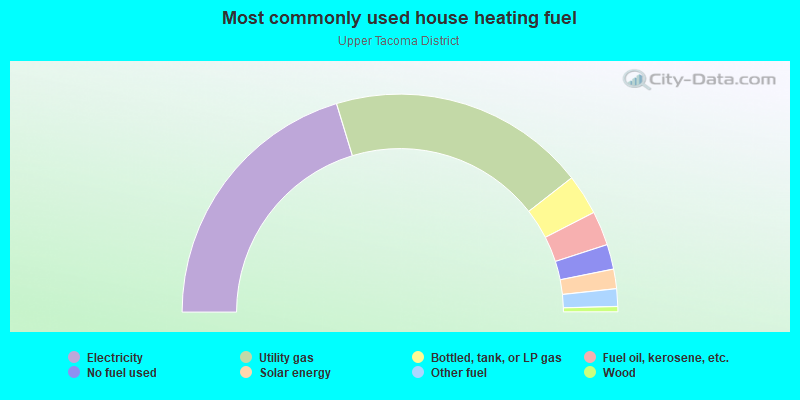
- 40.6%Electricity
- 38.3%Utility gas
- 6.0%Bottled, tank, or LP gas
- 5.1%Fuel oil, kerosene, etc.
- 3.7%No fuel used
- 2.9%Solar energy
- 2.6%Other fuel
- 0.8%Wood
Roads and streets:
S 12th St
Length: 2.17 miles
Direction: E-W
Address range: 2000 to 4299
Direction: E-W
Address range: 2000 to 4299
S 19th St
Length: 2.05 miles
Direction: E-W
Address range: 2017 to 3899
Direction: E-W
Address range: 2017 to 3899
S 7th St
Length: 1.82 miles
Directions: E-W, SE-NW
Address range: 2000 to 4299
Directions: E-W, SE-NW
Address range: 2000 to 4299
S 15th St
Length: 1.78 miles
Direction: E-W
Address range: 2200 to 4299
Direction: E-W
Address range: 2200 to 4299
S 11th St
Length: 1.72 miles
Directions: E-W, SW-NE
Address range: 2000 to 4310
Directions: E-W, SW-NE
Address range: 2000 to 4310
S 8th St
Length: 1.72 miles
Direction: E-W
Address range: 2000 to 3899
Direction: E-W
Address range: 2000 to 3899
S 17th St
Length: 1.71 miles
Direction: E-W
Address range: 2200 to 4299
Direction: E-W
Address range: 2200 to 4299
S 14th St
Length: 1.70 miles
Direction: E-W
Address range: 2000 to 4299
Direction: E-W
Address range: 2000 to 4299
S 10th St
Length: 1.58 miles
Direction: E-W
Address range: 2000 to 3899
Direction: E-W
Address range: 2000 to 3899
6th Ave
Length: 1.34 miles
Direction: E-W
Address range: 3000 to 4299
Direction: E-W
Address range: 3000 to 4299
S 13th St
Length: 1.13 miles
Direction: E-W
Address range: 2300 to 4299
Direction: E-W
Address range: 2300 to 4299
S Melrose St
Length: 1.04 miles
Direction: E-W
Address range: 2200 to 3599
Direction: E-W
Address range: 2200 to 3599
S 9th St
Length: 1.02 miles
Direction: E-W
Address range: 2900 to 3899
Direction: E-W
Address range: 2900 to 3899
S 18th St
Length: 0.87 miles
Direction: E-W
Address range: 2900 to 3799
Direction: E-W
Address range: 2900 to 3799
S Union Ave
Length: 0.87 miles
Directions: N-S, SE-NW
Address range: 600 to 1899
Directions: N-S, SE-NW
Address range: 600 to 1899
S Adams St
Length: 0.87 miles
Directions: N-S, SW-NE
Address range: 600 to 1899
Directions: N-S, SW-NE
Address range: 600 to 1899
S Washington St
Length: 0.86 miles
Direction: N-S
Address range: 600 to 1899
Direction: N-S
Address range: 600 to 1899
S Proctor St
Length: 0.86 miles
Direction: N-S
Address range: 600 to 1899
Direction: N-S
Address range: 600 to 1899
S State St
Length: 0.81 miles
Direction: N-S
Address range: 700 to 1899
Direction: N-S
Address range: 700 to 1899
S Cedar St
Length: 0.80 miles
Direction: N-S
Address range: 600 to 1899
Direction: N-S
Address range: 600 to 1899
S Fife St
Length: 0.80 miles
Directions: N-S, SW-NE
Address range: 700 to 1899
Directions: N-S, SW-NE
Address range: 700 to 1899
S Pine St
Length: 0.80 miles
Direction: N-S
Address range: 700 to 1899
Direction: N-S
Address range: 700 to 1899
S Oakes St
Length: 0.80 miles
Directions: N-S, SW-NE
Address range: 700 to 1899
Directions: N-S, SW-NE
Address range: 700 to 1899
S Puget Sound Ave
Length: 0.79 miles
Direction: N-S
Address range: 600 to 1601
Direction: N-S
Address range: 600 to 1601
S Tyler St
Length: 0.79 miles
Direction: N-S
Address range: 700 to 1899
Direction: N-S
Address range: 700 to 1899
S Madison St
Length: 0.78 miles
Direction: N-S
Address range: 600 to 1799
Direction: N-S
Address range: 600 to 1799
S Alder St
Length: 0.76 miles
Directions: N-S, SE-NW
Address range: 600 to 1699
Directions: N-S, SE-NW
Address range: 600 to 1699
S Prospect St
Length: 0.75 miles
Direction: N-S
Address range: 800 to 1899
Direction: N-S
Address range: 800 to 1899
S 16th St
Length: 0.75 miles
Direction: E-W
Address range: 2300 to 4225
Direction: E-W
Address range: 2300 to 4225
S Monroe St
Length: 0.73 miles
Direction: N-S
Address range: 600 to 1758
Direction: N-S
Address range: 600 to 1758
S Lawrence St
Length: 0.70 miles
Direction: N-S
Address range: 600 to 1899
Direction: N-S
Address range: 600 to 1899
S Mason Ave
Length: 0.63 miles
Directions: E-W, N-S, SE-NW, SW-NE
Address range: 600 to 1699
Directions: E-W, N-S, SE-NW, SW-NE
Address range: 600 to 1699
S Junett St
Length: 0.60 miles
Direction: N-S
Address range: 600 to 1539
Direction: N-S
Address range: 600 to 1539
S Anderson St
Length: 0.55 miles
Directions: N-S, SW-NE
Address range: 700 to 1899
Directions: N-S, SW-NE
Address range: 700 to 1899
S Trafton St
Length: 0.55 miles
Direction: N-S
Address range: 800 to 1699
Direction: N-S
Address range: 800 to 1699
S Durango St
Length: 0.51 miles
Directions: N-S, SE-NW, SW-NE
Address range: 1200 to 1899
Directions: N-S, SE-NW, SW-NE
Address range: 1200 to 1899
S Sprague Ave
Length: 0.47 miles
Direction: N-S
Address range: 650 to 1398
Direction: N-S
Address range: 650 to 1398
S Ferry St
Length: 0.39 miles
Directions: E-W, N-S, SE-NW, SW-NE
Address range: 800 to 1399
Directions: E-W, N-S, SE-NW, SW-NE
Address range: 800 to 1399
S Warner St
Length: 0.28 miles
Direction: N-S
Address range: 600 to 1199
Direction: N-S
Address range: 600 to 1199
S Steele St
Length: 0.25 miles
Direction: N-S
Address range: 800 to 1199
Direction: N-S
Address range: 800 to 1199
Kellogg St
Length: 0.21 miles
Direction: E-W
Address range: 2600 to 2899
Direction: E-W
Address range: 2600 to 2899
S Pierce St
Length: 0.07 miles
Directions: N-S, SE-NW
Address range: 1000 to 1099
Directions: N-S, SE-NW
Address range: 1000 to 1099
S West Union Ave
Length: 0.07 miles
Direction: N-S
Direction: N-S
S Cedar St (Alder St Rmp)
Length: 0.06 miles
Directions: N-S, SE-NW
Address range: 900 to 999
Directions: N-S, SE-NW
Address range: 900 to 999
Eldon St
Length: 0.06 miles
Directions: E-W, N-S, SE-NW
Address range: 4211 to 4231
Directions: E-W, N-S, SE-NW
Address range: 4211 to 4231
S Eldon St
Length: 0.04 miles
Direction: E-W
Direction: E-W