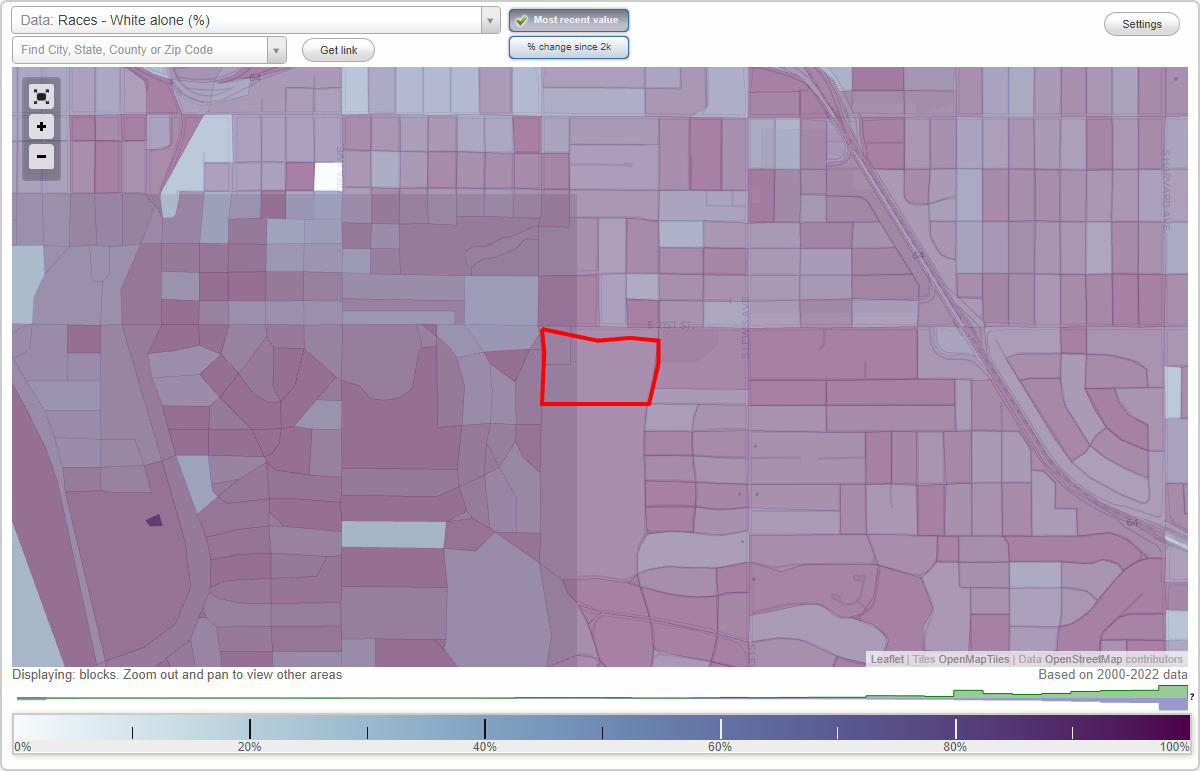
Utica Square neighborhood in Tulsa, Oklahoma (OK), 74114 detailed profile
Settings
X

Business Search - 14 Million verified businesses
Area: 0.043 square miles
Population: 88
Population density:
| Utica Square: | 2,038 people per square mile |
| Tulsa: | 2,262 people per square mile |

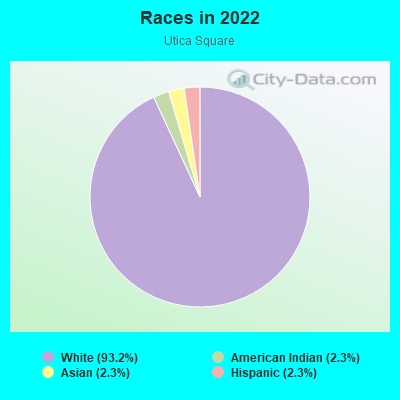
- 8293.2%White
- 22.3%American Indian
- 22.3%Asian
- 22.3%Hispanic or Latino
Median household income in 2022:
| Utica Square: | $250,001 |
| Tulsa: | $54,040 |
Distribution of median household income
![Distribution of median household income]()
- 1Less than $10,000
- 1$10,000 to $19,999
- 2$20,000 to $29,999
- 1$30,000 to $39,999
- 1$40,000 to $49,999
- 2$50,000 to $59,999
- 1$60,000 to $74,999
- 3$75,000 to $99,999
- 3$100,000 to $124,999
- 3$125,000 to $149,999
- 4$150,000 to $199,999
- 22$200,000 or more

Distribution of owner-occupied house/condo value
![Distribution of owner-occupied house/condo value]()
- 1Less than $50,000
- 1$50,000 to $99,999
- 1$100,000 to $149,999
- 1$250,000 to $299,999
- 6$300,000 to $399,999
- 3$400,000 to $499,999
- 7$500,000 to $749,999
- 5$750,000 to $999,999
- 15$1,000,000 or more

Distribution of rent paid by renters
![Distribution of rent paid by renters]()
- 1$800 to $899
- 1$1,000 to $1,249
- 1$1,500 to $1,999
- 2$2,000 or more

Median rent in 2022:
| Utica Square: | $2,194 |
| Tulsa: | $802 |
| Males: | 42 |
| Females: | 46 |
Males:
| This neighborhood: | 51.3 years |
| Whole city: | 34.8 years |
| This neighborhood: | 53.0 years |
| Whole city: | 36.7 years |
Average household size:
| Utica Square: | 2.4 people |
| Tulsa: | 2.3 people |
Percentage of family households:
| Utica Square: | 35.4% |
| Tulsa: | 40.9% |
| Here: | 67.6% |
| Tulsa: | 36.4% |
Percentage of married-couple families with children (among all households):
| Utica Square: | 35.6% |
| Tulsa: | 26.0% |
Percentage of single-mother households (among all households):
| Utica Square: | 2.3% |
| Tulsa: | 13.4% |
Percentage of never married males 15 years old and over:
Percentage of never married females 15 years old and over:
| Utica Square: | 11.8% |
| Tulsa: | 19.4% |
Percentage of never married females 15 years old and over:
| Utica Square: | 9.0% |
| city: | 17.6% |
Percentage of people that speak English not well or not at all:
| Utica Square: | 0.0% |
| Tulsa: | 5.0% |
Percentage of people born in this state:
Percentage of people born in another U.S. state:
Percentage of native residents but born outside the U.S.:
Percentage of foreign born residents:
| Here: | 51.7% |
| Tulsa: | 55.7% |
Percentage of people born in another U.S. state:
| Utica Square: | 42.7% |
| Tulsa: | 31.1% |
Percentage of native residents but born outside the U.S.:
| Here: | 1.9% |
| city: | 1.3% |
Percentage of foreign born residents:
| Here: | 3.7% |
| Tulsa: | 11.8% |
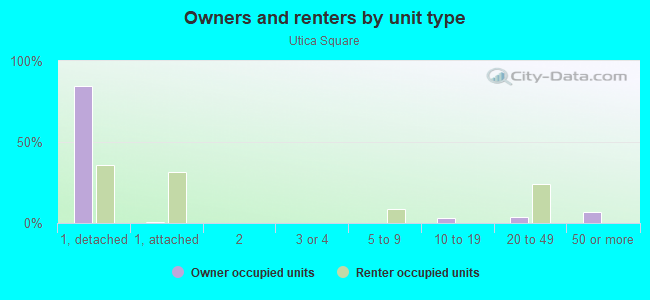
Owner-occupied
Renter-occupied

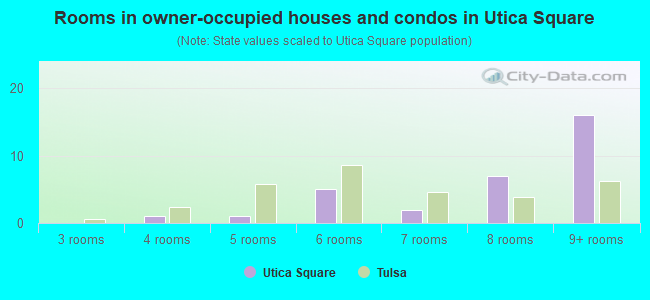
- Rooms in owner-occupied houses and condos in Utica Square
- 01 room
- 02 rooms
- 03 rooms
- 14 rooms
- 15 rooms
- 56 rooms
- 27 rooms
- 78 rooms
- 169+ rooms
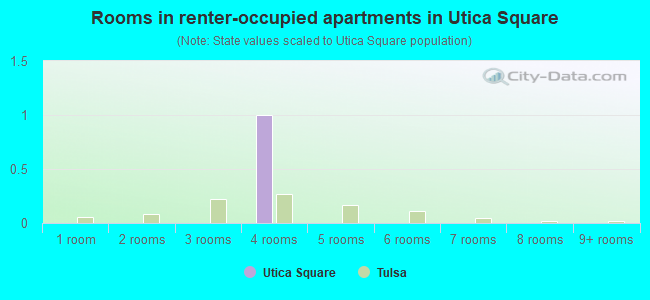
- Rooms in renter-occupied apartments in Utica Square
- 01 room
- 02 rooms
- 03 rooms
- 14 rooms
- 05 rooms
- 06 rooms
- 07 rooms
- 08 rooms
- 09+ rooms
Owner-occupied
Renter-occupied
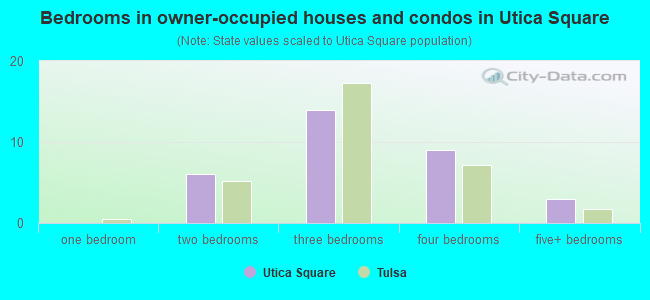
- Bedrooms in owner-occupied houses and condos in Utica Square
- 0no bedroom
- 01 bedroom
- 62 bedrooms
- 143 bedrooms
- 94 bedrooms
- 35+ bedrooms
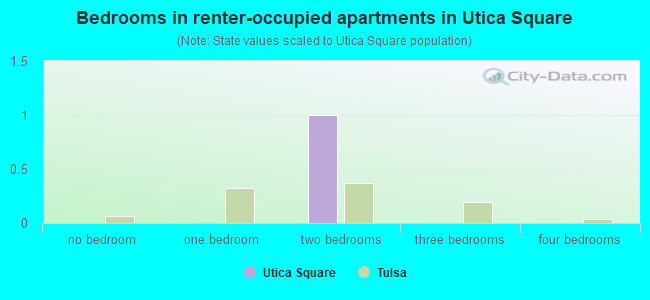
- Bedrooms in renter-occupied apartments in Utica Square
- 0no bedroom
- 01 bedroom
- 12 bedrooms
- 03 bedrooms
- 04 bedrooms
- 05+ bedrooms
Average number of cars or other vehicles available in houses/condos:
Average number of cars or other vehicles available in apartments:
| This neighborhood: | 2.3 |
| Tulsa: | 2.0 |
Average number of cars or other vehicles available in apartments:
| Here: | 1.4 |
| city: | 1.3 |
Percentage of units with a mortgage:
| Utica Square: | 50.4% |
| Tulsa: | 57.3% |
Housing prices:
- Average estimated value of detached houses in 2022 (81.0% of all units):
Utica Square: $1,089,504 Tulsa: $257,171
- Average estimated '22 value of housing units in 5-or-more-unit structures (9.5% of all units):
Utica Square: $666,328 Tulsa: $166,905
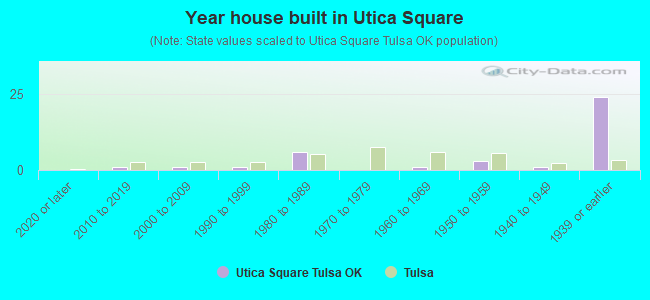
- Year house built in Utica Square
- 02020 or later
- 12010 to 2019
- 12000 to 2009
- 11990 to 1999
- 61980 to 1989
- 01970 to 1979
- 11960 to 1969
- 31950 to 1959
- 11940 to 1949
- 241939 or earlier
Travel time to work (commute)
![Travel time to work (commute)]()
- 1Less than 5 minutes
- 85 to 9 minutes
- 810 to 14 minutes
- 715 to 19 minutes
- 120 to 24 minutes

Means of transportation to work
![Means of transportation to work]()
- 71.4%27Drove a car alone
- 2.6%1Carpooled
- 2.6%1Walked
- 18.5%7Worked at home

Time leaving home to go to work
![Time leaving home to go to work]()
- 26:00 a.m. to 6:29 a.m.
- 26:30 a.m. to 6:59 a.m.
- 37:00 a.m. to 7:29 a.m.
- 87:30 a.m. to 7:59 a.m.
- 58:00 a.m. to 8:29 a.m.
- 28:30 a.m. to 8:59 a.m.
- 49:00 a.m. to 9:59 a.m.

Occupations of males:
- Percentage of males in management occupations (except farmers):
Here: 31.8% city: 10.6%
- Percentage of males in business and financial operations occupations:
Here: 6.8% city: 4.9%
- Percentage of males in computer and mathematical occupations:
Here: 3.2% city: 3.7%
- Percentage of males in architecture and engineering occupations:
Here: 7.5% city: 3.1%
- Percentage of males in life, physical, and social science occupations:
Here: 1.1% city: 0.6%
- Percentage of males in community and social services occupations:
Here: 2.5% city: 1.6%
- Percentage of males in legal occupations:
Here: 12.9% city: 1.6%
- Percentage of males in education, training, and library occupations:
Here: 3.2% city: 3.0%
- Percentage of males in arts, design, entertainment, sports, and media occupations:
Here: 1.6% city: 2.0%
- Percentage of males in healthcare practitioners and technical occupations:
Here: 16.1% city: 4.0%
- Percentage of males in service occupations:
Here: 2.1% city: 13.9%
- Percentage of males in sales and office occupations:
Here: 13.9% city: 15.7%
Occupations of females:
- Percentage of females in management occupations (except farmers):
Here: 19.5% city: 8.3%
- Percentage of females in computer and mathematical occupations:
Here: 2.2% city: 1.4%
- Percentage of females in life, physical, and social science occupations:
Here: 3.3% city: 0.6%
- Percentage of females in legal occupations:
Here: 10.1% city: 1.7%
- Percentage of females in education, training, and library occupations:
Here: 10.7% city: 8.0%
- Percentage of females in arts, design, entertainment, sports, and media occupations:
Here: 3.1% city: 2.3%
- Percentage of females in healthcare practitioners and technical occupations:
Here: 12.6% city: 9.2%
- Percentage of females in service occupations:
Here: 1.6% city: 21.8%
- Percentage of females in sales and office occupations:
Here: 36.5% city: 28.9%
- Percentage of females in farming, fishing, and forestry occupations:
Here: 3.1% city: 0.1%
- Percentage of females in production occupations:
Here: 1.4% city: 3.2%
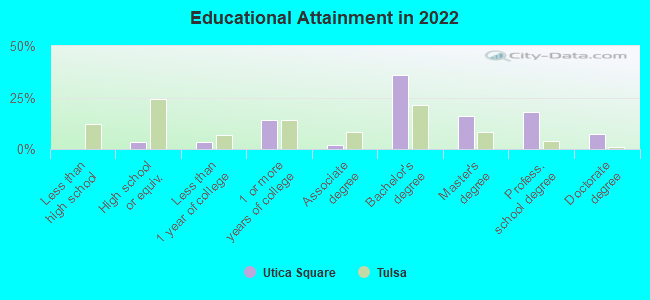
Education in this neighborhood (subdivision or community):
- Percentage of people 3 years and older in K-12 schools:
Utica Square: 17.2% Tulsa: 17.8%
- Percentage of people 3 years and older in undergraduate colleges:
Utica Square: 0.0% Tulsa: 4.7%
- Percentage of people 3 years and older in grad. or professional schools:
Utica Square: 0.0% Tulsa: 1.5%
- Percentage of students K-12 enrolled in private schools:
Utica Square: 60.0% Tulsa: 15.2%
Percentage of population below poverty level:
| Utica Square: | 3.7% |
| Tulsa: | 20.0% |
Median year owner moved in (as recorded in 2022):
Median year renter moved in (as recorded in 2022):
| Utica Square: | 2007 |
| Tulsa: | 2011 |
Median year renter moved in (as recorded in 2022):
| Utica Square: | 2017 |
| Tulsa: | 2020 |
Percentage of married-couple families with both working:
| Utica Square: | 48.8% |
| Tulsa: | 66.7% |
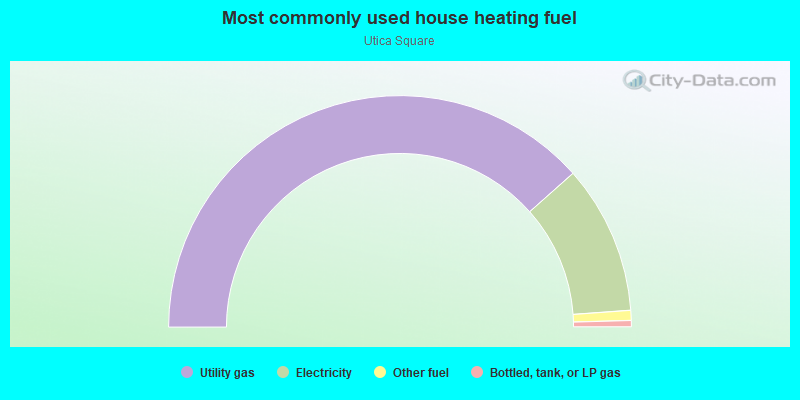
- 76.9%Utility gas
- 20.8%Electricity
- 1.4%Other fuel
- 0.9%Bottled, tank, or LP gas
Roads and streets:
N 72th E Ave (Utica Sq)
Length: 0.24 miles
Direction: E-W
Address range: 5800 to 5899
Direction: E-W
Address range: 5800 to 5899
E 22nd Pl
Length: 0.14 miles
Direction: E-W
Address range: 1732 to 2099
Direction: E-W
Address range: 1732 to 2099
S Wheeling Ave
Length: 0.10 miles
Direction: N-S
Direction: N-S
S Xanthus Ave
Length: 0.09 miles
Direction: N-S
Address range: 2190 to 2299
Direction: N-S
Address range: 2190 to 2299
S Yorktown Ave
Length: 0.04 miles
Direction: N-S
Address range: 2200 to 2259
Direction: N-S
Address range: 2200 to 2259