Valley Vista neighborhood in Cortez, Colorado (CO), 81321 detailed profile
Settings
X


Business Search - 14 Million verified businesses
Area: 0.355 square miles
Population: 783
Population density:
| Valley Vista: | 2,206 people per square mile |
| Cortez: | 1,605 people per square mile |

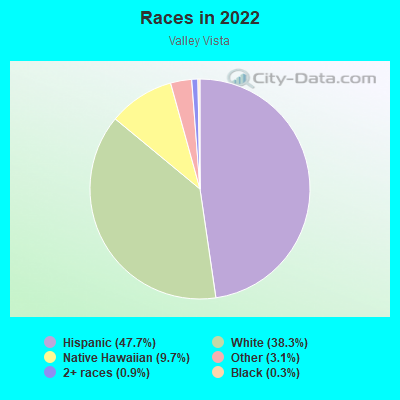
- 42947.7%Hispanic or Latino
- 34538.3%White
- 879.7%Native Hawaiian and Other
Pacific Islander - 283.1%Some other race
- 80.9%Two or more races
- 30.3%Black
Median household income in 2022:
| Valley Vista: | $80,731 |
| Cortez: | $55,962 |
Distribution of median household income
![Distribution of median household income]()
- 19Less than $10,000
- 11$10,000 to $19,999
- 32$20,000 to $29,999
- 76$30,000 to $39,999
- 59$40,000 to $49,999
- 19$50,000 to $59,999
- 35$60,000 to $74,999
- 28$75,000 to $99,999
- 33$100,000 to $124,999
- 25$125,000 to $149,999
- 30$150,000 to $199,999
- 9$200,000 or more

Distribution of owner-occupied house/condo value
![Distribution of owner-occupied house/condo value]()
- 36Less than $50,000
- 1$50,000 to $99,999
- 1$100,000 to $149,999
- 1$150,000 to $199,999
- 1$200,000 to $249,999
- 13$250,000 to $299,999
- 42$300,000 to $399,999
- 51$400,000 to $499,999
- 41$500,000 to $749,999
- 1$750,000 to $999,999
- 18$1,000,000 or more

Distribution of rent paid by renters
![Distribution of rent paid by renters]()
- 1Less than $100
- 1$300 to $399
- 1$500 to $599
- 1$700 to $799
- 32$900 to $999
- 281$1,000 to $1,249
- 245$1,250 to $1,499
- 38$1,500 to $1,999
- 39$2,000 or more

| Males: | 392 |
| Females: | 390 |
Males:
| This neighborhood: | 43.4 years |
| Whole city: | 38.0 years |
| This neighborhood: | 49.3 years |
| Whole city: | 37.9 years |
Average household size:
| Valley Vista: | 3.3 people |
| Cortez: | 2.5 people |
Percentage of family households:
| Valley Vista: | 40.1% |
| Cortez: | 37.1% |
| Here: | 28.2% |
| Cortez: | 37.9% |
Percentage of married-couple families with children (among all households):
| Valley Vista: | 22.8% |
| Cortez: | 19.6% |
Percentage of single-mother households (among all households):
| Valley Vista: | 39.9% |
| Cortez: | 13.0% |
Percentage of never married males 15 years old and over:
Percentage of never married females 15 years old and over:
| Valley Vista: | 31.7% |
| Cortez: | 16.6% |
Percentage of never married females 15 years old and over:
| Valley Vista: | 20.6% |
| city: | 13.0% |
Percentage of people that speak English not well or not at all:
| Valley Vista: | 6.0% |
| Cortez: | 1.7% |
Percentage of people born in this state:
Percentage of people born in another U.S. state:
Percentage of native residents but born outside the U.S.:
Percentage of foreign born residents:
| Here: | 50.9% |
| Cortez: | 43.4% |
Percentage of people born in another U.S. state:
| Valley Vista: | 27.9% |
| Cortez: | 51.5% |
Percentage of native residents but born outside the U.S.:
| Here: | 1.8% |
| city: | 1.5% |
Percentage of foreign born residents:
| Here: | 19.3% |
| Cortez: | 3.6% |
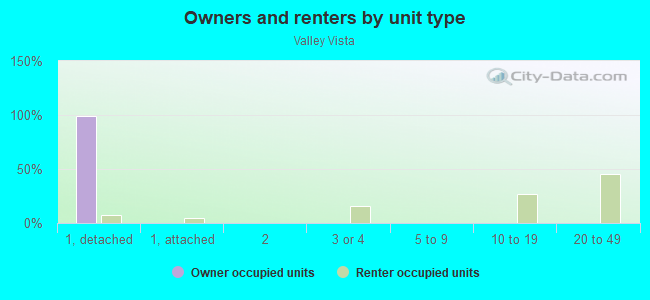
Owner-occupied
Renter-occupied

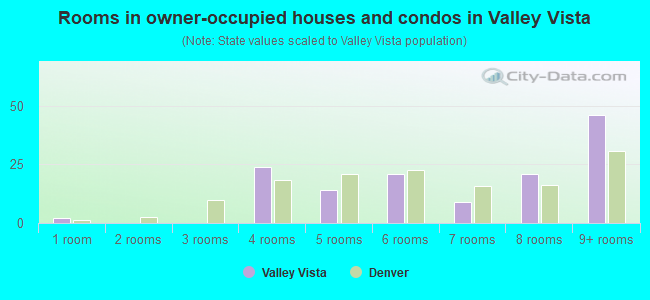
- Rooms in owner-occupied houses and condos in Valley Vista
- 21 room
- 02 rooms
- 03 rooms
- 244 rooms
- 145 rooms
- 216 rooms
- 97 rooms
- 218 rooms
- 469+ rooms
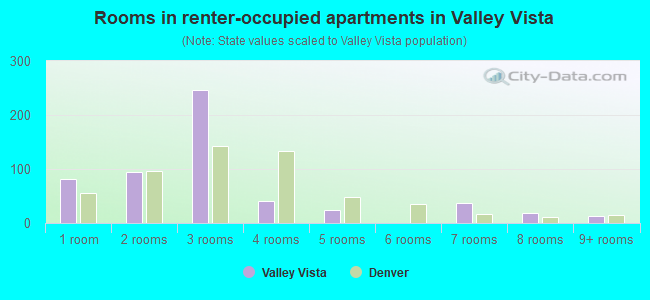
- Rooms in renter-occupied apartments in Valley Vista
- 811 room
- 952 rooms
- 2473 rooms
- 404 rooms
- 255 rooms
- 06 rooms
- 377 rooms
- 188 rooms
- 139+ rooms
Owner-occupied
Renter-occupied
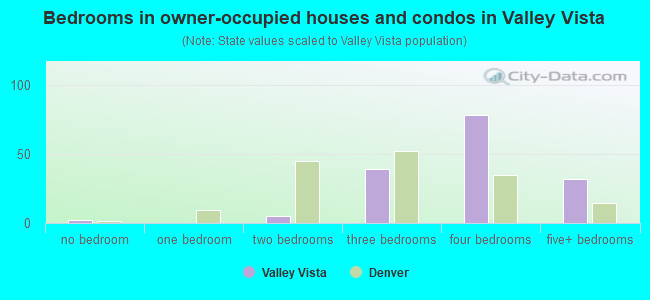
- Bedrooms in owner-occupied houses and condos in Valley Vista
- 2no bedroom
- 01 bedroom
- 52 bedrooms
- 393 bedrooms
- 784 bedrooms
- 325+ bedrooms
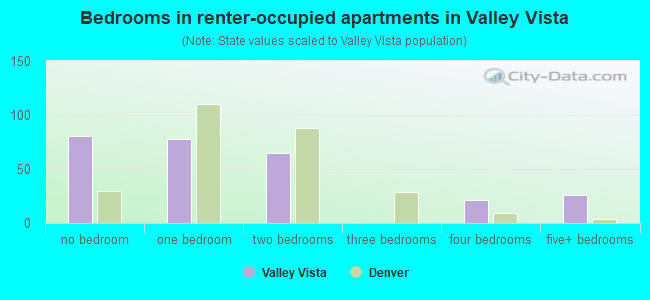
- Bedrooms in renter-occupied apartments in Valley Vista
- 81no bedroom
- 781 bedroom
- 652 bedrooms
- 03 bedrooms
- 214 bedrooms
- 265+ bedrooms
Average number of cars or other vehicles available in houses/condos:
Average number of cars or other vehicles available in apartments:
| This neighborhood: | 2.4 |
| Cortez: | 2.1 |
Average number of cars or other vehicles available in apartments:
| Here: | |
| city: |
Percentage of units with a mortgage:
| Valley Vista: | 50.0% |
| Cortez: | 49.4% |
Average estimated value of detached houses in 2022 (47.8% of all units):
| Valley Vista: | $375,759 |
| Colorado: | $676,667 |
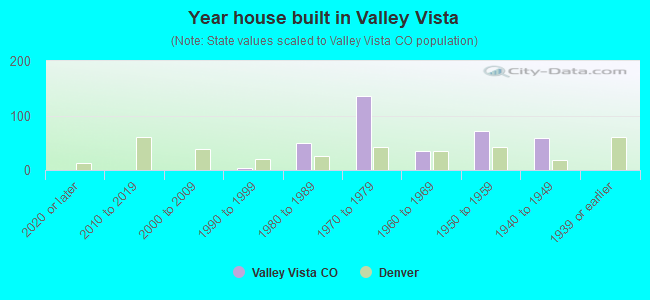
- Year house built in Valley Vista
- 02020 or later
- 02010 to 2019
- 02000 to 2009
- 41990 to 1999
- 501980 to 1989
- 1361970 to 1979
- 341960 to 1969
- 721950 to 1959
- 581940 to 1949
- 01939 or earlier
City-data.com crime index for city in 2020 (higher means more crime):
| City: | 381.9 |
| U.S. average: | 219.5 |
Travel time to work (commute)
![Travel time to work (commute)]()
- 1Less than 5 minutes
- 75 to 9 minutes
- 1110 to 14 minutes
- 4915 to 19 minutes
- 3320 to 24 minutes
- 3925 to 29 minutes
- 11230 to 34 minutes
- 2035 to 39 minutes
- 840 to 44 minutes
- 2745 to 59 minutes
- 3060 to 89 minutes
- 1090 or more minutes

Means of transportation to work
![Means of transportation to work]()
- 68.0%273Drove a car alone
- 30.9%124Carpooled
- 10.7%43Bus
- 18.4%74Taxi
- 11.7%47Bicycle
- 10.7%43Walked
- 21.4%86Worked at home

Time leaving home to go to work
![Time leaving home to go to work]()
- 85:00 a.m. to 5:29 a.m.
- 285:30 a.m. to 5:59 a.m.
- 646:00 a.m. to 6:29 a.m.
- 476:30 a.m. to 6:59 a.m.
- 347:00 a.m. to 7:29 a.m.
- 227:30 a.m. to 7:59 a.m.
- 518:00 a.m. to 8:29 a.m.
- 108:30 a.m. to 8:59 a.m.
- 79:00 a.m. to 9:59 a.m.
- 110:00 a.m. to 10:59 a.m.
- 2311:00 a.m. to 11:59 a.m.
- 1712:00 p.m. to 3:59 p.m.
- 294:00 p.m. to 11:59 p.m.

Occupations of males:
- Percentage of males in management occupations (except farmers):
Here: 4.9% city: 11.5%
- Percentage of males in arts, design, entertainment, sports, and media occupations:
Here: 1.8% city: 0.0%
- Percentage of males in service occupations:
Here: 16.5% city: 13.5%
- Percentage of males in sales and office occupations:
Here: 11.1% city: 19.1%
- Percentage of males in farming, fishing, and forestry occupations:
Here: 3.8% city: 0.0%
- Percentage of males in construction, extraction, and maintenance occupations:
Here: 39.2% city: 21.0%
- Percentage of males in production occupations:
Here: 1.9% city: 11.2%
- Percentage of males in transportation occupations:
Here: 8.3% city: 3.5%
Occupations of females:
- Percentage of females in business and financial operations occupations:
Here: 29.5% city: 3.5%
- Percentage of females in community and social services occupations:
Here: 4.5% city: 4.9%
- Percentage of females in legal occupations:
Here: 1.2% city: 5.0%
- Percentage of females in education, training, and library occupations:
Here: 8.8% city: 6.6%
- Percentage of females in service occupations:
Here: 29.4% city: 21.6%
- Percentage of females in sales and office occupations:
Here: 14.8% city: 27.0%
- Percentage of females in farming, fishing, and forestry occupations:
Here: 5.3% city: 0.0%
- Percentage of females in production occupations:
Here: 5.6% city: 1.3%
Percentage of people 16-64 in Armed Forces:
| Valley Vista: | 0.0% |
| Cortez: | 0.0% |
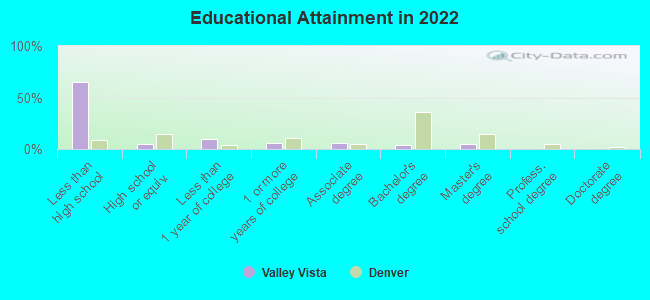
Education in this neighborhood (subdivision or community):
- Percentage of people 3 years and older in K-12 schools:
Valley Vista: 37.0% Cortez: 21.1%
- Percentage of people 3 years and older in undergraduate colleges:
Valley Vista: 26.5% Cortez: 1.7%
- Percentage of people 3 years and older in grad. or professional schools:
Valley Vista: 6.3% Cortez: 0.3%
- Percentage of students K-12 enrolled in private schools:
Valley Vista: 24.3% Cortez: 13.0%
Percentage of population below poverty level:
| Valley Vista: | 10.3% |
| Cortez: | 14.8% |
Median year owner moved in (as recorded in 2022):
| Valley Vista: | 2334 |
| Cortez: | 2012 |
Percentage of married-couple families with both working:
| Valley Vista: | 58.5% |
| Cortez: | 51.3% |
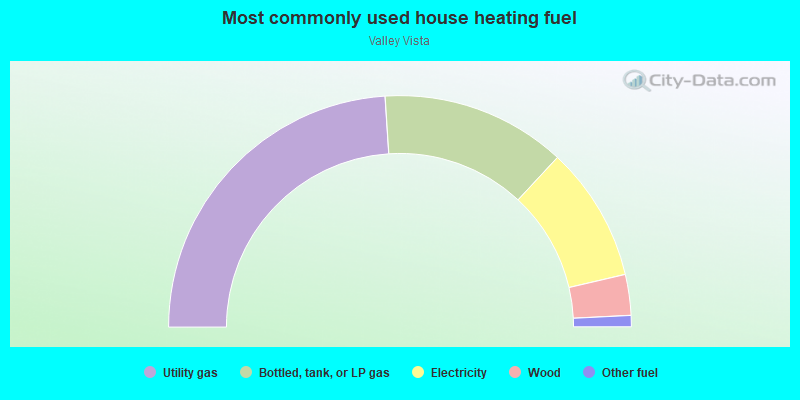
- 48.0%Utility gas
- 25.9%Bottled, tank, or LP gas
- 18.9%Electricity
- 5.7%Wood
- 1.6%Other fuel
Roads and streets:
Creek G 2
Length: 1.02 miles
Direction: E-W
Address range: 22190 to 23999
Direction: E-W
Address range: 22190 to 23999
Co Rd 22.5
Length: 0.33 miles
Direction: N-S
Address range: 7000 to 7333
Direction: N-S
Address range: 7000 to 7333
Creek 22.6
Length: 0.32 miles
Direction: N-S
Address range: 7000 to 7999
Direction: N-S
Address range: 7000 to 7999
Creek 21
Length: 0.23 miles
Direction: E-W
Address range: 22450 to 22713
Direction: E-W
Address range: 22450 to 22713
Rd 22.9
Length: 0.09 miles
Directions: N-S, SE-NW
Address range: 7489 to 7999
Directions: N-S, SE-NW
Address range: 7489 to 7999