Vendome neighborhood in San Jose, California (CA), 95110, 95112 detailed profile
Settings
X


Business Search - 14 Million verified businesses
Area: 0.125 square miles
Population: 2,542
Population density:
| Vendome: | 20,401 people per square mile |
| San Jose: | 5,554 people per square mile |

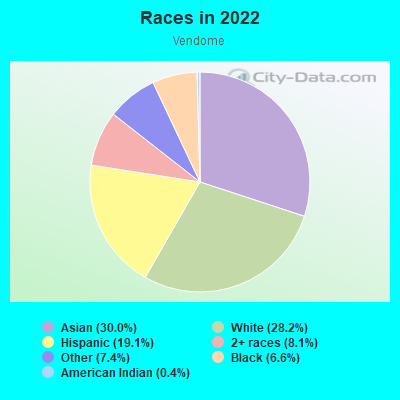
- 76730.0%Asian
- 72128.2%White
- 48919.1%Hispanic or Latino
- 2088.1%Two or more races
- 1907.4%Some other race
- 1686.6%Black
- 110.4%American Indian
- 20.08%Native Hawaiian and Other
Pacific Islander
Median household income in 2022:
| Vendome: | $143,871 |
| San Jose: | $133,835 |
Distribution of median household income
![Distribution of median household income]()
- 39Less than $10,000
- 121$10,000 to $19,999
- 144$20,000 to $29,999
- 172$30,000 to $39,999
- 21$40,000 to $49,999
- 18$50,000 to $59,999
- 26$60,000 to $74,999
- 202$75,000 to $99,999
- 17$100,000 to $124,999
- 35$125,000 to $149,999
- 235$150,000 to $199,999
- 423$200,000 or more

Distribution of owner-occupied house/condo value
![Distribution of owner-occupied house/condo value]()
- 14$200,000 to $249,999
- 59$500,000 to $749,999
- 27$750,000 to $999,999
- 200$1,000,000 or more

Distribution of rent paid by renters
![Distribution of rent paid by renters]()
- 47Less than $100
- 14$100 to $199
- 144$200 to $299
- 39$300 to $399
- 68$400 to $499
- 44$500 to $599
- 9$600 to $699
- 39$700 to $799
- 104$800 to $899
- 157$900 to $999
- 18$1,000 to $1,249
- 104$1,250 to $1,499
- 38$1,500 to $1,999
- 628$2,000 or more

Median rent in 2022:
| Vendome: | $2,421 |
| San Jose: | $2,001 |
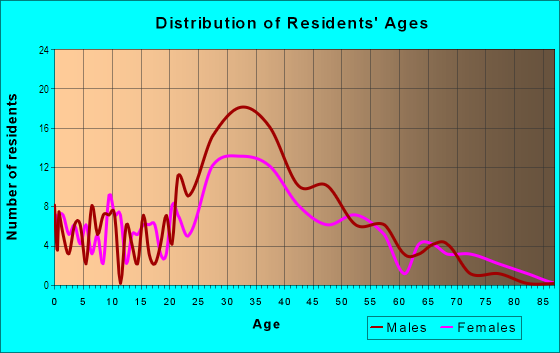
| Males: | 1,630 |
| Females: | 912 |
Males:
| This neighborhood: | 32.0 years |
| Whole city: | 37.6 years |
| This neighborhood: | 35.0 years |
| Whole city: | 39.1 years |
Average household size:
| Vendome: | 8.6 people |
| San Jose: | 2.9 people |
Percentage of family households:
| Vendome: | 52.5% |
| San Jose: | 49.9% |
| Here: | 49.2% |
| San Jose: | 53.0% |
Percentage of married-couple families with children (among all households):
| Vendome: | 34.6% |
| San Jose: | 25.8% |
Percentage of single-mother households (among all households):
| Vendome: | 7.8% |
| San Jose: | 5.2% |
Percentage of never married males 15 years old and over:
Percentage of never married females 15 years old and over:
| Vendome: | 31.8% |
| San Jose: | 20.9% |
Percentage of never married females 15 years old and over:
| Vendome: | 9.3% |
| city: | 16.7% |
Percentage of people that speak English not well or not at all:
| Vendome: | 4.7% |
| San Jose: | 11.4% |
Percentage of people born in this state:
Percentage of people born in another U.S. state:
Percentage of native residents but born outside the U.S.:
Percentage of foreign born residents:
| Here: | 58.2% |
| San Jose: | 46.1% |
Percentage of people born in another U.S. state:
| Vendome: | 19.1% |
| San Jose: | 10.4% |
Percentage of native residents but born outside the U.S.:
| Here: | 0.2% |
| city: | 1.7% |
Percentage of foreign born residents:
| Here: | 22.4% |
| San Jose: | 41.8% |
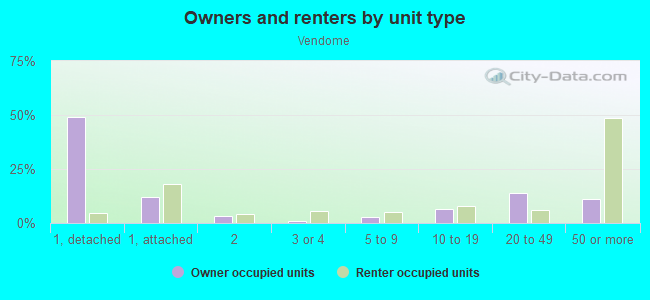
Owner-occupied
Renter-occupied

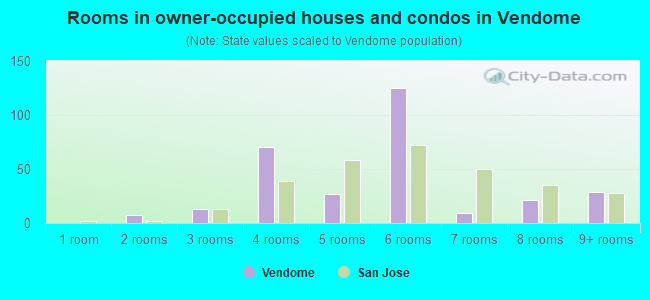
- Rooms in owner-occupied houses and condos in Vendome
- 01 room
- 72 rooms
- 133 rooms
- 704 rooms
- 275 rooms
- 1256 rooms
- 97 rooms
- 218 rooms
- 299+ rooms
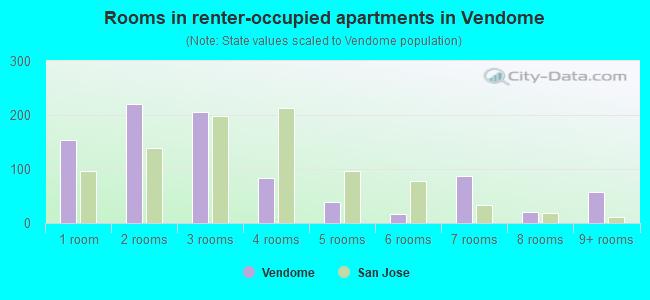
- Rooms in renter-occupied apartments in Vendome
- 1531 room
- 2212 rooms
- 2063 rooms
- 844 rooms
- 395 rooms
- 166 rooms
- 877 rooms
- 218 rooms
- 579+ rooms
Owner-occupied
Renter-occupied
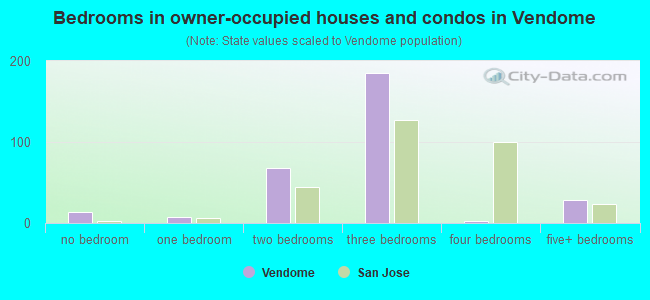
- Bedrooms in owner-occupied houses and condos in Vendome
- 13no bedroom
- 71 bedroom
- 682 bedrooms
- 1853 bedrooms
- 24 bedrooms
- 295+ bedrooms
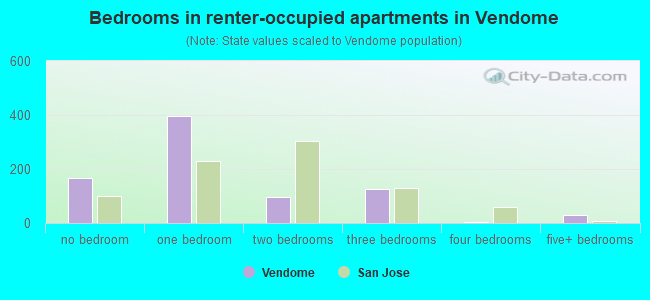
- Bedrooms in renter-occupied apartments in Vendome
- 168no bedroom
- 3981 bedroom
- 982 bedrooms
- 1273 bedrooms
- 54 bedrooms
- 315+ bedrooms
Average number of cars or other vehicles available in houses/condos:
Average number of cars or other vehicles available in apartments:
| This neighborhood: | 2.3 |
| San Jose: | 2.3 |
Average number of cars or other vehicles available in apartments:
| Here: | 1.4 |
| city: | 1.6 |
Percentage of units with a mortgage:
| Vendome: | 89.9% |
| San Jose: | 66.9% |

- Year house built in Vendome
- 392020 or later
- 192010 to 2019
- 3112000 to 2009
- 1371990 to 1999
- 2261980 to 1989
- 191970 to 1979
- 181960 to 1969
- 371950 to 1959
- 791940 to 1949
- 3781939 or earlier
City-data.com crime index for city in 2020 (higher means more crime):
| City: | 268.4 |
| U.S. average: | 219.5 |
Travel time to work (commute)
![Travel time to work (commute)]()
- 15Less than 5 minutes
- 545 to 9 minutes
- 9810 to 14 minutes
- 10715 to 19 minutes
- 8520 to 24 minutes
- 3625 to 29 minutes
- 6830 to 34 minutes
- 935 to 39 minutes
- 6640 to 44 minutes
- 6245 to 59 minutes
- 7860 to 89 minutes
- 1190 or more minutes

Means of transportation to work
![Means of transportation to work]()
- 55.8%870Drove a car alone
- 5.4%84Carpooled
- 0.1%1Bus
- 0.8%13Subway or elevated rail
- 1.0%16Long-distance train or commuter rail
- 1.2%18Light rail, streetcar or trolley
- 0.6%10Motorcycle
- 0.6%9Bicycle
- 2.3%36Walked
- 1.3%20Other means
- 31.7%494Worked at home

Time leaving home to go to work
![Time leaving home to go to work]()
- 2912:00 a.m. to 4:59 a.m.
- 25:00 a.m. to 5:29 a.m.
- 615:30 a.m. to 5:59 a.m.
- 546:00 a.m. to 6:29 a.m.
- 216:30 a.m. to 6:59 a.m.
- 1167:00 a.m. to 7:29 a.m.
- 497:30 a.m. to 7:59 a.m.
- 908:00 a.m. to 8:29 a.m.
- 638:30 a.m. to 8:59 a.m.
- 949:00 a.m. to 9:59 a.m.
- 4110:00 a.m. to 10:59 a.m.
- 3911:00 a.m. to 11:59 a.m.
- 1612:00 p.m. to 3:59 p.m.
- 344:00 p.m. to 11:59 p.m.

Occupations of males:
- Percentage of males in management occupations (except farmers):
Here: 5.3% city: 13.0%
- Percentage of males in business and financial operations occupations:
Here: 12.7% city: 4.6%
- Percentage of males in computer and mathematical occupations:
Here: 15.3% city: 13.6%
- Percentage of males in architecture and engineering occupations:
Here: 23.4% city: 10.2%
- Percentage of males in life, physical, and social science occupations:
Here: 2.8% city: 1.1%
- Percentage of males in legal occupations:
Here: 1.1% city: 0.8%
- Percentage of males in education, training, and library occupations:
Here: 12.3% city: 2.8%
- Percentage of males in arts, design, entertainment, sports, and media occupations:
Here: 1.5% city: 1.8%
- Percentage of males in healthcare practitioners and technical occupations:
Here: 3.7% city: 2.0%
- Percentage of males in service occupations:
Here: 2.5% city: 12.7%
- Percentage of males in sales and office occupations:
Here: 15.5% city: 12.8%
- Percentage of males in farming, fishing, and forestry occupations:
Here: 2.0% city: 0.4%
- Percentage of males in construction, extraction, and maintenance occupations:
Here: 1.4% city: 7.8%
- Percentage of males in transportation occupations:
Here: 4.9% city: 3.6%
Occupations of females:
- Percentage of females in management occupations (except farmers):
Here: 14.3% city: 11.0%
- Percentage of females in business and financial operations occupations:
Here: 11.8% city: 8.6%
- Percentage of females in computer and mathematical occupations:
Here: 2.6% city: 5.4%
- Percentage of females in architecture and engineering occupations:
Here: 14.9% city: 2.8%
- Percentage of females in life, physical, and social science occupations:
Here: 7.2% city: 1.7%
- Percentage of females in community and social services occupations:
Here: 6.9% city: 1.8%
- Percentage of females in education, training, and library occupations:
Here: 8.1% city: 8.1%
- Percentage of females in arts, design, entertainment, sports, and media occupations:
Here: 2.0% city: 2.0%
- Percentage of females in healthcare practitioners and technical occupations:
Here: 7.3% city: 6.8%
- Percentage of females in sales and office occupations:
Here: 33.4% city: 22.0%
- Percentage of females in production occupations:
Here: 1.5% city: 4.0%
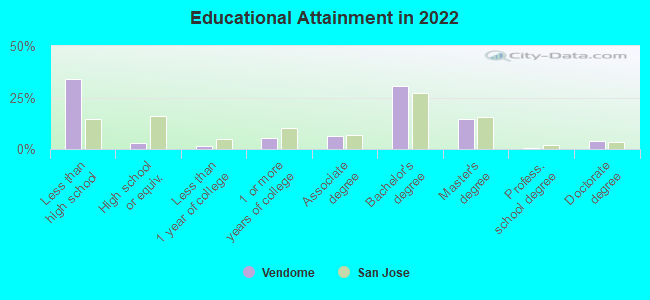
Education in this neighborhood (subdivision or community):
- Percentage of people 3 years and older in K-12 schools:
Vendome: 7.9% San Jose: 16.1%
- Percentage of people 3 years and older in undergraduate colleges:
Vendome: 6.2% San Jose: 6.5%
- Percentage of people 3 years and older in grad. or professional schools:
Vendome: 2.7% San Jose: 2.0%
- Percentage of students K-12 enrolled in private schools:
Vendome: 14.9% San Jose: 14.9%
Percentage of population below poverty level:
| Vendome: | 9.4% |
| San Jose: | 9.0% |
Median year renter moved in (as recorded in 2022):
| Vendome: | 2018 |
| San Jose: | 2020 |
Percentage of married-couple families with both working:
| Vendome: | 77.1% |
| San Jose: | 72.5% |

- 52.0%Utility gas
- 43.7%Electricity
- 1.6%No fuel used
- 1.4%Other fuel
- 1.3%Bottled, tank, or LP gas
Roads and streets:
N 1st St (N 1st Street)
Length: 0.51 miles
Direction: SE-NW
Address range: 377 to 649
Direction: SE-NW
Address range: 377 to 649
N San Pedro St
Length: 0.42 miles
Direction: SE-NW
Address range: 448 to 662
Direction: SE-NW
Address range: 448 to 662
Hobson St
Length: 0.27 miles
Direction: SW-NE
Address range: 1 to 199
Direction: SW-NE
Address range: 1 to 199
George St
Length: 0.26 miles
Direction: SW-NE
Address range: 1 to 299
Direction: SW-NE
Address range: 1 to 299
San Pedro Cir
Length: 0.22 miles
Directions: E-W, N-S, SE-NW, SW-NE
Address range: 100 to 299
Directions: E-W, N-S, SE-NW, SW-NE
Address range: 100 to 299
Ayer Ave
Length: 0.19 miles
Directions: E-W, SW-NE
Address range: 1 to 199
Directions: E-W, SW-NE
Address range: 1 to 199
Clayton Ave
Length: 0.18 miles
Directions: E-W, SW-NE
Address range: 1 to 159
Directions: E-W, SW-NE
Address range: 1 to 159
Fox Ave
Length: 0.18 miles
Direction: E-W
Address range: 1 to 199
Direction: E-W
Address range: 1 to 199
Hawthorne Way
Length: 0.18 miles
Directions: E-W, SW-NE
Address range: 1 to 149
Directions: E-W, SW-NE
Address range: 1 to 149
Rankin Ave
Length: 0.18 miles
Directions: E-W, SW-NE
Address range: 1 to 199
Directions: E-W, SW-NE
Address range: 1 to 199
New St
Length: 0.17 miles
Directions: E-W, N-S, SE-NW, SW-NE
Directions: E-W, N-S, SE-NW, SW-NE
Bassett St
Length: 0.11 miles
Direction: SW-NE
Address range: 1 to 51
Direction: SW-NE
Address range: 1 to 51
Acacia St
Length: 0.09 miles
Direction: SW-NE
Address range: 100 to 199
Direction: SW-NE
Address range: 100 to 199
Filomena Ave
Length: 0.09 miles
Direction: SW-NE
Address range: 100 to 199
Direction: SW-NE
Address range: 100 to 199
W Empire St
Length: 0.07 miles
Direction: E-W
Address range: 100 to 199
Direction: E-W
Address range: 100 to 199
Quailbrook Ct
Length: 0.06 miles
Directions: E-W, SE-NW
Address range: 500 to 599
Directions: E-W, SE-NW
Address range: 500 to 599
Losse Ct
Length: 0.06 miles
Direction: SE-NW
Address range: 500 to 599
Direction: SE-NW
Address range: 500 to 599