Villa Mira neighborhood in Laguna Niguel, California (CA), 92677, 92691 detailed profile
Settings
X


Business Search - 14 Million verified businesses
Area: 0.347 square miles
Population: 1,207
Population density:
| Villa Mira: | 3,480 people per square mile |
| Laguna Niguel: | 4,383 people per square mile |

- 63451.1%White
- 23118.6%Black
- 13811.1%Two or more races
- 1199.6%Asian
- 887.1%Hispanic or Latino
- 231.9%Some other race
- 70.6%Native Hawaiian and Other
Pacific Islander - 10.08%American Indian

Distribution of median household income
![Distribution of median household income]()
- 24Less than $10,000
- 23$10,000 to $19,999
- 139$20,000 to $29,999
- 61$30,000 to $39,999
- 38$40,000 to $49,999
- 43$50,000 to $59,999
- 15$60,000 to $74,999
- 44$75,000 to $99,999
- 73$100,000 to $124,999
- 40$125,000 to $149,999
- 56$150,000 to $199,999
- 91$200,000 or more

Distribution of owner-occupied house/condo value
![Distribution of owner-occupied house/condo value]()
- 13Less than $50,000
- 7$50,000 to $99,999
- 2$100,000 to $149,999
- 2$150,000 to $199,999
- 12$300,000 to $399,999
- 101$400,000 to $499,999
- 52$500,000 to $749,999
- 41$750,000 to $999,999
- 198$1,000,000 or more

Distribution of rent paid by renters
![Distribution of rent paid by renters]()
- 16$300 to $399
- 5$700 to $799
- 7$900 to $999
- 4$1,000 to $1,249
- 3$1,250 to $1,499
- 64$1,500 to $1,999
- 144$2,000 or more

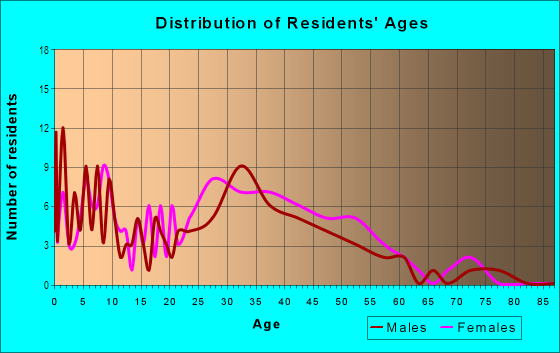
| Males: | 611 |
| Females: | 596 |
Males:
| This neighborhood: | 40.9 years |
| Whole city: | 45.5 years |
| This neighborhood: | 44.3 years |
| Whole city: | 48.2 years |
Average household size:
| Villa Mira: | 7.2 people |
| Laguna Niguel: | 2.5 people |
Percentage of family households:
| Villa Mira: | 49.7% |
| Laguna Niguel: | 45.5% |
| Here: | 48.9% |
| Laguna Niguel: | 57.2% |
Percentage of married-couple families with children (among all households):
| Villa Mira: | 35.9% |
| Laguna Niguel: | 32.0% |
Percentage of single-mother households (among all households):
| Villa Mira: | 3.1% |
| Laguna Niguel: | 5.1% |
Percentage of never married males 15 years old and over:
Percentage of never married females 15 years old and over:
| Villa Mira: | 17.3% |
| Laguna Niguel: | 14.2% |
Percentage of never married females 15 years old and over:
| Villa Mira: | 12.6% |
| city: | 13.7% |
Percentage of people that speak English not well or not at all:
| Villa Mira: | 0.8% |
| Laguna Niguel: | 3.6% |
Percentage of people born in this state:
Percentage of people born in another U.S. state:
Percentage of native residents but born outside the U.S.:
Percentage of foreign born residents:
| Here: | 50.8% |
| Laguna Niguel: | 48.2% |
Percentage of people born in another U.S. state:
| Villa Mira: | 23.0% |
| Laguna Niguel: | 26.5% |
Percentage of native residents but born outside the U.S.:
| Here: | 2.2% |
| city: | 2.0% |
Percentage of foreign born residents:
| Here: | 24.0% |
| Laguna Niguel: | 23.3% |

Owner-occupied
Renter-occupied


- Rooms in owner-occupied houses and condos in Villa Mira
- 01 room
- 132 rooms
- 183 rooms
- 1004 rooms
- 495 rooms
- 516 rooms
- 357 rooms
- 458 rooms
- 149+ rooms

- Rooms in renter-occupied apartments in Villa Mira
- 321 room
- 392 rooms
- 773 rooms
- 264 rooms
- 175 rooms
- 166 rooms
- 47 rooms
- 848 rooms
- 49+ rooms
Owner-occupied
Renter-occupied

- Bedrooms in owner-occupied houses and condos in Villa Mira
- 0no bedroom
- 271 bedroom
- 1232 bedrooms
- 1013 bedrooms
- 624 bedrooms
- 635+ bedrooms

- Bedrooms in renter-occupied apartments in Villa Mira
- 32no bedroom
- 611 bedroom
- 292 bedrooms
- 373 bedrooms
- 424 bedrooms
- 05+ bedrooms
Average number of cars or other vehicles available in houses/condos:
Average number of cars or other vehicles available in apartments:
| This neighborhood: | 2.2 |
| Laguna Niguel: | 2.1 |
Average number of cars or other vehicles available in apartments:
| Here: | 1.9 |
| city: | 1.8 |
Percentage of units with a mortgage:
| Villa Mira: | 70.6% |
| Laguna Niguel: | 69.6% |
Housing prices:
- Average estimated value of detached houses in 2022 (46.5% of all units):
Villa Mira: $1,035,949 California: $988,808
- Average estimated value of townhouses or other attached units in 2022 (26.0% of all units):
This neighborhood: $664,730 California: $838,546

- Year house built in Villa Mira
- 302020 or later
- 892010 to 2019
- 202000 to 2009
- 361990 to 1999
- 3311980 to 1989
- 401970 to 1979
- 211960 to 1969
- 31950 to 1959
- 61940 to 1949
- 451939 or earlier

City-data.com crime index for city in 2020 (higher means more crime):
| City: | 62.1 |
| U.S. average: | 219.5 |
Travel time to work (commute)
![Travel time to work (commute)]()
- 3Less than 5 minutes
- 365 to 9 minutes
- 5610 to 14 minutes
- 6315 to 19 minutes
- 7720 to 24 minutes
- 2725 to 29 minutes
- 8730 to 34 minutes
- 1335 to 39 minutes
- 740 to 44 minutes
- 3045 to 59 minutes
- 1960 to 89 minutes
- 1490 or more minutes

Means of transportation to work
![Means of transportation to work]()
- 65.2%483Drove a car alone
- 12.8%95Carpooled
- 1.6%12Bus
- 0.3%2Long-distance train or commuter rail
- 3.2%24Walked
- 1.9%14Other means
- 28.6%212Worked at home

Time leaving home to go to work
![Time leaving home to go to work]()
- 2212:00 a.m. to 4:59 a.m.
- 75:00 a.m. to 5:29 a.m.
- 145:30 a.m. to 5:59 a.m.
- 246:00 a.m. to 6:29 a.m.
- 356:30 a.m. to 6:59 a.m.
- 627:00 a.m. to 7:29 a.m.
- 617:30 a.m. to 7:59 a.m.
- 668:00 a.m. to 8:29 a.m.
- 358:30 a.m. to 8:59 a.m.
- 429:00 a.m. to 9:59 a.m.
- 1010:00 a.m. to 10:59 a.m.
- 1611:00 a.m. to 11:59 a.m.
- 2812:00 p.m. to 3:59 p.m.
- 144:00 p.m. to 11:59 p.m.

Occupations of males:
- Percentage of males in management occupations (except farmers):
Here: 10.8% city: 18.9%
- Percentage of males in business and financial operations occupations:
Here: 4.6% city: 9.3%
- Percentage of males in architecture and engineering occupations:
Here: 9.2% city: 6.2%
- Percentage of males in life, physical, and social science occupations:
Here: 1.0% city: 1.3%
- Percentage of males in legal occupations:
Here: 3.2% city: 2.8%
- Percentage of males in arts, design, entertainment, sports, and media occupations:
Here: 6.2% city: 2.9%
- Percentage of males in service occupations:
Here: 1.6% city: 11.4%
- Percentage of males in sales and office occupations:
Here: 42.3% city: 21.5%
- Percentage of males in transportation occupations:
Here: 1.1% city: 1.2%
- Percentage of males in material moving occupations:
Here: 17.3% city: 2.4%
Occupations of females:
- Percentage of females in management occupations (except farmers):
Here: 10.7% city: 12.8%
- Percentage of females in business and financial operations occupations:
Here: 2.3% city: 10.2%
- Percentage of females in computer and mathematical occupations:
Here: 6.4% city: 3.0%
- Percentage of females in life, physical, and social science occupations:
Here: 1.0% city: 0.9%
- Percentage of females in education, training, and library occupations:
Here: 5.4% city: 7.6%
- Percentage of females in arts, design, entertainment, sports, and media occupations:
Here: 7.1% city: 3.2%
- Percentage of females in healthcare practitioners and technical occupations:
Here: 7.8% city: 10.1%
- Percentage of females in service occupations:
Here: 13.5% city: 18.3%
- Percentage of females in sales and office occupations:
Here: 39.0% city: 25.8%
- Percentage of females in production occupations:
Here: 4.7% city: 0.8%
- Percentage of females in transportation occupations:
Here: 1.2% city: 0.5%
- Percentage of females in material moving occupations:
Here: 1.1% city: 0.5%
Percentage of people 16-64 in Armed Forces:
| Villa Mira: | 0.2% |
| Laguna Niguel: | 0.3% |
Education in this neighborhood (subdivision or community):
- Percentage of people 3 years and older in K-12 schools:
Villa Mira: 16.4% Laguna Niguel: 13.6%
- Percentage of people 3 years and older in undergraduate colleges:
Villa Mira: 8.0% Laguna Niguel: 5.5%
- Percentage of people 3 years and older in grad. or professional schools:
Villa Mira: 3.3% Laguna Niguel: 1.8%
- Percentage of students K-12 enrolled in private schools:
Villa Mira: 40.4% Laguna Niguel: 17.8%
Percentage of population below poverty level:
| Villa Mira: | 8.7% |
| Laguna Niguel: | 7.4% |
Median year owner moved in (as recorded in 2022):
| Villa Mira: | 2005 |
| Laguna Niguel: | 2005 |
Percentage of married-couple families with both working:
| Villa Mira: | 104.1% |
| Laguna Niguel: | 64.1% |

- 61.6%Utility gas
- 23.8%Electricity
- 7.2%Wood
- 4.6%Bottled, tank, or LP gas
- 2.0%No fuel used
- 0.7%Solar energy
Limited-access highways (interstate or state) in this neighborhood:
San Joaquin Hills Transportation Corridor (State Hwy 73)
Length: 0.64 miles
Directions: N-S, SE-NW
Directions: N-S, SE-NW
I- 5 (San Diego Fwy)
Length: 0.61 miles
Direction: N-S
Direction: N-S
Roads and streets:
Cam Capistrano
Length: 0.74 miles
Direction: N-S
Address range: 27770 to 28499
Direction: N-S
Address range: 27770 to 28499
Cabot Rd
Length: 0.59 miles
Direction: N-S
Address range: 27966 to 28299
Direction: N-S
Address range: 27966 to 28299
Crown Valley Pkwy
Length: 0.51 miles
Directions: E-W, SW-NE
Address range: 25801 to 27874
Directions: E-W, SW-NE
Address range: 25801 to 27874
Pso de la Colinas
Length: 0.46 miles
Directions: E-W, N-S, SE-NW, SW-NE
Address range: 28400 to 28523
Directions: E-W, N-S, SE-NW, SW-NE
Address range: 28400 to 28523
Forbes Rd
Length: 0.31 miles
Directions: N-S, SE-NW
Address range: 27890 to 28099
Directions: N-S, SE-NW
Address range: 27890 to 28099
Montecito
Length: 0.28 miles
Directions: E-W, N-S, SW-NE
Address range: 28000 to 28298
Directions: E-W, N-S, SW-NE
Address range: 28000 to 28298
Villamira
Length: 0.17 miles
Directions: E-W, SE-NW
Directions: E-W, SE-NW
Sorrento
Length: 0.17 miles
Directions: E-W, N-S, SE-NW, SW-NE
Address range: 28100 to 28299
Directions: E-W, N-S, SE-NW, SW-NE
Address range: 28100 to 28299
Montemar
Length: 0.13 miles
Directions: E-W, N-S, SE-NW
Address range: 25900 to 25999
Directions: E-W, N-S, SE-NW
Address range: 25900 to 25999
Portofino
Length: 0.09 miles
Directions: E-W, SE-NW, SW-NE
Address range: 24200 to 25999
Directions: E-W, SE-NW, SW-NE
Address range: 24200 to 25999
Mariposa
Length: 0.09 miles
Directions: E-W, N-S, SE-NW
Address range: 28000 to 28199
Directions: E-W, N-S, SE-NW
Address range: 28000 to 28199
Pso el Siena
Length: 0.07 miles
Direction: N-S
Address range: 28200 to 28399
Direction: N-S
Address range: 28200 to 28399
Railroad features:
at and Sf Rlwy
Length: 0.74 miles
Direction: N-S
Direction: N-S