Walnut neighborhood in Lansing, Michigan (MI), 48906 detailed profile
Settings
X


Business Search - 14 Million verified businesses
Area: 0.325 square miles
Population: 2,485
Population density:
| Walnut: | 7,642 people per square mile |
| Lansing: | 3,223 people per square mile |

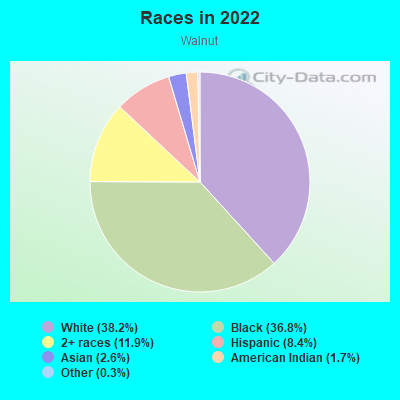
- 98538.2%White
- 94736.8%Black
- 30711.9%Two or more races
- 2178.4%Hispanic or Latino
- 682.6%Asian
- 451.7%American Indian
- 70.3%Some other race
Median household income in 2022:
| Walnut: | $45,138 |
| Lansing: | $48,962 |
Distribution of median household income
![Distribution of median household income]()
- 80Less than $10,000
- 169$10,000 to $19,999
- 180$20,000 to $29,999
- 182$30,000 to $39,999
- 164$40,000 to $49,999
- 119$50,000 to $59,999
- 161$60,000 to $74,999
- 53$75,000 to $99,999
- 74$100,000 to $124,999
- 40$125,000 to $149,999
- 28$150,000 to $199,999
- 61$200,000 or more

Distribution of owner-occupied house/condo value
![Distribution of owner-occupied house/condo value]()
- 32Less than $50,000
- 184$50,000 to $99,999
- 93$100,000 to $149,999
- 35$150,000 to $199,999
- 30$200,000 to $249,999
- 10$250,000 to $299,999
- 84$300,000 to $399,999

Distribution of rent paid by renters
![Distribution of rent paid by renters]()
- 13Less than $100
- 116$100 to $199
- 36$300 to $399
- 261$400 to $499
- 206$500 to $599
- 74$600 to $699
- 217$700 to $799
- 144$800 to $899
- 101$900 to $999
- 258$1,000 to $1,249
- 36$1,250 to $1,499
- 25$1,500 to $1,999

Median rent in 2022:
| Walnut: | $774 |
| Lansing: | $773 |
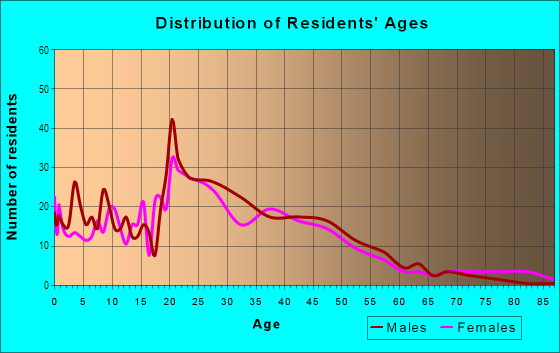
| Males: | 1,138 |
| Females: | 1,346 |
Males:
| This neighborhood: | 29.3 years |
| Whole city: | 33.0 years |
| This neighborhood: | 27.9 years |
| Whole city: | 34.5 years |
Average household size:
| Walnut: | 2.2 people |
| Lansing: | 2.1 people |
Percentage of family households:
| Walnut: | 38.6% |
| Lansing: | 33.9% |
| Here: | 14.2% |
| Lansing: | 27.4% |
Percentage of married-couple families with children (among all households):
| Walnut: | 16.3% |
| Lansing: | 23.0% |
Percentage of single-mother households (among all households):
| Walnut: | 22.7% |
| Lansing: | 14.1% |
Percentage of never married males 15 years old and over:
Percentage of never married females 15 years old and over:
| Walnut: | 32.6% |
| Lansing: | 24.9% |
Percentage of never married females 15 years old and over:
| Walnut: | 31.9% |
| city: | 21.6% |
Percentage of people that speak English not well or not at all:
| Walnut: | 0.5% |
| Lansing: | 2.3% |
Percentage of people born in this state:
Percentage of people born in another U.S. state:
Percentage of native residents but born outside the U.S.:
Percentage of foreign born residents:
| Here: | 62.7% |
| Lansing: | 72.5% |
Percentage of people born in another U.S. state:
| Walnut: | 17.5% |
| Lansing: | 19.1% |
Percentage of native residents but born outside the U.S.:
| Here: | 0.3% |
| city: | 0.8% |
Percentage of foreign born residents:
| Here: | 19.5% |
| Lansing: | 7.6% |
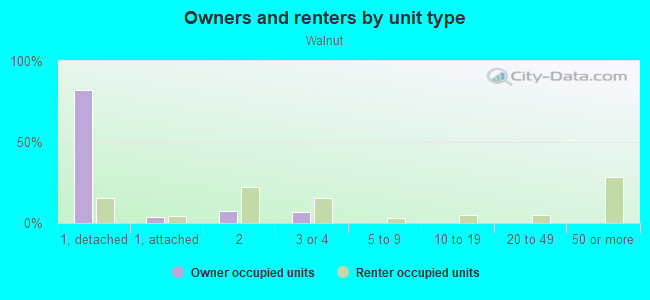
Owner-occupied
Renter-occupied

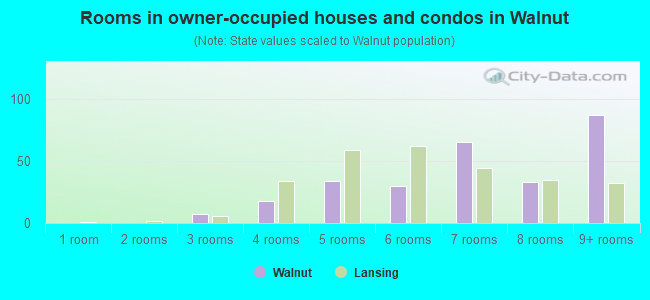
- Rooms in owner-occupied houses and condos in Walnut
- 01 room
- 02 rooms
- 73 rooms
- 184 rooms
- 345 rooms
- 306 rooms
- 657 rooms
- 338 rooms
- 879+ rooms
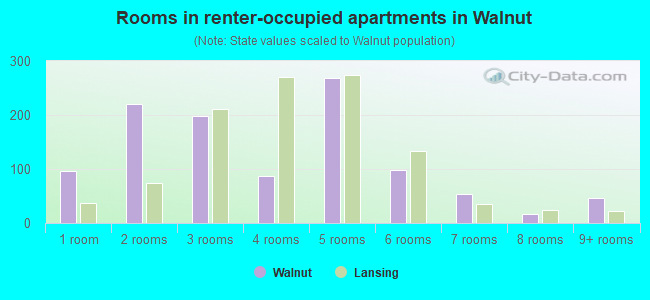
- Rooms in renter-occupied apartments in Walnut
- 961 room
- 2202 rooms
- 1993 rooms
- 874 rooms
- 2695 rooms
- 996 rooms
- 537 rooms
- 168 rooms
- 469+ rooms
Owner-occupied
Renter-occupied
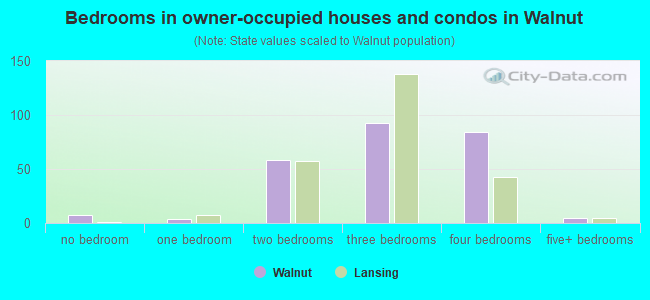
- Bedrooms in owner-occupied houses and condos in Walnut
- 7no bedroom
- 41 bedroom
- 582 bedrooms
- 933 bedrooms
- 844 bedrooms
- 55+ bedrooms
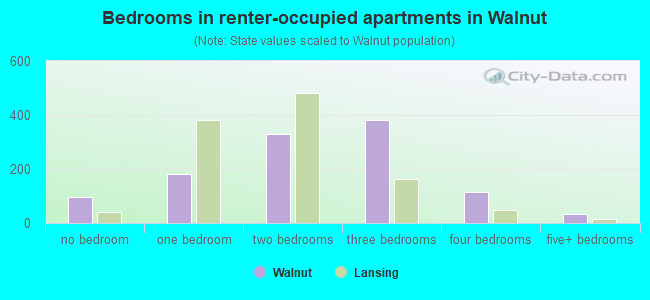
- Bedrooms in renter-occupied apartments in Walnut
- 96no bedroom
- 1801 bedroom
- 3292 bedrooms
- 3803 bedrooms
- 1154 bedrooms
- 325+ bedrooms
Average number of cars or other vehicles available in houses/condos:
Average number of cars or other vehicles available in apartments:
| This neighborhood: | 1.8 |
| Lansing: | 1.7 |
Average number of cars or other vehicles available in apartments:
| Here: | 1.1 |
| city: | 1.1 |
Percentage of units with a mortgage:
| Walnut: | 67.4% |
| Lansing: | 65.6% |
Average estimated value of detached houses in 2022 (43.8% of all units):
| Walnut: | $108,761 |
| Lansing: | $121,378 |
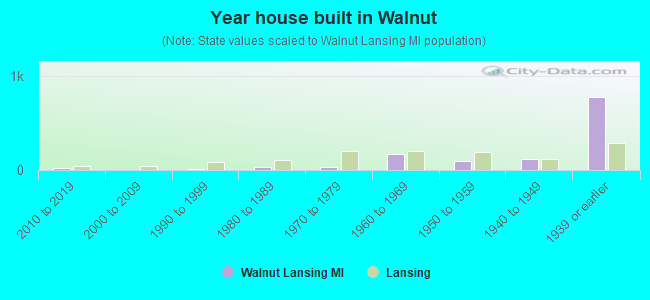
- Year house built in Walnut
- 02020 or later
- 202010 to 2019
- 02000 to 2009
- 151990 to 1999
- 371980 to 1989
- 311970 to 1979
- 1691960 to 1969
- 981950 to 1959
- 1211940 to 1949
- 7711939 or earlier
City-data.com crime index for city in 2020 (higher means more crime):
| City: | 553.0 |
| U.S. average: | 219.5 |
Travel time to work (commute)
![Travel time to work (commute)]()
- 68Less than 5 minutes
- 895 to 9 minutes
- 23310 to 14 minutes
- 22815 to 19 minutes
- 15920 to 24 minutes
- 5925 to 29 minutes
- 11030 to 34 minutes
- 5435 to 39 minutes
- 740 to 44 minutes
- 7245 to 59 minutes
- 3760 to 89 minutes
- 790 or more minutes

Means of transportation to work
![Means of transportation to work]()
- 45.0%550Drove a car alone
- 23.6%288Carpooled
- 4.8%59Bus
- 0.2%3Bicycle
- 16.1%197Walked
- 0.2%3Other means
- 15.0%183Worked at home

Time leaving home to go to work
![Time leaving home to go to work]()
- 8512:00 a.m. to 4:59 a.m.
- 555:30 a.m. to 5:59 a.m.
- 1106:00 a.m. to 6:29 a.m.
- 466:30 a.m. to 6:59 a.m.
- 987:00 a.m. to 7:29 a.m.
- 907:30 a.m. to 7:59 a.m.
- 1218:00 a.m. to 8:29 a.m.
- 1138:30 a.m. to 8:59 a.m.
- 1089:00 a.m. to 9:59 a.m.
- 5310:00 a.m. to 10:59 a.m.
- 2211:00 a.m. to 11:59 a.m.
- 6312:00 p.m. to 3:59 p.m.
- 1754:00 p.m. to 11:59 p.m.

Occupations of males:
- Percentage of males in management occupations (except farmers):
Here: 6.4% city: 6.2%
- Percentage of males in business and financial operations occupations:
Here: 1.4% city: 4.1%
- Percentage of males in computer and mathematical occupations:
Here: 17.9% city: 6.1%
- Percentage of males in architecture and engineering occupations:
Here: 4.3% city: 2.5%
- Percentage of males in community and social services occupations:
Here: 2.0% city: 1.5%
- Percentage of males in education, training, and library occupations:
Here: 7.0% city: 4.9%
- Percentage of males in arts, design, entertainment, sports, and media occupations:
Here: 3.5% city: 1.9%
- Percentage of males in service occupations:
Here: 9.8% city: 17.2%
- Percentage of males in sales and office occupations:
Here: 6.5% city: 13.3%
- Percentage of males in construction, extraction, and maintenance occupations:
Here: 10.2% city: 6.5%
- Percentage of males in production occupations:
Here: 2.9% city: 9.4%
- Percentage of males in transportation occupations:
Here: 12.0% city: 6.7%
- Percentage of males in material moving occupations:
Here: 14.6% city: 8.5%
Occupations of females:
- Percentage of females in management occupations (except farmers):
Here: 7.2% city: 6.9%
- Percentage of females in business and financial operations occupations:
Here: 2.9% city: 6.7%
- Percentage of females in computer and mathematical occupations:
Here: 3.0% city: 2.4%
- Percentage of females in architecture and engineering occupations:
Here: 1.1% city: 0.7%
- Percentage of females in education, training, and library occupations:
Here: 11.0% city: 8.7%
- Percentage of females in arts, design, entertainment, sports, and media occupations:
Here: 3.7% city: 1.7%
- Percentage of females in healthcare practitioners and technical occupations:
Here: 3.3% city: 6.7%
- Percentage of females in service occupations:
Here: 25.3% city: 25.0%
- Percentage of females in sales and office occupations:
Here: 19.7% city: 25.9%
- Percentage of females in construction, extraction, and maintenance occupations:
Here: 1.5% city: 0.2%
- Percentage of females in production occupations:
Here: 11.8% city: 5.6%
- Percentage of females in transportation occupations:
Here: 6.4% city: 1.5%
- Percentage of females in material moving occupations:
Here: 2.0% city: 2.3%
Percentage of people 16-64 in Armed Forces:
| Walnut: | 0.0% |
| Lansing: | 0.0% |
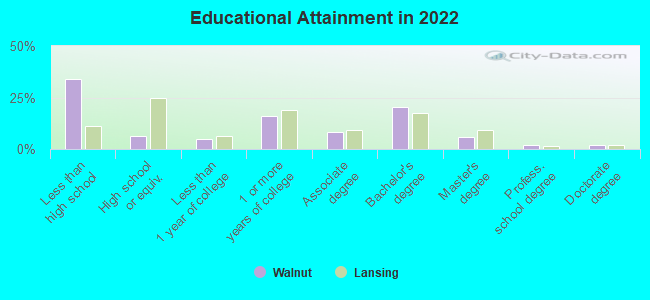
Education in this neighborhood (subdivision or community):
- Percentage of people 3 years and older in K-12 schools:
Walnut: 39.4% Lansing: 14.3%
- Percentage of people 3 years and older in undergraduate colleges:
Walnut: 12.0% Lansing: 4.6%
- Percentage of people 3 years and older in grad. or professional schools:
Walnut: 8.4% Lansing: 2.6%
- Percentage of students K-12 enrolled in private schools:
Walnut: 6.3% Lansing: 7.9%
Percentage of population below poverty level:
| Walnut: | 43.0% |
| Lansing: | 22.2% |
Median year owner moved in (as recorded in 2022):
Median year renter moved in (as recorded in 2022):
| Walnut: | 2008 |
| Lansing: | 2012 |
Median year renter moved in (as recorded in 2022):
| Walnut: | 2018 |
| Lansing: | 2020 |
Percentage of married-couple families with both working:
| Walnut: | 102.4% |
| Lansing: | 59.6% |
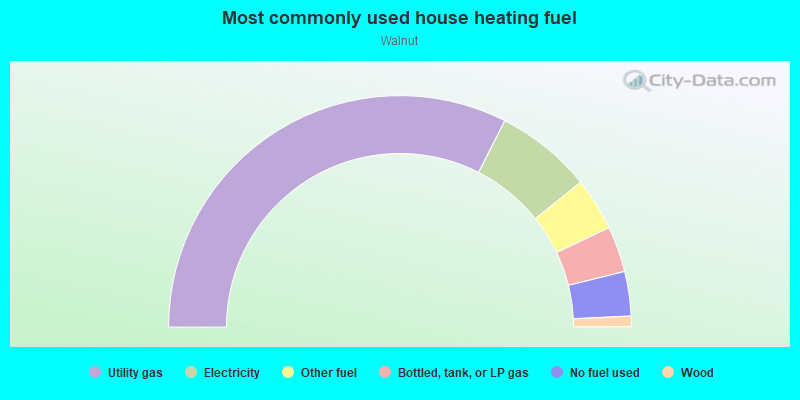
- 65.0%Utility gas
- 13.5%Electricity
- 7.4%Other fuel
- 6.4%Bottled, tank, or LP gas
- 6.2%No fuel used
- 1.5%Wood
Highways in this neighborhood:
State Hwy 43 (W Oakland Rd, I- 69 Bus)
Length: 0.73 miles
Direction: E-W
Address range: 100 to 499
Direction: E-W
Address range: 100 to 499
Roads and streets:
N Chestnut St
Length: 0.59 miles
Direction: N-S
Address range: 800 to 1499
Direction: N-S
Address range: 800 to 1499
N Walnut St
Length: 0.56 miles
Direction: N-S
Address range: 800 to 1399
Direction: N-S
Address range: 800 to 1399
N Washington Ave
Length: 0.54 miles
Direction: N-S
Address range: 700 to 1299
Direction: N-S
Address range: 700 to 1299
N Capitol Ave
Length: 0.54 miles
Direction: N-S
Address range: 700 to 1299
Direction: N-S
Address range: 700 to 1299
W Kilborn St
Length: 0.43 miles
Direction: E-W
Address range: 100 to 499
Direction: E-W
Address range: 100 to 499
W Madison St
Length: 0.43 miles
Direction: E-W
Address range: 100 to 499
Direction: E-W
Address range: 100 to 499
W Maple St
Length: 0.43 miles
Direction: E-W
Address range: 100 to 499
Direction: E-W
Address range: 100 to 499
W Willow St
Length: 0.43 miles
Direction: E-W
Address range: 100 to 499
Direction: E-W
Address range: 100 to 499
W Grand River Ave
Length: 0.43 miles
Direction: E-W
Address range: 100 to 499
Direction: E-W
Address range: 100 to 499
Seymour Ave
Length: 0.36 miles
Direction: N-S
Address range: 800 to 1199
Direction: N-S
Address range: 800 to 1199
N Grand River Ave
Length: 0.19 miles
Direction: N-S
Address range: 1200 to 1399
Direction: N-S
Address range: 1200 to 1399
N Grand Ave
Length: 0.19 miles
Directions: N-S, SE-NW
Address range: 700 to 899
Directions: N-S, SE-NW
Address range: 700 to 899
E Grand River Ave
Length: 0.13 miles
Direction: E-W
Address range: 100 to 199
Direction: E-W
Address range: 100 to 199
E Madison St
Length: 0.10 miles
Direction: E-W
Address range: 100 to 199
Direction: E-W
Address range: 100 to 199
E Kilborn St
Length: 0.09 miles
Direction: E-W
Address range: 100 to 199
Direction: E-W
Address range: 100 to 199
Pleasant St
Length: 0.08 miles
Direction: E-W
Address range: 400 to 499
Direction: E-W
Address range: 400 to 499
Edmore St
Length: 0.08 miles
Direction: E-W
Address range: 400 to 499
Direction: E-W
Address range: 400 to 499
Lawler Ct
Length: 0.07 miles
Direction: E-W
Address range: 1 to 99
Direction: E-W
Address range: 1 to 99
E Maple St
Length: 0.07 miles
Direction: E-W
Address range: 100 to 199
Direction: E-W
Address range: 100 to 199
E Willow St
Length: 0.05 miles
Direction: E-W
Address range: 100 to 199
Direction: E-W
Address range: 100 to 199
Grand Ct
Length: 0.04 miles
Direction: N-S
Address range: 900 to 999
Direction: N-S
Address range: 900 to 999