Washington Park neighborhood in Denver, Colorado (CO), 80209, 80210 detailed profile
Settings
X


Business Search - 14 Million verified businesses
Area: 1.248 square miles
Population: 6,295
Population density:
| Washington Park: | 5,042 people per square mile |
| Denver: | 4,651 people per square mile |

- 5,55286.0%White
- 4256.6%Hispanic or Latino
- 1582.4%Two or more races
- 1191.8%Some other race
- 831.3%Black
- 811.3%Asian
- 400.6%American Indian

Median household income in 2022:
| Washington Park: | $153,294 |
| Denver: | $88,213 |
Distribution of median household income
![Distribution of median household income]()
- 69Less than $10,000
- 165$10,000 to $19,999
- 124$20,000 to $29,999
- 163$30,000 to $39,999
- 215$40,000 to $49,999
- 86$50,000 to $59,999
- 141$60,000 to $74,999
- 150$75,000 to $99,999
- 259$100,000 to $124,999
- 145$125,000 to $149,999
- 280$150,000 to $199,999
- 1,378$200,000 or more

Distribution of owner-occupied house/condo value
![Distribution of owner-occupied house/condo value]()
- 84Less than $50,000
- 154$50,000 to $99,999
- 21$100,000 to $149,999
- 129$150,000 to $199,999
- 61$200,000 to $249,999
- 71$250,000 to $299,999
- 178$300,000 to $399,999
- 201$400,000 to $499,999
- 442$500,000 to $749,999
- 475$750,000 to $999,999
- 1,175$1,000,000 or more

Distribution of rent paid by renters
![Distribution of rent paid by renters]()
- 182$200 to $299
- 57$500 to $599
- 99$600 to $699
- 118$700 to $799
- 57$900 to $999
- 110$1,000 to $1,249
- 106$1,250 to $1,499
- 93$1,500 to $1,999
- 354$2,000 or more

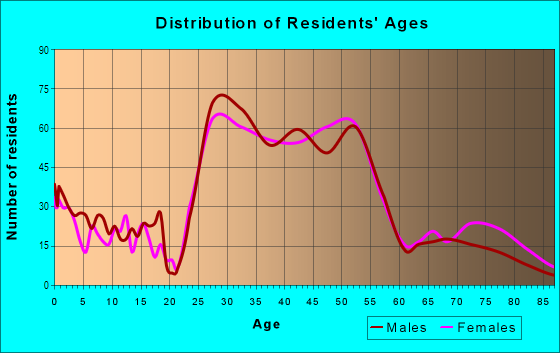
| Males: | 3,092 |
| Females: | 3,203 |
Males:
| This neighborhood: | 44.9 years |
| Whole city: | 35.2 years |
| This neighborhood: | 42.7 years |
| Whole city: | 35.1 years |
Average household size:
| Washington Park: | 4.3 people |
| Denver: | 28.0 people |
Percentage of family households:
| Washington Park: | 47.5% |
| Denver: | 35.1% |
| Here: | 57.6% |
| Denver: | 32.5% |
Percentage of married-couple families with children (among all households):
| Washington Park: | 40.8% |
| Denver: | 32.4% |
Percentage of single-mother households (among all households):
| Washington Park: | 2.8% |
| Denver: | 10.3% |
Percentage of never married males 15 years old and over:
Percentage of never married females 15 years old and over:
| Washington Park: | 11.4% |
| Denver: | 25.0% |
Percentage of never married females 15 years old and over:
| Washington Park: | 10.9% |
| city: | 20.8% |
Percentage of people that speak English not well or not at all:
| Washington Park: | 0.1% |
| Denver: | 3.9% |
Percentage of people born in this state:
Percentage of people born in another U.S. state:
Percentage of native residents but born outside the U.S.:
Percentage of foreign born residents:
| Here: | 34.8% |
| Denver: | 38.5% |
Percentage of people born in another U.S. state:
| Washington Park: | 60.9% |
| Denver: | 46.1% |
Percentage of native residents but born outside the U.S.:
| Here: | 0.4% |
| city: | 1.7% |
Percentage of foreign born residents:
| Here: | 3.9% |
| Denver: | 13.8% |

Owner-occupied
Renter-occupied


- Rooms in owner-occupied houses and condos in Washington Park
- 471 room
- 1592 rooms
- 1543 rooms
- 2144 rooms
- 1815 rooms
- 2556 rooms
- 4147 rooms
- 4078 rooms
- 9029+ rooms

- Rooms in renter-occupied apartments in Washington Park
- 481 room
- 1022 rooms
- 1173 rooms
- 1694 rooms
- 1045 rooms
- 476 rooms
- 897 rooms
- 1448 rooms
- 409+ rooms
Owner-occupied
Renter-occupied

- Bedrooms in owner-occupied houses and condos in Washington Park
- 47no bedroom
- 1611 bedroom
- 5272 bedrooms
- 6493 bedrooms
- 7054 bedrooms
- 3555+ bedrooms

- Bedrooms in renter-occupied apartments in Washington Park
- 48no bedroom
- 2591 bedroom
- 2042 bedrooms
- 833 bedrooms
- 1034 bedrooms
- 285+ bedrooms
Average number of cars or other vehicles available in houses/condos:
Average number of cars or other vehicles available in apartments:
| This neighborhood: | 2.0 |
| Denver: | 1.9 |
Average number of cars or other vehicles available in apartments:
| Here: | 1.7 |
| city: | 1.3 |
Percentage of units with a mortgage:
| Washington Park: | 63.7% |
| Denver: | 75.6% |
Average estimated value of detached houses in 2022 (76.5% of all units):
| Washington Park: | $1,338,964 |
| Colorado: | $676,667 |

- Year house built in Washington Park
- 1952020 or later
- 2902010 to 2019
- 2712000 to 2009
- 1121990 to 1999
- 461980 to 1989
- 5311970 to 1979
- 1331960 to 1969
- 2011950 to 1959
- 681940 to 1949
- 1,6351939 or earlier

City-data.com crime index for city in 2020 (higher means more crime):
| City: | 519.0 |
| U.S. average: | 219.5 |
Travel time to work (commute)
![Travel time to work (commute)]()
- 43Less than 5 minutes
- 1785 to 9 minutes
- 28410 to 14 minutes
- 53015 to 19 minutes
- 35220 to 24 minutes
- 12925 to 29 minutes
- 29330 to 34 minutes
- 13135 to 39 minutes
- 12340 to 44 minutes
- 15045 to 59 minutes
- 5760 to 89 minutes
- 3190 or more minutes

Means of transportation to work
![Means of transportation to work]()
- 57.0%1,948Drove a car alone
- 1.3%46Carpooled
- 2.6%88Bus
- 2.2%75Subway or elevated rail
- 4.0%137Long-distance train or commuter rail
- 2.9%98Light rail, streetcar or trolley
- 4.4%149Motorcycle
- 1.8%60Bicycle
- 1.7%59Walked
- 3.0%101Other means
- 36.3%1,241Worked at home

Time leaving home to go to work
![Time leaving home to go to work]()
- 33912:00 a.m. to 4:59 a.m.
- 235:00 a.m. to 5:29 a.m.
- 325:30 a.m. to 5:59 a.m.
- 1176:00 a.m. to 6:29 a.m.
- 1996:30 a.m. to 6:59 a.m.
- 3407:00 a.m. to 7:29 a.m.
- 4437:30 a.m. to 7:59 a.m.
- 6188:00 a.m. to 8:29 a.m.
- 1138:30 a.m. to 8:59 a.m.
- 2269:00 a.m. to 9:59 a.m.
- 3110:00 a.m. to 10:59 a.m.
- 1211:00 a.m. to 11:59 a.m.
- 6112:00 p.m. to 3:59 p.m.
- 324:00 p.m. to 11:59 p.m.

Occupations of males:
- Percentage of males in management occupations (except farmers):
Here: 27.9% city: 15.4%
- Percentage of males in business and financial operations occupations:
Here: 14.5% city: 8.3%
- Percentage of males in computer and mathematical occupations:
Here: 5.9% city: 7.4%
- Percentage of males in architecture and engineering occupations:
Here: 6.8% city: 4.5%
- Percentage of males in life, physical, and social science occupations:
Here: 1.3% city: 1.4%
- Percentage of males in legal occupations:
Here: 7.6% city: 2.3%
- Percentage of males in education, training, and library occupations:
Here: 2.8% city: 3.1%
- Percentage of males in arts, design, entertainment, sports, and media occupations:
Here: 1.3% city: 3.1%
- Percentage of males in healthcare practitioners and technical occupations:
Here: 4.4% city: 3.5%
- Percentage of males in service occupations:
Here: 4.8% city: 11.9%
- Percentage of males in sales and office occupations:
Here: 16.3% city: 15.4%
- Percentage of males in construction, extraction, and maintenance occupations:
Here: 1.6% city: 8.0%
- Percentage of males in transportation occupations:
Here: 3.6% city: 4.2%
Occupations of females:
- Percentage of females in management occupations (except farmers):
Here: 16.9% city: 14.0%
- Percentage of females in business and financial operations occupations:
Here: 10.7% city: 10.0%
- Percentage of females in computer and mathematical occupations:
Here: 2.9% city: 2.9%
- Percentage of females in community and social services occupations:
Here: 4.0% city: 3.0%
- Percentage of females in legal occupations:
Here: 2.9% city: 2.4%
- Percentage of females in education, training, and library occupations:
Here: 5.4% city: 7.9%
- Percentage of females in arts, design, entertainment, sports, and media occupations:
Here: 3.0% city: 3.8%
- Percentage of females in healthcare practitioners and technical occupations:
Here: 14.9% city: 10.2%
- Percentage of females in service occupations:
Here: 12.8% city: 16.2%
- Percentage of females in sales and office occupations:
Here: 24.6% city: 21.4%
Percentage of people 16-64 in Armed Forces:
| Washington Park: | 0.1% |
| Denver: | 0.3% |
Education in this neighborhood (subdivision or community):
- Percentage of people 3 years and older in K-12 schools:
Washington Park: 16.8% Denver: 12.7%
- Percentage of people 3 years and older in undergraduate colleges:
Washington Park: 5.2% Denver: 4.1%
- Percentage of people 3 years and older in grad. or professional schools:
Washington Park: 1.6% Denver: 2.2%
- Percentage of students K-12 enrolled in private schools:
Washington Park: 48.4% Denver: 11.0%
Percentage of population below poverty level:
| Washington Park: | 4.6% |
| Denver: | 11.8% |
Median year owner moved in (as recorded in 2022):
Median year renter moved in (as recorded in 2022):
| Washington Park: | 2007 |
| Denver: | 2014 |
Median year renter moved in (as recorded in 2022):
| Washington Park: | 2016 |
| Denver: | 2021 |
Percentage of married-couple families with both working:
| Washington Park: | 96.1% |
| Denver: | 74.1% |

- 73.3%Utility gas
- 22.1%Electricity
- 2.2%Bottled, tank, or LP gas
- 1.6%Solar energy
- 0.8%Other fuel
Limited-access highways (interstate or state) in this neighborhood:
I- 25 (S Valley Hwy, US Hwy 87)
Length: 0.71 miles
Directions: E-W, SE-NW
Directions: E-W, SE-NW
Roads and streets:
S Gaylord St
Length: 1.50 miles
Directions: N-S, SE-NW, SW-NE
Address range: 400 to 1599
Directions: N-S, SE-NW, SW-NE
Address range: 400 to 1599
S York St
Length: 1.50 miles
Direction: N-S
Address range: 400 to 1599
Direction: N-S
Address range: 400 to 1599
S Vine St
Length: 1.50 miles
Direction: N-S
Address range: 400 to 1599
Direction: N-S
Address range: 400 to 1599
S Race St
Length: 1.38 miles
Directions: N-S, SW-NE
Address range: 400 to 1506
Directions: N-S, SW-NE
Address range: 400 to 1506
S Franklin St
Length: 1.38 miles
Direction: N-S
Address range: 400 to 1579
Direction: N-S
Address range: 400 to 1579
S Humboldt St
Length: 1.33 miles
Directions: E-W, N-S, SE-NW, SW-NE
Address range: 400 to 1549
Directions: E-W, N-S, SE-NW, SW-NE
Address range: 400 to 1549
S Gilpin St
Length: 1.13 miles
Directions: N-S, SE-NW, SW-NE
Address range: 400 to 1299
Directions: N-S, SE-NW, SW-NE
Address range: 400 to 1299
S Williams St
Length: 1.13 miles
Directions: N-S, SW-NE
Address range: 400 to 1299
Directions: N-S, SW-NE
Address range: 400 to 1299
S High St
Length: 1.13 miles
Directions: N-S, SW-NE
Address range: 400 to 1299
Directions: N-S, SW-NE
Address range: 400 to 1299
E Virginia Ave
Length: 0.93 miles
Direction: E-W
Address range: 1240 to 2399
Direction: E-W
Address range: 1240 to 2399
E Dakota Ave
Length: 0.90 miles
Direction: E-W
Address range: 1282 to 2399
Direction: E-W
Address range: 1282 to 2399
E Louisiana Ave
Length: 0.89 miles
Direction: E-W
Address range: 1300 to 2348
Direction: E-W
Address range: 1300 to 2348
S University Blvd
Length: 0.82 miles
Directions: N-S, SE-NW, SW-NE
Address range: 401 to 1799
Directions: N-S, SE-NW, SW-NE
Address range: 401 to 1799
I25 Fwy (I25 Nb, 25, State Hwy)
Length: 0.76 miles
Directions: E-W, SE-NW
Directions: E-W, SE-NW
E Arizona Ave
Length: 0.66 miles
Directions: E-W, N-S, SE-NW
Address range: 1600 to 2349
Directions: E-W, N-S, SE-NW
Address range: 1600 to 2349
E Tennessee Ave
Length: 0.65 miles
Direction: E-W
Address range: 1600 to 2349
Direction: E-W
Address range: 1600 to 2349
E Kentucky Ave
Length: 0.65 miles
Direction: E-W
Address range: 1600 to 2349
Direction: E-W
Address range: 1600 to 2349
E Mississippi Ave
Length: 0.65 miles
Direction: E-W
Address range: 1600 to 2379
Direction: E-W
Address range: 1600 to 2379
E Center Ave
Length: 0.65 miles
Direction: E-W
Address range: 1600 to 2399
Direction: E-W
Address range: 1600 to 2399
E Ohio Ave
Length: 0.65 miles
Direction: E-W
Address range: 1600 to 2349
Direction: E-W
Address range: 1600 to 2349
E Exposition Ave
Length: 0.64 miles
Direction: E-W
Address range: 1600 to 2399
Direction: E-W
Address range: 1600 to 2399
E Arkansas Ave
Length: 0.57 miles
Direction: E-W
Address range: 1300 to 2349
Direction: E-W
Address range: 1300 to 2349
E Florida Ave
Length: 0.56 miles
Directions: E-W, SE-NW
Address range: 1300 to 2349
Directions: E-W, SE-NW
Address range: 1300 to 2349
S Marion Pkwy
Length: 0.56 miles
Directions: E-W, N-S, SE-NW, SW-NE
Address range: 400 to 899
Directions: E-W, N-S, SE-NW, SW-NE
Address range: 400 to 899
S Lafayette St
Length: 0.37 miles
Direction: N-S
Address range: 400 to 1499
Direction: N-S
Address range: 400 to 1499
E Iowa Ave
Length: 0.24 miles
Direction: E-W
Address range: 2001 to 2348
Direction: E-W
Address range: 2001 to 2348
S Marion St
Length: 0.19 miles
Direction: N-S
Address range: 1300 to 1471
Direction: N-S
Address range: 1300 to 1471