Waterfront neighborhood in Bellingham, Washington (WA), 98225 detailed profile
Settings
X


Business Search - 14 Million verified businesses
Area: 1.006 square miles
Population: 4,726
Population density:
| Waterfront: | 4,699 people per square mile |
| Bellingham: | 3,662 people per square mile |

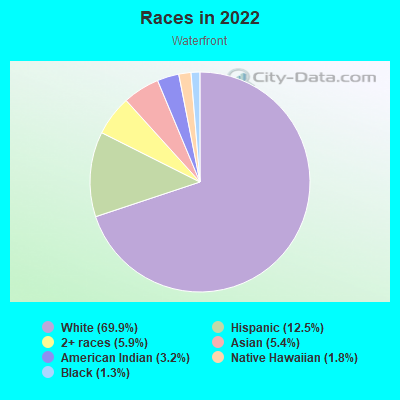
- 3,30069.9%White
- 58912.5%Hispanic or Latino
- 2805.9%Two or more races
- 2575.4%Asian
- 1523.2%American Indian
- 851.8%Native Hawaiian and Other
Pacific Islander - 601.3%Black
Median household income in 2022:
| Waterfront: | $28,384 |
| Bellingham: | $64,748 |
Distribution of median household income
![Distribution of median household income]()
- 564Less than $10,000
- 556$10,000 to $19,999
- 410$20,000 to $29,999
- 208$30,000 to $39,999
- 181$40,000 to $49,999
- 303$50,000 to $59,999
- 294$60,000 to $74,999
- 275$75,000 to $99,999
- 67$100,000 to $124,999
- 22$125,000 to $149,999
- 22$200,000 or more

Distribution of owner-occupied house/condo value
![Distribution of owner-occupied house/condo value]()
- 18$250,000 to $299,999
- 93$300,000 to $399,999
- 24$400,000 to $499,999
- 9$500,000 to $749,999

Distribution of rent paid by renters
![Distribution of rent paid by renters]()
- 159$200 to $299
- 9$300 to $399
- 78$400 to $499
- 22$500 to $599
- 245$600 to $699
- 166$700 to $799
- 125$800 to $899
- 196$900 to $999
- 847$1,000 to $1,249
- 399$1,250 to $1,499
- 369$1,500 to $1,999
- 54$2,000 or more

Median rent in 2022:
| Waterfront: | $1,099 |
| Bellingham: | $1,372 |
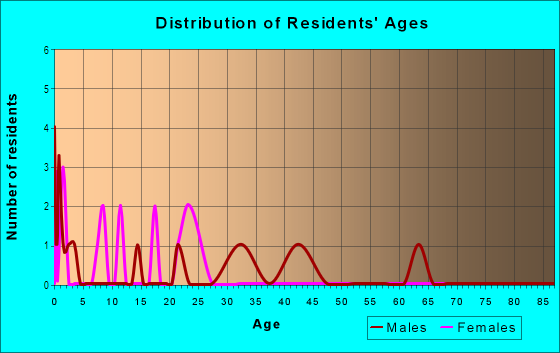
| Males: | 2,903 |
| Females: | 1,822 |
Males:
| This neighborhood: | 30.1 years |
| Whole city: | 35.5 years |
| This neighborhood: | 28.6 years |
| Whole city: | 33.5 years |
Average household size:
| Waterfront: | 1.4 people |
| Bellingham: | 2.1 people |
Percentage of family households:
| Waterfront: | 13.8% |
| Bellingham: | 30.7% |
| Here: | 6.4% |
| Bellingham: | 34.3% |
Percentage of married-couple families with children (among all households):
| Waterfront: | 0.0% |
| Bellingham: | 29.6% |
Percentage of single-mother households (among all households):
| Waterfront: | 50.7% |
| Bellingham: | 11.1% |
Percentage of never married males 15 years old and over:
Percentage of never married females 15 years old and over:
| Waterfront: | 45.1% |
| Bellingham: | 22.3% |
Percentage of never married females 15 years old and over:
| Waterfront: | 21.8% |
| city: | 23.0% |
Percentage of people that speak English not well or not at all:
| Waterfront: | 1.0% |
| Bellingham: | 1.4% |
Percentage of people born in this state:
Percentage of people born in another U.S. state:
Percentage of native residents but born outside the U.S.:
Percentage of foreign born residents:
| Here: | 43.1% |
| Bellingham: | 46.3% |
Percentage of people born in another U.S. state:
| Waterfront: | 43.1% |
| Bellingham: | 40.0% |
Percentage of native residents but born outside the U.S.:
| Here: | 3.6% |
| city: | 2.9% |
Percentage of foreign born residents:
| Here: | 10.1% |
| Bellingham: | 10.8% |
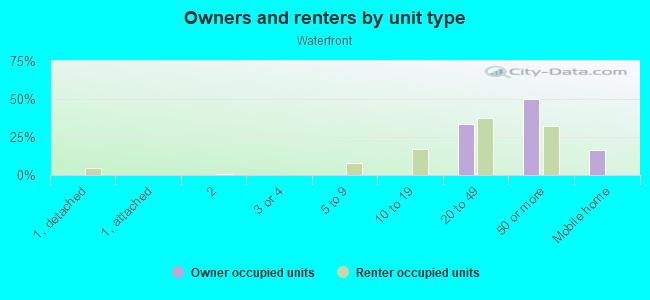
Owner-occupied
Renter-occupied

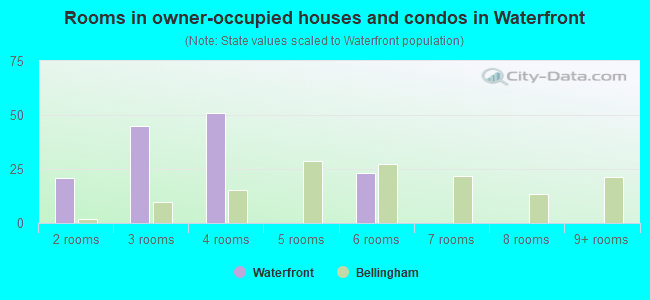
- Rooms in owner-occupied houses and condos in Waterfront
- 01 room
- 212 rooms
- 453 rooms
- 514 rooms
- 05 rooms
- 236 rooms
- 07 rooms
- 08 rooms
- 09+ rooms
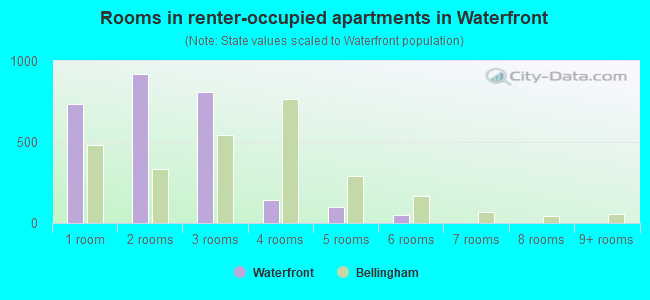
- Rooms in renter-occupied apartments in Waterfront
- 7351 room
- 9192 rooms
- 8083 rooms
- 1454 rooms
- 985 rooms
- 476 rooms
- 07 rooms
- 08 rooms
- 09+ rooms
Owner-occupied
Renter-occupied
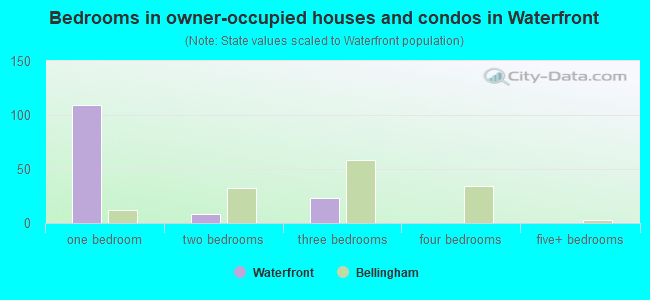
- Bedrooms in owner-occupied houses and condos in Waterfront
- 0no bedroom
- 1091 bedroom
- 82 bedrooms
- 233 bedrooms
- 04 bedrooms
- 05+ bedrooms
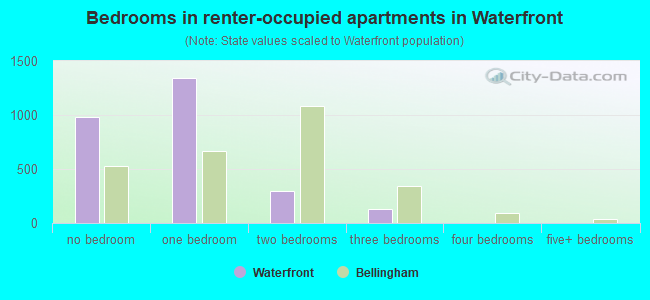
- Bedrooms in renter-occupied apartments in Waterfront
- 984no bedroom
- 1,3461 bedroom
- 2982 bedrooms
- 1263 bedrooms
- 04 bedrooms
- 05+ bedrooms
Average number of cars or other vehicles available in houses/condos:
Average number of cars or other vehicles available in apartments:
| This neighborhood: | 0.5 |
| Bellingham: | 2.0 |
Average number of cars or other vehicles available in apartments:
| Here: | 1.0 |
| city: | 1.5 |
Percentage of units with a mortgage:
| Waterfront: | 59.1% |
| Bellingham: | 61.8% |
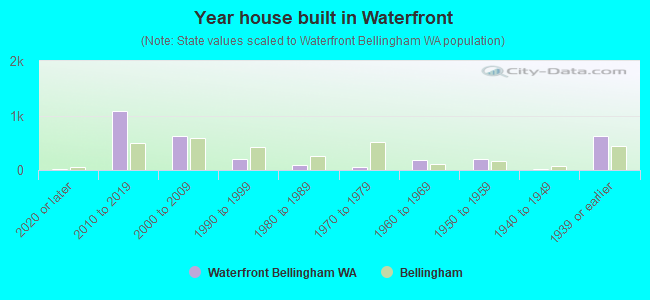
- Year house built in Waterfront
- 232020 or later
- 1,0822010 to 2019
- 6262000 to 2009
- 1951990 to 1999
- 901980 to 1989
- 601970 to 1979
- 1841960 to 1969
- 2011950 to 1959
- 211940 to 1949
- 6261939 or earlier
City-data.com crime index for city in 2020 (higher means more crime):
| City: | 298.0 |
| U.S. average: | 219.5 |
Travel time to work (commute)
![Travel time to work (commute)]()
- 36Less than 5 minutes
- 3475 to 9 minutes
- 23110 to 14 minutes
- 31415 to 19 minutes
- 14620 to 24 minutes
- 5530 to 34 minutes
- 1640 to 44 minutes
- 2745 to 59 minutes
- 6260 to 89 minutes
- 6090 or more minutes

Means of transportation to work
![Means of transportation to work]()
- 50.7%1,029Drove a car alone
- 4.4%90Carpooled
- 9.5%192Bus
- 1.0%21Motorcycle
- 1.1%23Bicycle
- 22.2%450Walked
- 1.1%23Other means
- 9.7%197Worked at home

Time leaving home to go to work
![Time leaving home to go to work]()
- 1512:00 a.m. to 4:59 a.m.
- 135:30 a.m. to 5:59 a.m.
- 716:00 a.m. to 6:29 a.m.
- 516:30 a.m. to 6:59 a.m.
- 547:00 a.m. to 7:29 a.m.
- 1667:30 a.m. to 7:59 a.m.
- 1708:00 a.m. to 8:29 a.m.
- 1728:30 a.m. to 8:59 a.m.
- 639:00 a.m. to 9:59 a.m.
- 10710:00 a.m. to 10:59 a.m.
- 1611:00 a.m. to 11:59 a.m.
- 28412:00 p.m. to 3:59 p.m.
- 1044:00 p.m. to 11:59 p.m.

Occupations of males:
- Percentage of males in management occupations (except farmers):
Here: 5.5% city: 13.7%
- Percentage of males in business and financial operations occupations:
Here: 5.4% city: 4.6%
- Percentage of males in computer and mathematical occupations:
Here: 13.1% city: 4.2%
- Percentage of males in architecture and engineering occupations:
Here: 2.2% city: 4.5%
- Percentage of males in life, physical, and social science occupations:
Here: 1.8% city: 1.6%
- Percentage of males in community and social services occupations:
Here: 2.6% city: 1.6%
- Percentage of males in education, training, and library occupations:
Here: 6.1% city: 4.5%
- Percentage of males in arts, design, entertainment, sports, and media occupations:
Here: 4.4% city: 2.3%
- Percentage of males in healthcare practitioners and technical occupations:
Here: 1.1% city: 4.0%
- Percentage of males in service occupations:
Here: 21.4% city: 17.8%
- Percentage of males in sales and office occupations:
Here: 19.0% city: 13.8%
- Percentage of males in production occupations:
Here: 7.2% city: 6.9%
- Percentage of males in material moving occupations:
Here: 8.1% city: 5.0%
Occupations of females:
- Percentage of females in management occupations (except farmers):
Here: 6.8% city: 8.2%
- Percentage of females in business and financial operations occupations:
Here: 3.8% city: 5.9%
- Percentage of females in life, physical, and social science occupations:
Here: 2.6% city: 1.0%
- Percentage of females in community and social services occupations:
Here: 1.8% city: 3.8%
- Percentage of females in education, training, and library occupations:
Here: 26.9% city: 11.2%
- Percentage of females in service occupations:
Here: 24.9% city: 26.0%
- Percentage of females in sales and office occupations:
Here: 24.1% city: 22.8%
- Percentage of females in production occupations:
Here: 6.8% city: 3.1%
- Percentage of females in material moving occupations:
Here: 2.2% city: 1.6%
Percentage of people 16-64 in Armed Forces:
| Waterfront: | 1.2% |
| Bellingham: | 0.3% |
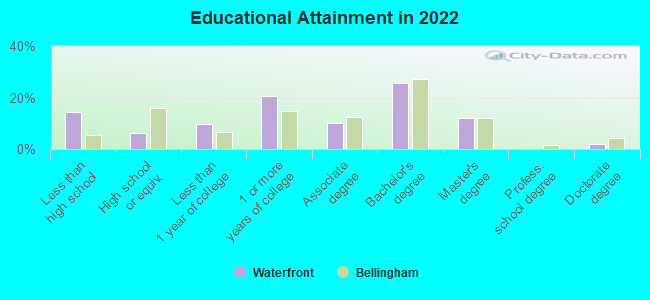
Education in this neighborhood (subdivision or community):
- Percentage of people 3 years and older in K-12 schools:
Waterfront: 7.6% Bellingham: 12.3%
- Percentage of people 3 years and older in undergraduate colleges:
Waterfront: 19.6% Bellingham: 15.0%
- Percentage of people 3 years and older in grad. or professional schools:
Waterfront: 2.5% Bellingham: 1.7%
- Percentage of students K-12 enrolled in private schools:
Waterfront: 0.0% Bellingham: 28.6%
Percentage of population below poverty level:
| Waterfront: | 39.5% |
| Bellingham: | 14.3% |
Median year owner moved in (as recorded in 2022):
Median year renter moved in (as recorded in 2022):
| Waterfront: | 2015 |
| Bellingham: | 2012 |
Median year renter moved in (as recorded in 2022):
| Waterfront: | 2019 |
| Bellingham: | 2020 |
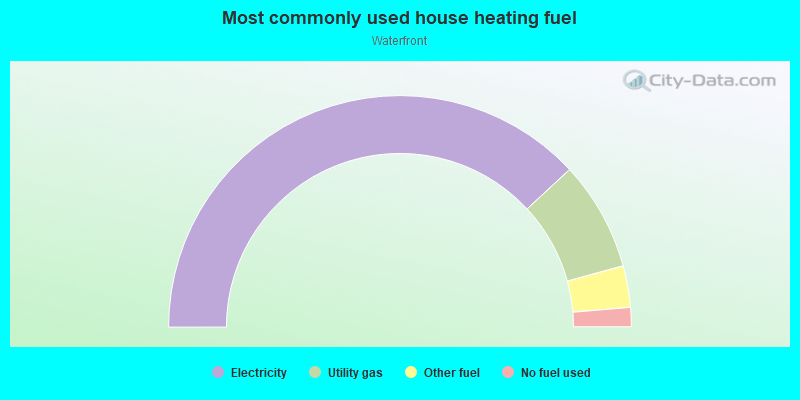
- 76.2%Electricity
- 15.3%Utility gas
- 5.8%Other fuel
- 2.7%No fuel used
Roads and streets:
Roeder Ave
Length: 1.21 miles
Directions: E-W, N-S, SE-NW
Address range: 1600 to 2999
Directions: E-W, N-S, SE-NW
Address range: 1600 to 2999
Cornwall Ave
Length: 0.62 miles
Direction: SW-NE
Address range: 400 to 999
Direction: SW-NE
Address range: 400 to 999
Coho Way
Length: 0.54 miles
Directions: N-S, SE-NW, SW-NE
Address range: 1 to 899
Directions: N-S, SE-NW, SW-NE
Address range: 1 to 899
N Harbor Loop Dr
Length: 0.50 miles
Directions: E-W, N-S, SE-NW
Address range: 2400 to 2699
Directions: E-W, N-S, SE-NW
Address range: 2400 to 2699
Pine St
Length: 0.38 miles
Directions: E-W, SE-NW
Address range: 99 to 198
Directions: E-W, SE-NW
Address range: 99 to 198
Squalicum Way (Squalicum Pkwy)
Length: 0.33 miles
Directions: N-S, SW-NE
Address range: 1 to 899
Directions: N-S, SW-NE
Address range: 1 to 899
Wharf St
Length: 0.31 miles
Directions: E-W, SW-NE
Directions: E-W, SW-NE
W Laurel St
Length: 0.26 miles
Directions: E-W, SE-NW
Address range: 100 to 499
Directions: E-W, SE-NW
Address range: 100 to 499
C St
Length: 0.25 miles
Direction: SW-NE
Address range: 900 to 1145
Direction: SW-NE
Address range: 900 to 1145
Boulevard St
Length: 0.24 miles
Directions: E-W, SW-NE
Address range: 387 to 798
Directions: E-W, SW-NE
Address range: 387 to 798
Beal Memorial Way
Length: 0.24 miles
Direction: SE-NW
Address range: 100 to 499
Direction: SE-NW
Address range: 100 to 499
E Ivy St
Length: 0.15 miles
Direction: SE-NW
Direction: SE-NW
Railroad Ave
Length: 0.12 miles
Direction: SW-NE
Direction: SW-NE
W Chestnut St
Length: 0.12 miles
Direction: SE-NW
Address range: 600 to 799
Direction: SE-NW
Address range: 600 to 799
W Maple St
Length: 0.11 miles
Direction: SE-NW
Direction: SE-NW
E Oak St
Length: 0.08 miles
Direction: SE-NW
Direction: SE-NW
E Pine St
Length: 0.06 miles
Direction: SE-NW
Direction: SE-NW
E Laurel St
Length: 0.04 miles
Direction: SE-NW
Direction: SE-NW
Railroad features:
Burlington Northern Santa Fe Rlwy
Length: 2.11 miles
Directions: E-W, N-S, SE-NW, SW-NE
Directions: E-W, N-S, SE-NW, SW-NE
B N R R
Length: 0.05 miles
Direction: E-W
Direction: E-W
Other features:
Squalicum Crk
Length: 0.12 miles
Directions: N-S, SW-NE
Directions: N-S, SW-NE