Waterfront neighborhood in Peekskill, New York (NY), 10566 detailed profile
Settings
X


Business Search - 14 Million verified businesses
Area: 0.105 square miles
Population: 1,216
Population density:
| Waterfront: | 11,538 people per square mile |
| Peekskill: | 5,874 people per square mile |

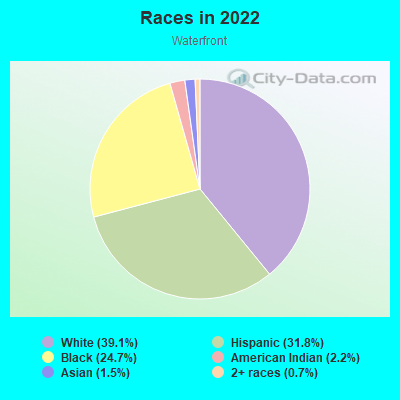
- 69557.2%White
- 32226.5%Hispanic or Latino
- 1018.3%Two or more races
- 685.6%Black
- 151.2%Asian
- 121.0%American Indian
- 20.2%Some other race
Median household income in 2022:
| Waterfront: | $90,956 |
| Peekskill: | $86,695 |
Distribution of median household income
![Distribution of median household income]()
- 43Less than $10,000
- 66$10,000 to $19,999
- 8$20,000 to $29,999
- 5$30,000 to $39,999
- 31$40,000 to $49,999
- 7$50,000 to $59,999
- 106$60,000 to $74,999
- 49$75,000 to $99,999
- 59$100,000 to $124,999
- 46$125,000 to $149,999
- 48$150,000 to $199,999
- 71$200,000 or more

Distribution of owner-occupied house/condo value
![Distribution of owner-occupied house/condo value]()
- 5Less than $50,000
- 53$50,000 to $99,999
- 1$150,000 to $199,999
- 2$200,000 to $249,999
- 79$250,000 to $299,999
- 34$300,000 to $399,999
- 159$400,000 to $499,999
- 110$500,000 to $749,999
- 3$750,000 to $999,999

Distribution of rent paid by renters
![Distribution of rent paid by renters]()
- 2Less than $100
- 3$100 to $199
- 10$200 to $299
- 4$300 to $399
- 26$400 to $499
- 6$500 to $599
- 2$600 to $699
- 4$700 to $799
- 12$1,000 to $1,249
- 40$1,250 to $1,499
- 17$1,500 to $1,999
- 20$2,000 or more

Median rent in 2022:
| Waterfront: | $1,345 |
| Peekskill: | $1,578 |
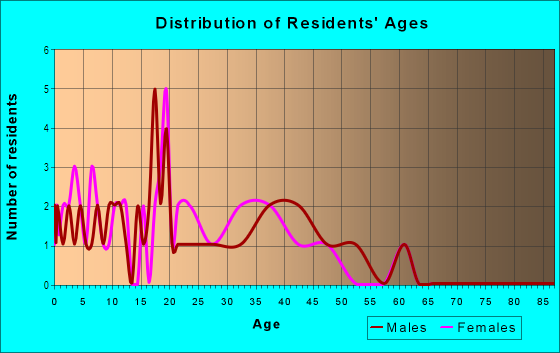
| Males: | 616 |
| Females: | 600 |
Males:
| This neighborhood: | 38.6 years |
| Whole city: | 40.2 years |
| This neighborhood: | 41.9 years |
| Whole city: | 43.4 years |
Average household size:
| Waterfront: | 2.4 people |
| Peekskill: | 2.3 people |
Percentage of family households:
| Waterfront: | 54.8% |
| Peekskill: | 44.3% |
| Here: | 47.9% |
| Peekskill: | 40.1% |
Percentage of married-couple families with children (among all households):
| Waterfront: | 36.9% |
| Peekskill: | 30.9% |
Percentage of single-mother households (among all households):
| Waterfront: | 4.6% |
| Peekskill: | 9.8% |
Percentage of never married males 15 years old and over:
Percentage of never married females 15 years old and over:
| Waterfront: | 10.8% |
| Peekskill: | 19.1% |
Percentage of never married females 15 years old and over:
| Waterfront: | 21.7% |
| city: | 18.8% |
Percentage of people that speak English not well or not at all:
| Waterfront: | 15.7% |
| Peekskill: | 8.4% |
Percentage of people born in this state:
Percentage of people born in another U.S. state:
Percentage of native residents but born outside the U.S.:
Percentage of foreign born residents:
| Here: | 62.5% |
| Peekskill: | 60.2% |
Percentage of people born in another U.S. state:
| Waterfront: | 11.0% |
| Peekskill: | 8.6% |
Percentage of native residents but born outside the U.S.:
| Here: | 3.1% |
| city: | 4.2% |
Percentage of foreign born residents:
| Here: | 23.4% |
| Peekskill: | 27.0% |
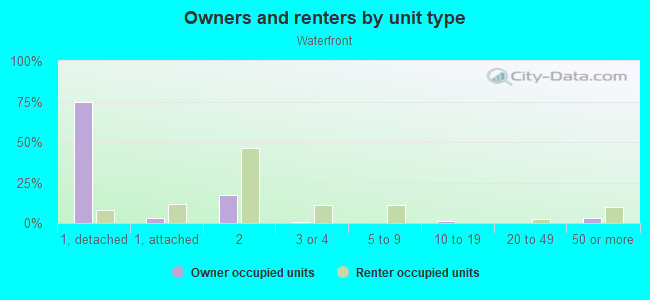
Owner-occupied
Renter-occupied

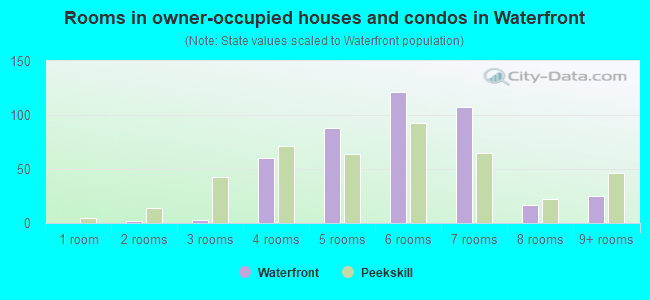
- Rooms in owner-occupied houses and condos in Waterfront
- 01 room
- 22 rooms
- 33 rooms
- 604 rooms
- 885 rooms
- 1216 rooms
- 1077 rooms
- 178 rooms
- 259+ rooms
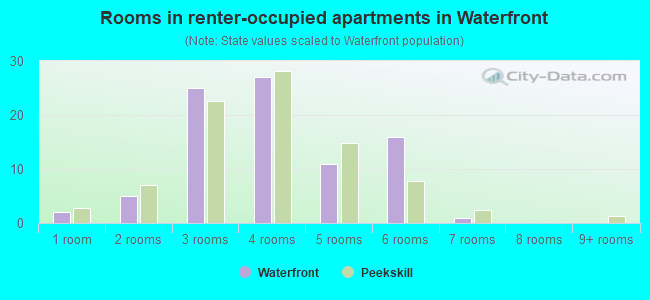
- Rooms in renter-occupied apartments in Waterfront
- 21 room
- 52 rooms
- 253 rooms
- 274 rooms
- 115 rooms
- 166 rooms
- 17 rooms
- 08 rooms
- 09+ rooms
Owner-occupied
Renter-occupied
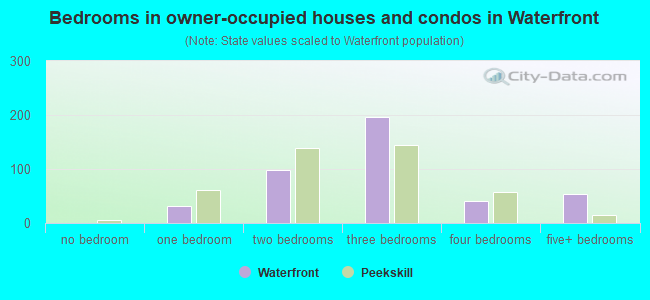
- Bedrooms in owner-occupied houses and condos in Waterfront
- 0no bedroom
- 311 bedroom
- 982 bedrooms
- 1973 bedrooms
- 414 bedrooms
- 535+ bedrooms
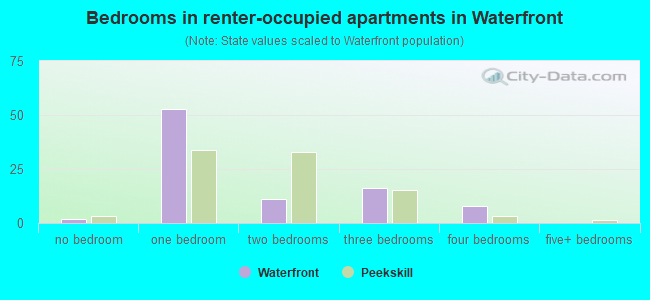
- Bedrooms in renter-occupied apartments in Waterfront
- 2no bedroom
- 531 bedroom
- 112 bedrooms
- 163 bedrooms
- 84 bedrooms
- 05+ bedrooms
Average number of cars or other vehicles available in houses/condos:
Average number of cars or other vehicles available in apartments:
| This neighborhood: | 2.0 |
| Peekskill: | 1.8 |
Average number of cars or other vehicles available in apartments:
| Here: | 0.9 |
| city: | 1.0 |
Percentage of units with a mortgage:
| Waterfront: | 76.3% |
| Peekskill: | 63.7% |
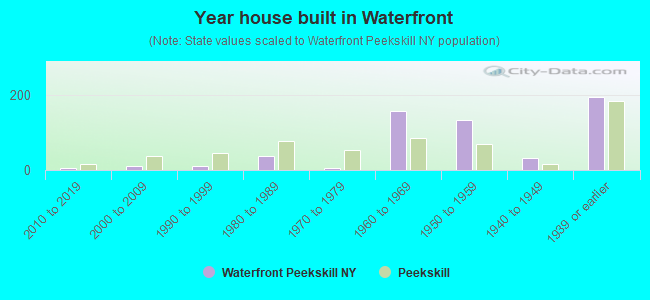
- Year house built in Waterfront
- 02020 or later
- 62010 to 2019
- 122000 to 2009
- 111990 to 1999
- 371980 to 1989
- 61970 to 1979
- 1571960 to 1969
- 1341950 to 1959
- 311940 to 1949
- 1941939 or earlier
City-data.com crime index for city in 2020 (higher means more crime):
| City: | 94.1 |
| U.S. average: | 219.5 |
Travel time to work (commute)
![Travel time to work (commute)]()
- 9Less than 5 minutes
- 165 to 9 minutes
- 1010 to 14 minutes
- 2515 to 19 minutes
- 1920 to 24 minutes
- 1530 to 34 minutes
- 435 to 39 minutes
- 1540 to 44 minutes
- 6045 to 59 minutes
- 2560 to 89 minutes
- 2690 or more minutes

Means of transportation to work
![Means of transportation to work]()
- 65.0%423Drove a car alone
- 12.7%83Carpooled
- 0.9%6Bus
- 15.1%98Long-distance train or commuter rail
- 0.2%1Taxi
- 1.7%11Walked
- 6.9%45Worked at home

Time leaving home to go to work
![Time leaving home to go to work]()
- 1412:00 a.m. to 4:59 a.m.
- 55:00 a.m. to 5:29 a.m.
- 25:30 a.m. to 5:59 a.m.
- 206:00 a.m. to 6:29 a.m.
- 196:30 a.m. to 6:59 a.m.
- 187:00 a.m. to 7:29 a.m.
- 277:30 a.m. to 7:59 a.m.
- 288:00 a.m. to 8:29 a.m.
- 108:30 a.m. to 8:59 a.m.
- 189:00 a.m. to 9:59 a.m.
- 710:00 a.m. to 10:59 a.m.
- 311:00 a.m. to 11:59 a.m.
- 312:00 p.m. to 3:59 p.m.
- 74:00 p.m. to 11:59 p.m.

Occupations of males:
- Percentage of males in management occupations (except farmers):
Here: 10.3% city: 13.5%
- Percentage of males in business and financial operations occupations:
Here: 2.8% city: 4.1%
- Percentage of males in computer and mathematical occupations:
Here: 2.7% city: 3.5%
- Percentage of males in architecture and engineering occupations:
Here: 2.5% city: 2.7%
- Percentage of males in community and social services occupations:
Here: 12.4% city: 0.9%
- Percentage of males in education, training, and library occupations:
Here: 4.0% city: 2.3%
- Percentage of males in arts, design, entertainment, sports, and media occupations:
Here: 25.3% city: 6.7%
- Percentage of males in healthcare practitioners and technical occupations:
Here: 6.0% city: 3.1%
- Percentage of males in service occupations:
Here: 23.8% city: 19.6%
- Percentage of males in sales and office occupations:
Here: 16.9% city: 10.3%
- Percentage of males in farming, fishing, and forestry occupations:
Here: 1.6% city: 0.6%
- Percentage of males in construction, extraction, and maintenance occupations:
Here: 17.3% city: 15.2%
- Percentage of males in production occupations:
Here: 4.0% city: 2.3%
- Percentage of males in transportation occupations:
Here: 13.8% city: 6.1%
- Percentage of males in material moving occupations:
Here: 15.2% city: 3.9%
Occupations of females:
- Percentage of females in management occupations (except farmers):
Here: 7.3% city: 7.8%
- Percentage of females in business and financial operations occupations:
Here: 18.9% city: 4.0%
- Percentage of females in computer and mathematical occupations:
Here: 3.6% city: 1.2%
- Percentage of females in life, physical, and social science occupations:
Here: 2.5% city: 0.4%
- Percentage of females in community and social services occupations:
Here: 13.3% city: 5.7%
- Percentage of females in education, training, and library occupations:
Here: 10.4% city: 11.4%
- Percentage of females in arts, design, entertainment, sports, and media occupations:
Here: 7.6% city: 3.7%
- Percentage of females in healthcare practitioners and technical occupations:
Here: 20.0% city: 12.0%
- Percentage of females in service occupations:
Here: 8.4% city: 20.2%
- Percentage of females in sales and office occupations:
Here: 10.4% city: 28.6%
- Percentage of females in material moving occupations:
Here: 5.2% city: 2.4%
Percentage of people 16-64 in Armed Forces:
| Waterfront: | 0.2% |
| Peekskill: | 0.6% |
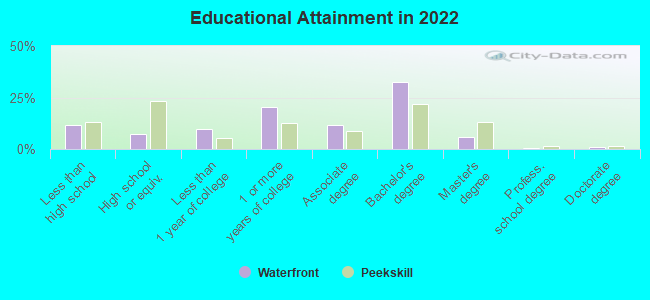
Education in this neighborhood (subdivision or community):
- Percentage of people 3 years and older in K-12 schools:
Waterfront: 14.3% Peekskill: 12.8%
- Percentage of people 3 years and older in undergraduate colleges:
Waterfront: 2.6% Peekskill: 4.2%
- Percentage of people 3 years and older in grad. or professional schools:
Waterfront: 0.2% Peekskill: 1.2%
- Percentage of students K-12 enrolled in private schools:
Waterfront: 0.6% Peekskill: 9.2%
Percentage of population below poverty level:
| Waterfront: | 10.9% |
| Peekskill: | 9.6% |
Median year owner moved in (as recorded in 2022):
Median year renter moved in (as recorded in 2022):
| Waterfront: | 2000 |
| Peekskill: | 2005 |
Median year renter moved in (as recorded in 2022):
| Waterfront: | 2012 |
| Peekskill: | 2014 |
Percentage of married-couple families with both working:
| Waterfront: | 81.7% |
| Peekskill: | 84.3% |
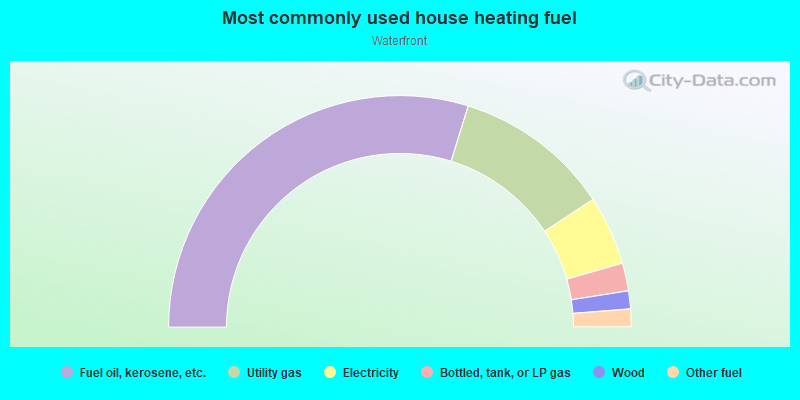
- 59.6%Fuel oil, kerosene, etc.
- 21.9%Utility gas
- 9.7%Electricity
- 3.9%Bottled, tank, or LP gas
- 2.5%Wood
- 2.5%Other fuel
Limited-access highways (interstate or state) in this neighborhood:
Briarcliff-Peekskill Pkwy (US Hwy 9)
Length: 0.63 miles
Directions: N-S, SE-NW, SW-NE
Directions: N-S, SE-NW, SW-NE
Roads and streets:
Lower South St
Length: 0.24 miles
Directions: N-S, SW-NE
Address range: 400 to 426
Directions: N-S, SW-NE
Address range: 400 to 426
N Water St
Length: 0.21 miles
Directions: E-W, N-S, SE-NW
Address range: 1 to 298
Directions: E-W, N-S, SE-NW
Address range: 1 to 298
Old Pemart Ave
Length: 0.19 miles
Directions: E-W, SE-NW
Directions: E-W, SE-NW
Main St
Length: 0.18 miles
Directions: E-W, SE-NW, SW-NE
Address range: 400 to 602
Directions: E-W, SE-NW, SW-NE
Address range: 400 to 602
Hudson Ave
Length: 0.18 miles
Directions: E-W, SW-NE
Address range: 1 to 97
Directions: E-W, SW-NE
Address range: 1 to 97
S Water St
Length: 0.17 miles
Directions: N-S, SW-NE
Address range: 1 to 99
Directions: N-S, SW-NE
Address range: 1 to 99
Requa St
Length: 0.15 miles
Directions: E-W, N-S, SE-NW
Address range: 100 to 199
Directions: E-W, N-S, SE-NW
Address range: 100 to 199
Railroad Ave
Length: 0.13 miles
Directions: N-S, SW-NE
Address range: 300 to 399
Directions: N-S, SW-NE
Address range: 300 to 399
West St
Length: 0.03 miles
Direction: E-W
Address range: 1 to 99
Direction: E-W
Address range: 1 to 99
Central Ave
Length: 0.02 miles
Directions: E-W, SW-NE
Address range: 400 to 407
Directions: E-W, SW-NE
Address range: 400 to 407
Railroad features:
Conrail RR
Length: 0.40 miles
Directions: N-S, SE-NW, SW-NE
Directions: N-S, SE-NW, SW-NE
Other features:
McGregory Brk
Length: 0.22 miles
Direction: E-W
Direction: E-W