Wealthy neighborhood in Grand Rapids, Michigan (MI), 49503, 49506 detailed profile
Settings
X


Business Search - 14 Million verified businesses
Area: 0.372 square miles
Population: 2,240
Population density:
| Wealthy: | 6,018 people per square mile |
| Grand Rapids: | 4,411 people per square mile |

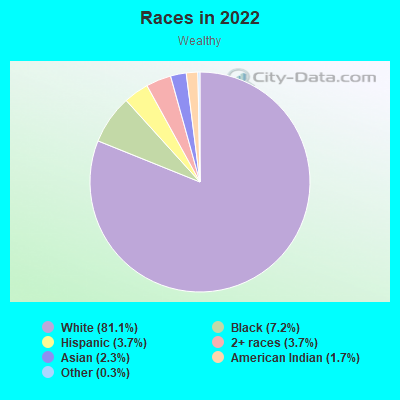
- 1,88881.1%White
- 1677.2%Black
- 853.7%Two or more races
- 863.7%Hispanic or Latino
- 542.3%Asian
- 401.7%American Indian
- 70.3%Some other race
Distribution of median household income
![Distribution of median household income]()
- 69Less than $10,000
- 318$10,000 to $19,999
- 87$20,000 to $29,999
- 129$30,000 to $39,999
- 144$40,000 to $49,999
- 76$50,000 to $59,999
- 151$60,000 to $74,999
- 118$75,000 to $99,999
- 98$100,000 to $124,999
- 115$125,000 to $149,999
- 349$150,000 to $199,999
- 61$200,000 or more

Distribution of owner-occupied house/condo value
![Distribution of owner-occupied house/condo value]()
- 62Less than $50,000
- 84$50,000 to $99,999
- 255$100,000 to $149,999
- 133$150,000 to $199,999
- 73$200,000 to $249,999
- 64$250,000 to $299,999
- 288$300,000 to $399,999
- 35$400,000 to $499,999
- 21$500,000 to $749,999
- 12$750,000 to $999,999

Distribution of rent paid by renters
![Distribution of rent paid by renters]()
- 44Less than $100
- 273$100 to $199
- 208$200 to $299
- 247$300 to $399
- 29$400 to $499
- 139$500 to $599
- 150$600 to $699
- 80$700 to $799
- 73$800 to $899
- 112$900 to $999
- 184$1,000 to $1,249
- 96$1,250 to $1,499
- 110$1,500 to $1,999
- 131$2,000 or more

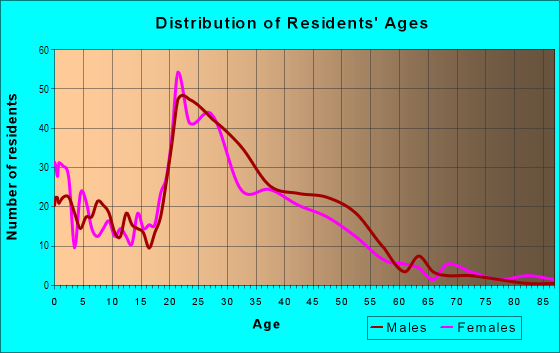
| Males: | 1,080 |
| Females: | 1,160 |
Males:
| This neighborhood: | 31.8 years |
| Whole city: | 33.0 years |
| This neighborhood: | 32.8 years |
| Whole city: | 33.3 years |
Average household size:
| Wealthy: | 5.9 people |
| Grand Rapids: | 2.2 people |
Percentage of family households:
| Wealthy: | 36.3% |
| Grand Rapids: | 36.8% |
| Here: | 26.2% |
| Grand Rapids: | 31.2% |
Percentage of married-couple families with children (among all households):
| Wealthy: | 20.7% |
| Grand Rapids: | 25.1% |
Percentage of single-mother households (among all households):
| Wealthy: | 30.9% |
| Grand Rapids: | 14.6% |
Percentage of never married males 15 years old and over:
Percentage of never married females 15 years old and over:
| Wealthy: | 23.6% |
| Grand Rapids: | 23.6% |
Percentage of never married females 15 years old and over:
| Wealthy: | 30.1% |
| city: | 23.9% |
Percentage of people that speak English not well or not at all:
| Wealthy: | 0.0% |
| Grand Rapids: | 4.2% |
Percentage of people born in this state:
Percentage of people born in another U.S. state:
Percentage of native residents but born outside the U.S.:
Percentage of foreign born residents:
| Here: | 72.6% |
| Grand Rapids: | 70.1% |
Percentage of people born in another U.S. state:
| Wealthy: | 21.6% |
| Grand Rapids: | 18.1% |
Percentage of native residents but born outside the U.S.:
| Here: | 0.6% |
| city: | 1.0% |
Percentage of foreign born residents:
| Here: | 5.2% |
| Grand Rapids: | 10.8% |
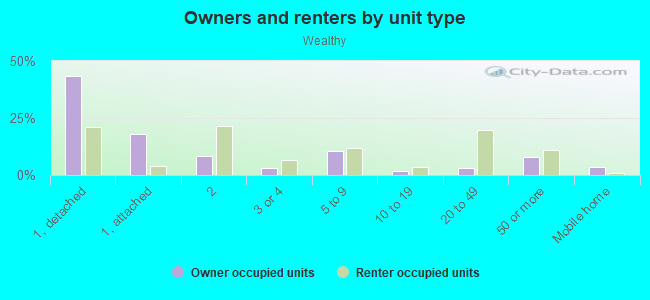
Owner-occupied
Renter-occupied

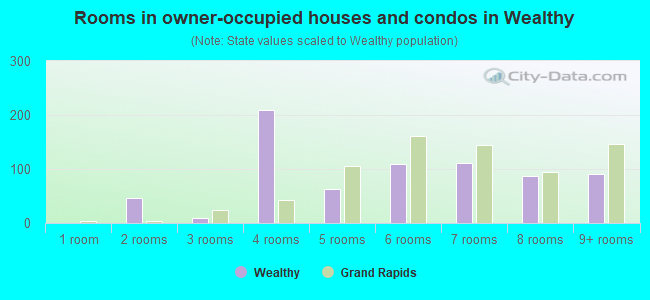
- Rooms in owner-occupied houses and condos in Wealthy
- 01 room
- 472 rooms
- 93 rooms
- 2094 rooms
- 635 rooms
- 1106 rooms
- 1117 rooms
- 878 rooms
- 909+ rooms
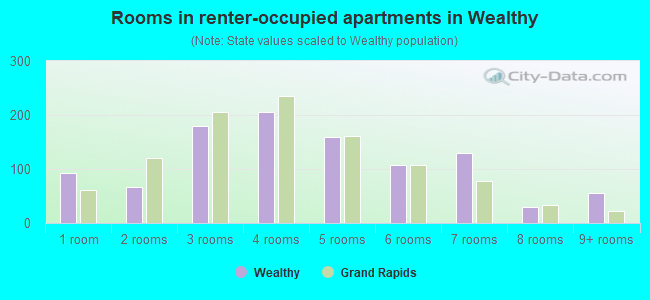
- Rooms in renter-occupied apartments in Wealthy
- 921 room
- 662 rooms
- 1793 rooms
- 2054 rooms
- 1605 rooms
- 1086 rooms
- 1297 rooms
- 308 rooms
- 569+ rooms
Owner-occupied
Renter-occupied
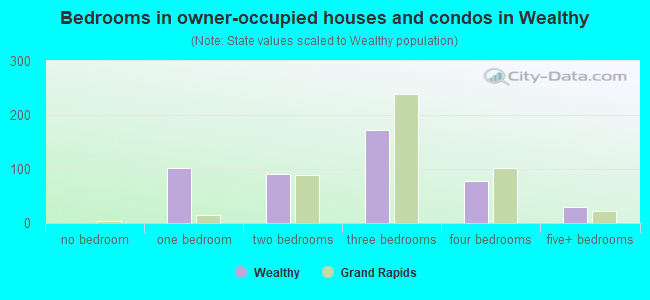
- Bedrooms in owner-occupied houses and condos in Wealthy
- 0no bedroom
- 1011 bedroom
- 902 bedrooms
- 1723 bedrooms
- 774 bedrooms
- 305+ bedrooms
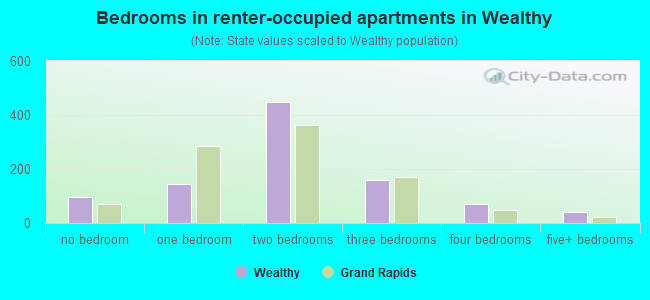
- Bedrooms in renter-occupied apartments in Wealthy
- 98no bedroom
- 1431 bedroom
- 4492 bedrooms
- 1583 bedrooms
- 694 bedrooms
- 425+ bedrooms
Average number of cars or other vehicles available in houses/condos:
Average number of cars or other vehicles available in apartments:
| This neighborhood: | |
| Grand Rapids: |
Average number of cars or other vehicles available in apartments:
| Here: | 1.2 |
| city: | 1.3 |
Percentage of units with a mortgage:
| Wealthy: | 79.2% |
| Grand Rapids: | 67.2% |
Average estimated value of detached houses in 2022 (40.6% of all units):
| Wealthy: | $250,110 |
| Grand Rapids: | $216,026 |
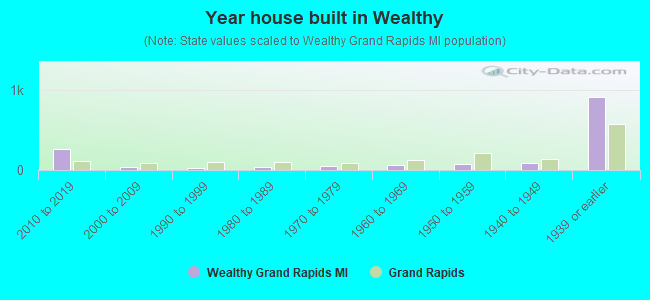
- Year house built in Wealthy
- 02020 or later
- 2622010 to 2019
- 432000 to 2009
- 281990 to 1999
- 401980 to 1989
- 451970 to 1979
- 671960 to 1969
- 711950 to 1959
- 811940 to 1949
- 9041939 or earlier
City-data.com crime index for city in 2020 (higher means more crime):
| City: | 309.2 |
| U.S. average: | 219.5 |
Travel time to work (commute)
![Travel time to work (commute)]()
- 12Less than 5 minutes
- 2645 to 9 minutes
- 40110 to 14 minutes
- 27915 to 19 minutes
- 27220 to 24 minutes
- 5425 to 29 minutes
- 10830 to 34 minutes
- 2935 to 39 minutes
- 5840 to 44 minutes
- 6845 to 59 minutes
- 1560 to 89 minutes
- 990 or more minutes

Means of transportation to work
![Means of transportation to work]()
- 71.3%1,152Drove a car alone
- 2.7%43Carpooled
- 3.9%63Bus
- 0.6%10Taxi
- 4.7%76Bicycle
- 6.2%100Walked
- 0.5%8Other means
- 15.3%247Worked at home

Time leaving home to go to work
![Time leaving home to go to work]()
- 1912:00 a.m. to 4:59 a.m.
- 155:00 a.m. to 5:29 a.m.
- 415:30 a.m. to 5:59 a.m.
- 526:00 a.m. to 6:29 a.m.
- 1156:30 a.m. to 6:59 a.m.
- 1617:00 a.m. to 7:29 a.m.
- 3347:30 a.m. to 7:59 a.m.
- 2138:00 a.m. to 8:29 a.m.
- 1138:30 a.m. to 8:59 a.m.
- 1489:00 a.m. to 9:59 a.m.
- 7610:00 a.m. to 10:59 a.m.
- 811:00 a.m. to 11:59 a.m.
- 11912:00 p.m. to 3:59 p.m.
- 1374:00 p.m. to 11:59 p.m.

Occupations of males:
- Percentage of males in management occupations (except farmers):
Here: 11.1% city: 10.3%
- Percentage of males in business and financial operations occupations:
Here: 12.9% city: 5.8%
- Percentage of males in computer and mathematical occupations:
Here: 5.3% city: 5.4%
- Percentage of males in community and social services occupations:
Here: 3.5% city: 1.7%
- Percentage of males in legal occupations:
Here: 6.5% city: 0.9%
- Percentage of males in education, training, and library occupations:
Here: 6.5% city: 3.9%
- Percentage of males in arts, design, entertainment, sports, and media occupations:
Here: 11.5% city: 2.9%
- Percentage of males in healthcare practitioners and technical occupations:
Here: 4.6% city: 3.1%
- Percentage of males in service occupations:
Here: 14.1% city: 14.6%
- Percentage of males in sales and office occupations:
Here: 12.5% city: 14.1%
- Percentage of males in production occupations:
Here: 3.3% city: 11.0%
- Percentage of males in transportation occupations:
Here: 1.1% city: 4.2%
- Percentage of males in material moving occupations:
Here: 5.7% city: 7.3%
Occupations of females:
- Percentage of females in management occupations (except farmers):
Here: 14.3% city: 7.9%
- Percentage of females in business and financial operations occupations:
Here: 4.1% city: 6.3%
- Percentage of females in computer and mathematical occupations:
Here: 2.8% city: 1.3%
- Percentage of females in life, physical, and social science occupations:
Here: 3.0% city: 1.0%
- Percentage of females in community and social services occupations:
Here: 6.0% city: 2.8%
- Percentage of females in education, training, and library occupations:
Here: 5.4% city: 7.2%
- Percentage of females in arts, design, entertainment, sports, and media occupations:
Here: 5.4% city: 2.7%
- Percentage of females in healthcare practitioners and technical occupations:
Here: 21.4% city: 10.8%
- Percentage of females in service occupations:
Here: 10.9% city: 21.1%
- Percentage of females in sales and office occupations:
Here: 21.9% city: 24.9%
- Percentage of females in farming, fishing, and forestry occupations:
Here: 1.3% city: 0.5%
- Percentage of females in production occupations:
Here: 1.7% city: 6.8%
- Percentage of females in material moving occupations:
Here: 1.8% city: 2.7%
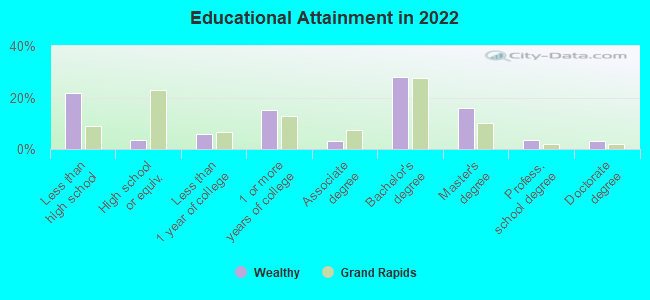
Education in this neighborhood (subdivision or community):
- Percentage of people 3 years and older in K-12 schools:
Wealthy: 10.9% Grand Rapids: 13.5%
- Percentage of people 3 years and older in undergraduate colleges:
Wealthy: 12.9% Grand Rapids: 6.0%
- Percentage of people 3 years and older in grad. or professional schools:
Wealthy: 4.6% Grand Rapids: 2.1%
- Percentage of students K-12 enrolled in private schools:
Wealthy: 100.9% Grand Rapids: 26.5%
Percentage of population below poverty level:
| Wealthy: | 16.5% |
| Grand Rapids: | 15.8% |
Median year renter moved in (as recorded in 2022):
| Wealthy: | 2018 |
| Grand Rapids: | 2020 |
Percentage of married-couple families with both working:
| Wealthy: | 199.6% |
| Grand Rapids: | 70.8% |
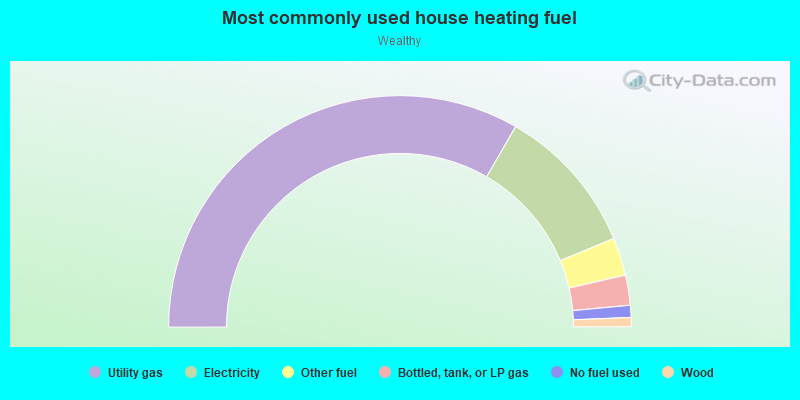
- 66.8%Utility gas
- 20.9%Electricity
- 5.3%Other fuel
- 4.2%Bottled, tank, or LP gas
- 1.7%No fuel used
- 1.3%Wood
Roads and streets:
Fairmount St SE
Length: 0.52 miles
Direction: E-W
Address range: 800 to 10521
Direction: E-W
Address range: 800 to 10521
Wealthy St SE
Length: 0.30 miles
Direction: E-W
Address range: 1 to 1130
Direction: E-W
Address range: 1 to 1130
Diamond Ave SE
Length: 0.27 miles
Direction: N-S
Address range: 200 to 399
Direction: N-S
Address range: 200 to 399
Goodrich St SE
Length: 0.25 miles
Direction: E-W
Address range: 1 to 199
Direction: E-W
Address range: 1 to 199
Calkins Ave SE
Length: 0.24 miles
Direction: N-S
Address range: 200 to 399
Direction: N-S
Address range: 200 to 399
Maple St SE
Length: 0.24 miles
Directions: E-W, SE-NW
Address range: 100 to 199
Directions: E-W, SE-NW
Address range: 100 to 199
Lake Dr SE
Length: 0.21 miles
Direction: E-W
Address range: 1035 to 1198
Direction: E-W
Address range: 1035 to 1198
Division Ave S (S Division Ave)
Length: 0.19 miles
Direction: N-S
Address range: 237 to 399
Direction: N-S
Address range: 237 to 399
Prospect Ave SE
Length: 0.17 miles
Direction: N-S
Address range: 200 to 335
Direction: N-S
Address range: 200 to 335
Virginia St SE
Length: 0.17 miles
Direction: E-W
Address range: 900 to 999
Direction: E-W
Address range: 900 to 999
Evans St SE
Length: 0.17 miles
Direction: E-W
Address range: 600 to 699
Direction: E-W
Address range: 600 to 699
Sheldon Blvd SE
Length: 0.16 miles
Direction: N-S
Address range: 300 to 399
Direction: N-S
Address range: 300 to 399
Jefferson Ave SE
Length: 0.16 miles
Direction: N-S
Address range: 240 to 399
Direction: N-S
Address range: 240 to 399
Lagrave Ave SE
Length: 0.16 miles
Direction: N-S
Address range: 247 to 399
Direction: N-S
Address range: 247 to 399
Cherry St SE
Length: 0.16 miles
Direction: E-W
Address range: 426 to 1099
Direction: E-W
Address range: 426 to 1099
Warren Ave SE
Length: 0.14 miles
Direction: N-S
Address range: 200 to 299
Direction: N-S
Address range: 200 to 299
Wellington Ave SE
Length: 0.12 miles
Directions: E-W, N-S, SE-NW
Address range: 200 to 299
Directions: E-W, N-S, SE-NW
Address range: 200 to 299
Donald Pl SE
Length: 0.12 miles
Direction: N-S
Address range: 300 to 399
Direction: N-S
Address range: 300 to 399
Robey Pl SE
Length: 0.12 miles
Direction: N-S
Address range: 300 to 399
Direction: N-S
Address range: 300 to 399
Freyling Pl SE
Length: 0.11 miles
Direction: N-S
Address range: 300 to 399
Direction: N-S
Address range: 300 to 399
Chester St SE
Length: 0.11 miles
Direction: E-W
Address range: 1000 to 1099
Direction: E-W
Address range: 1000 to 1099
Orchard Hill St SE (Orchard Hill Ave SE)
Length: 0.11 miles
Direction: N-S
Address range: 200 to 399
Direction: N-S
Address range: 200 to 399
Carroll Ave SE
Length: 0.11 miles
Direction: N-S
Address range: 200 to 299
Direction: N-S
Address range: 200 to 299
Irving St SE
Length: 0.10 miles
Direction: E-W
Direction: E-W
Henry Ave SE
Length: 0.09 miles
Direction: N-S
Address range: 300 to 351
Direction: N-S
Address range: 300 to 351
James Ave SE
Length: 0.09 miles
Direction: N-S
Address range: 300 to 345
Direction: N-S
Address range: 300 to 345
Donovan Ct SE
Length: 0.08 miles
Direction: E-W
Address range: 600 to 699
Direction: E-W
Address range: 600 to 699
Lafayette Ave SE
Length: 0.08 miles
Direction: N-S
Address range: 338 to 399
Direction: N-S
Address range: 338 to 399
Eastern Ave SE
Length: 0.08 miles
Direction: N-S
Address range: 232 to 299
Direction: N-S
Address range: 232 to 299
Visser Pl SE
Length: 0.08 miles
Direction: N-S
Address range: 300 to 399
Direction: N-S
Address range: 300 to 399
Cass Ave SE
Length: 0.07 miles
Directions: N-S, SW-NE
Directions: N-S, SW-NE
Eureka Ave SE
Length: 0.07 miles
Direction: N-S
Address range: 300 to 331
Direction: N-S
Address range: 300 to 331