West Glendale neighborhood in Glendale, California (CA), 91203 detailed profile
Settings
X


Business Search - 14 Million verified businesses
Area: 0.453 square miles
Population: 10,547
Population density:
| West Glendale: | 23,284 people per square mile |
| Glendale: | 6,175 people per square mile |

- 6,05655.7%White
- 2,58123.7%Hispanic or Latino
- 1,41613.0%Asian
- 3793.5%Black
- 2862.6%American Indian
- 1161.1%Two or more races
- 440.4%Some other race

Median household income in 2022:
| West Glendale: | $71,189 |
| Glendale: | $77,483 |
Distribution of median household income
![Distribution of median household income]()
- 355Less than $10,000
- 162$10,000 to $19,999
- 386$20,000 to $29,999
- 602$30,000 to $39,999
- 465$40,000 to $49,999
- 297$50,000 to $59,999
- 307$60,000 to $74,999
- 442$75,000 to $99,999
- 269$100,000 to $124,999
- 345$125,000 to $149,999
- 316$150,000 to $199,999
- 343$200,000 or more

Distribution of owner-occupied house/condo value
![Distribution of owner-occupied house/condo value]()
- 67Less than $50,000
- 31$50,000 to $99,999
- 81$250,000 to $299,999
- 36$300,000 to $399,999
- 344$500,000 to $749,999
- 317$750,000 to $999,999
- 333$1,000,000 or more

Distribution of rent paid by renters
![Distribution of rent paid by renters]()
- 18$200 to $299
- 64$400 to $499
- 32$800 to $899
- 349$900 to $999
- 376$1,000 to $1,249
- 439$1,250 to $1,499
- 782$1,500 to $1,999
- 1,046$2,000 or more

Median rent in 2022:
| West Glendale: | $1,687 |
| Glendale: | $1,842 |
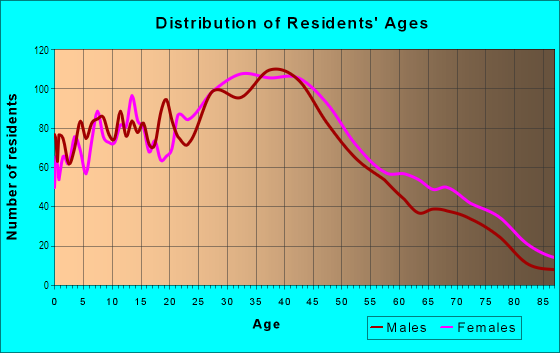
| Males: | 5,361 |
| Females: | 5,185 |
Males:
| This neighborhood: | 39.7 years |
| Whole city: | 41.8 years |
| This neighborhood: | 41.0 years |
| Whole city: | 43.4 years |
Average household size:
| West Glendale: | 11.2 people |
| Glendale: | 2.5 people |
Percentage of family households:
| West Glendale: | 46.9% |
| Glendale: | 40.0% |
| Here: | 43.9% |
| Glendale: | 44.2% |
Percentage of married-couple families with children (among all households):
| West Glendale: | 28.2% |
| Glendale: | 30.5% |
Percentage of single-mother households (among all households):
| West Glendale: | 1.6% |
| Glendale: | 7.0% |
Percentage of never married males 15 years old and over:
Percentage of never married females 15 years old and over:
| West Glendale: | 27.0% |
| Glendale: | 18.4% |
Percentage of never married females 15 years old and over:
| West Glendale: | 18.2% |
| city: | 18.3% |
Percentage of people that speak English not well or not at all:
| West Glendale: | 15.9% |
| Glendale: | 12.5% |
Percentage of people born in this state:
Percentage of people born in another U.S. state:
Percentage of native residents but born outside the U.S.:
Percentage of foreign born residents:
| Here: | 28.8% |
| Glendale: | 38.0% |
Percentage of people born in another U.S. state:
| West Glendale: | 8.6% |
| Glendale: | 11.6% |
Percentage of native residents but born outside the U.S.:
| Here: | 1.9% |
| city: | 1.5% |
Percentage of foreign born residents:
| Here: | 60.8% |
| Glendale: | 48.9% |

Owner-occupied
Renter-occupied


- Rooms in owner-occupied houses and condos in West Glendale
- 01 room
- 292 rooms
- 423 rooms
- 874 rooms
- 965 rooms
- 1556 rooms
- 3387 rooms
- 3278 rooms
- 1149+ rooms

- Rooms in renter-occupied apartments in West Glendale
- 2641 room
- 1742 rooms
- 4213 rooms
- 5564 rooms
- 8875 rooms
- 3536 rooms
- 1837 rooms
- 768 rooms
- 699+ rooms
Owner-occupied
Renter-occupied

- Bedrooms in owner-occupied houses and condos in West Glendale
- 0no bedroom
- 291 bedroom
- 1122 bedrooms
- 6413 bedrooms
- 1144 bedrooms
- 145+ bedrooms

- Bedrooms in renter-occupied apartments in West Glendale
- 283no bedroom
- 7051 bedroom
- 1,5122 bedrooms
- 4023 bedrooms
- 1054 bedrooms
- 575+ bedrooms
Average number of cars or other vehicles available in houses/condos:
Average number of cars or other vehicles available in apartments:
| This neighborhood: | 2.9 |
| Glendale: | 2.0 |
Average number of cars or other vehicles available in apartments:
| Here: | 1.7 |
| city: | 1.4 |
Percentage of units with a mortgage:
| West Glendale: | 56.0% |
| Glendale: | 73.0% |
Average estimated value of detached houses in 2022 (29.9% of all units):
| West Glendale: | $924,473 |
| Glendale: | $1,271,064 |

- Year house built in West Glendale
- 02020 or later
- 6882010 to 2019
- 612000 to 2009
- 2091990 to 1999
- 6351980 to 1989
- 2361970 to 1979
- 6821960 to 1969
- 5361950 to 1959
- 3271940 to 1949
- 8031939 or earlier

City-data.com crime index for city in 2020 (higher means more crime):
| City: | 110.5 |
| U.S. average: | 219.5 |
Travel time to work (commute)
![Travel time to work (commute)]()
- 2425 to 9 minutes
- 53910 to 14 minutes
- 72715 to 19 minutes
- 49720 to 24 minutes
- 11625 to 29 minutes
- 1,17630 to 34 minutes
- 2335 to 39 minutes
- 55240 to 44 minutes
- 28445 to 59 minutes
- 12460 to 89 minutes
- 3390 or more minutes

Means of transportation to work
![Means of transportation to work]()
- 82.0%3,976Drove a car alone
- 1.9%91Carpooled
- 1.3%63Bus
- 2.9%143Bicycle
- 5.7%276Walked
- 7.1%344Other means
- 12.5%608Worked at home

Time leaving home to go to work
![Time leaving home to go to work]()
- 6912:00 a.m. to 4:59 a.m.
- 1815:00 a.m. to 5:29 a.m.
- 695:30 a.m. to 5:59 a.m.
- 3666:00 a.m. to 6:29 a.m.
- 2946:30 a.m. to 6:59 a.m.
- 6597:00 a.m. to 7:29 a.m.
- 3027:30 a.m. to 7:59 a.m.
- 9638:00 a.m. to 8:29 a.m.
- 2878:30 a.m. to 8:59 a.m.
- 3349:00 a.m. to 9:59 a.m.
- 39610:00 a.m. to 10:59 a.m.
- 14812:00 p.m. to 3:59 p.m.
- 2544:00 p.m. to 11:59 p.m.

Occupations of males:
- Percentage of males in management occupations (except farmers):
Here: 6.8% city: 12.9%
- Percentage of males in computer and mathematical occupations:
Here: 2.3% city: 5.2%
- Percentage of males in architecture and engineering occupations:
Here: 3.4% city: 4.1%
- Percentage of males in education, training, and library occupations:
Here: 3.9% city: 2.0%
- Percentage of males in arts, design, entertainment, sports, and media occupations:
Here: 2.1% city: 8.9%
- Percentage of males in healthcare practitioners and technical occupations:
Here: 9.4% city: 5.5%
- Percentage of males in service occupations:
Here: 12.6% city: 11.8%
- Percentage of males in sales and office occupations:
Here: 33.2% city: 18.3%
- Percentage of males in construction, extraction, and maintenance occupations:
Here: 4.7% city: 5.5%
- Percentage of males in transportation occupations:
Here: 10.3% city: 6.0%
Occupations of females:
- Percentage of females in management occupations (except farmers):
Here: 11.6% city: 10.3%
- Percentage of females in business and financial operations occupations:
Here: 3.9% city: 6.1%
- Percentage of females in computer and mathematical occupations:
Here: 2.8% city: 1.6%
- Percentage of females in community and social services occupations:
Here: 5.7% city: 2.8%
- Percentage of females in education, training, and library occupations:
Here: 11.1% city: 9.4%
- Percentage of females in arts, design, entertainment, sports, and media occupations:
Here: 4.4% city: 6.1%
- Percentage of females in healthcare practitioners and technical occupations:
Here: 9.4% city: 10.7%
- Percentage of females in service occupations:
Here: 21.8% city: 18.3%
- Percentage of females in sales and office occupations:
Here: 25.0% city: 26.5%
- Percentage of females in material moving occupations:
Here: 2.1% city: 0.7%
Education in this neighborhood (subdivision or community):
- Percentage of people 3 years and older in K-12 schools:
West Glendale: 17.2% Glendale: 14.1%
- Percentage of people 3 years and older in undergraduate colleges:
West Glendale: 4.3% Glendale: 5.2%
- Percentage of people 3 years and older in grad. or professional schools:
West Glendale: 4.4% Glendale: 1.9%
- Percentage of students K-12 enrolled in private schools:
West Glendale: 39.5% Glendale: 9.3%
Percentage of population below poverty level:
| West Glendale: | 15.4% |
| Glendale: | 13.0% |
Median year owner moved in (as recorded in 2022):
Median year renter moved in (as recorded in 2022):
| West Glendale: | 2001 |
| Glendale: | 2007 |
Median year renter moved in (as recorded in 2022):
| West Glendale: | 2013 |
| Glendale: | 2018 |
Percentage of married-couple families with both working:
| West Glendale: | 81.9% |
| Glendale: | 66.7% |

- 72.1%Utility gas
- 24.3%Electricity
- 2.0%No fuel used
- 1.6%Bottled, tank, or LP gas
Roads and streets:
Salem St
Length: 0.82 miles
Direction: E-W
Address range: 300 to 699
Direction: E-W
Address range: 300 to 699
W California Ave
Length: 0.78 miles
Directions: E-W, SE-NW
Address range: 318 to 699
Directions: E-W, SE-NW
Address range: 318 to 699
Pioneer Dr
Length: 0.78 miles
Directions: E-W, N-S, SW-NE
Address range: 320 to 699
Directions: E-W, N-S, SW-NE
Address range: 320 to 699
W Milford St
Length: 0.78 miles
Direction: E-W
Address range: 320 to 699
Direction: E-W
Address range: 320 to 699
W Lexington Dr
Length: 0.78 miles
Direction: E-W
Address range: 320 to 699
Direction: E-W
Address range: 320 to 699
W Doran St
Length: 0.78 miles
Direction: E-W
Address range: 320 to 699
Direction: E-W
Address range: 320 to 699
Myrtle St
Length: 0.59 miles
Direction: E-W
Address range: 400 to 699
Direction: E-W
Address range: 400 to 699
N Columbus Ave
Length: 0.58 miles
Direction: N-S
Address range: 150 to 699
Direction: N-S
Address range: 150 to 699
W Wilson Ave
Length: 0.56 miles
Direction: E-W
Address range: 300 to 530
Direction: E-W
Address range: 300 to 530
N Pacific Ave
Length: 0.54 miles
Direction: N-S
Address range: 152 to 635
Direction: N-S
Address range: 152 to 635
N Kenilworth Ave
Length: 0.51 miles
Directions: N-S, SE-NW
Address range: 200 to 699
Directions: N-S, SE-NW
Address range: 200 to 699
Chester St
Length: 0.40 miles
Direction: N-S
Address range: 200 to 631
Direction: N-S
Address range: 200 to 631
Alexander St
Length: 0.37 miles
Direction: E-W
Address range: 500 to 699
Direction: E-W
Address range: 500 to 699
Brent Pl
Length: 0.10 miles
Direction: N-S
Address range: 300 to 499
Direction: N-S
Address range: 300 to 499