West Linda Mar neighborhood in Pacifica, California (CA), 94044 detailed profile
Settings
X


Business Search - 14 Million verified businesses
Area: 0.445 square miles
Population: 3,165
Population density:
| West Linda Mar: | 7,114 people per square mile |
| Pacifica: | 3,012 people per square mile |

- 2,04964.1%White
- 56017.5%Hispanic or Latino
- 46114.4%Asian
- 882.8%Two or more races
- 170.5%Black
- 170.5%Some other race
- 30.09%American Indian

Distribution of median household income
![Distribution of median household income]()
- 29Less than $10,000
- 38$10,000 to $19,999
- 7$20,000 to $29,999
- 44$30,000 to $39,999
- 30$40,000 to $49,999
- 141$50,000 to $59,999
- 82$60,000 to $74,999
- 113$75,000 to $99,999
- 142$100,000 to $124,999
- 116$125,000 to $149,999
- 157$150,000 to $199,999
- 351$200,000 or more

Distribution of owner-occupied house/condo value
![Distribution of owner-occupied house/condo value]()
- 98Less than $50,000
- 23$100,000 to $149,999
- 1$200,000 to $249,999
- 40$300,000 to $399,999
- 34$500,000 to $749,999
- 137$750,000 to $999,999
- 699$1,000,000 or more

Distribution of rent paid by renters
![Distribution of rent paid by renters]()
- 58$100 to $199
- 17$600 to $699
- 1$800 to $899
- 6$1,000 to $1,249
- 42$1,500 to $1,999
- 361$2,000 or more

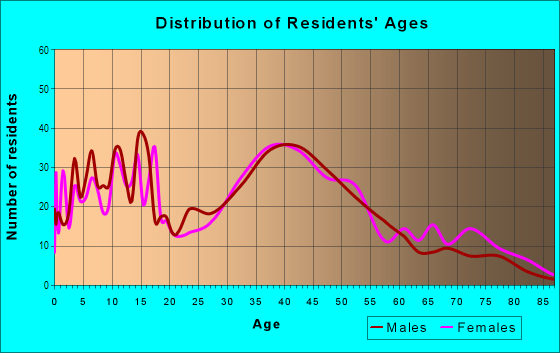
| Males: | 1,642 |
| Females: | 1,523 |
Males:
| This neighborhood: | 44.8 years |
| Whole city: | 42.2 years |
| This neighborhood: | 46.4 years |
| Whole city: | 44.6 years |
Average household size:
| West Linda Mar: | 7.7 people |
| Pacifica: | 2.7 people |
Percentage of family households:
| West Linda Mar: | 56.2% |
| Pacifica: | 45.8% |
| Here: | 65.4% |
| Pacifica: | 55.6% |
Percentage of married-couple families with children (among all households):
| West Linda Mar: | 32.6% |
| Pacifica: | 30.5% |
Percentage of single-mother households (among all households):
| West Linda Mar: | 1.5% |
| Pacifica: | 4.0% |
Percentage of never married males 15 years old and over:
Percentage of never married females 15 years old and over:
| West Linda Mar: | 15.5% |
| Pacifica: | 18.0% |
Percentage of never married females 15 years old and over:
| West Linda Mar: | 11.0% |
| city: | 13.5% |
Percentage of people that speak English not well or not at all:
| West Linda Mar: | 0.3% |
| Pacifica: | 2.3% |
Percentage of people born in this state:
Percentage of people born in another U.S. state:
Percentage of native residents but born outside the U.S.:
Percentage of foreign born residents:
| Here: | 66.5% |
| Pacifica: | 58.3% |
Percentage of people born in another U.S. state:
| West Linda Mar: | 15.3% |
| Pacifica: | 17.9% |
Percentage of native residents but born outside the U.S.:
| Here: | 2.5% |
| city: | 1.9% |
Percentage of foreign born residents:
| Here: | 15.8% |
| Pacifica: | 21.9% |

Owner-occupied
Renter-occupied


- Rooms in owner-occupied houses and condos in West Linda Mar
- 01 room
- 22 rooms
- 283 rooms
- 414 rooms
- 2765 rooms
- 2766 rooms
- 1747 rooms
- 638 rooms
- 439+ rooms

- Rooms in renter-occupied apartments in West Linda Mar
- 01 room
- 112 rooms
- 463 rooms
- 444 rooms
- 1015 rooms
- 1286 rooms
- 487 rooms
- 08 rooms
- 99+ rooms
Owner-occupied
Renter-occupied

- Bedrooms in owner-occupied houses and condos in West Linda Mar
- 0no bedroom
- 291 bedroom
- 252 bedrooms
- 6393 bedrooms
- 2174 bedrooms
- 255+ bedrooms

- Bedrooms in renter-occupied apartments in West Linda Mar
- 0no bedroom
- 501 bedroom
- 82 bedrooms
- 1613 bedrooms
- 494 bedrooms
- 95+ bedrooms
Average number of cars or other vehicles available in houses/condos:
Average number of cars or other vehicles available in apartments:
| This neighborhood: | 2.3 |
| Pacifica: | 2.4 |
Average number of cars or other vehicles available in apartments:
| Here: | 2.6 |
| city: | 1.7 |
Percentage of units with a mortgage:
| West Linda Mar: | 68.9% |
| Pacifica: | 69.8% |
Average estimated value of detached houses in 2022 (97.1% of all units):
| West Linda Mar: | $1,242,611 |
| California: | $988,808 |

- Year house built in West Linda Mar
- 02020 or later
- 602010 to 2019
- 332000 to 2009
- 931990 to 1999
- 591980 to 1989
- 331970 to 1979
- 791960 to 1969
- 8021950 to 1959
- 491940 to 1949
- 1901939 or earlier

City-data.com crime index for city in 2020 (higher means more crime):
| City: | 150.9 |
| U.S. average: | 219.5 |
Travel time to work (commute)
![Travel time to work (commute)]()
- 33Less than 5 minutes
- 875 to 9 minutes
- 8610 to 14 minutes
- 9415 to 19 minutes
- 17920 to 24 minutes
- 11925 to 29 minutes
- 20530 to 34 minutes
- 7735 to 39 minutes
- 9640 to 44 minutes
- 14545 to 59 minutes
- 8960 to 89 minutes
- 2190 or more minutes

Means of transportation to work
![Means of transportation to work]()
- 70.6%1,056Drove a car alone
- 10.4%155Carpooled
- 0.3%5Bus
- 2.7%40Subway or elevated rail
- 0.2%3Motorcycle
- 1.9%28Bicycle
- 16.6%248Worked at home

Time leaving home to go to work
![Time leaving home to go to work]()
- 7612:00 a.m. to 4:59 a.m.
- 255:00 a.m. to 5:29 a.m.
- 1065:30 a.m. to 5:59 a.m.
- 956:00 a.m. to 6:29 a.m.
- 1036:30 a.m. to 6:59 a.m.
- 2977:00 a.m. to 7:29 a.m.
- 1507:30 a.m. to 7:59 a.m.
- 688:00 a.m. to 8:29 a.m.
- 678:30 a.m. to 8:59 a.m.
- 919:00 a.m. to 9:59 a.m.
- 4110:00 a.m. to 10:59 a.m.
- 2011:00 a.m. to 11:59 a.m.
- 3712:00 p.m. to 3:59 p.m.
- 1854:00 p.m. to 11:59 p.m.

Occupations of males:
- Percentage of males in management occupations (except farmers):
Here: 24.1% city: 14.5%
- Percentage of males in business and financial operations occupations:
Here: 5.1% city: 5.0%
- Percentage of males in computer and mathematical occupations:
Here: 3.9% city: 8.8%
- Percentage of males in architecture and engineering occupations:
Here: 2.9% city: 4.6%
- Percentage of males in legal occupations:
Here: 3.9% city: 1.2%
- Percentage of males in healthcare practitioners and technical occupations:
Here: 8.3% city: 3.5%
- Percentage of males in service occupations:
Here: 6.3% city: 12.5%
- Percentage of males in sales and office occupations:
Here: 13.7% city: 14.8%
- Percentage of males in construction, extraction, and maintenance occupations:
Here: 18.5% city: 7.7%
- Percentage of males in production occupations:
Here: 3.7% city: 4.4%
- Percentage of males in transportation occupations:
Here: 4.3% city: 8.0%
Occupations of females:
- Percentage of females in management occupations (except farmers):
Here: 3.6% city: 13.8%
- Percentage of females in business and financial operations occupations:
Here: 5.5% city: 7.1%
- Percentage of females in life, physical, and social science occupations:
Here: 6.5% city: 3.8%
- Percentage of females in community and social services occupations:
Here: 9.2% city: 3.2%
- Percentage of females in legal occupations:
Here: 3.6% city: 2.2%
- Percentage of females in education, training, and library occupations:
Here: 11.4% city: 10.7%
- Percentage of females in arts, design, entertainment, sports, and media occupations:
Here: 3.4% city: 4.6%
- Percentage of females in healthcare practitioners and technical occupations:
Here: 9.3% city: 10.8%
- Percentage of females in service occupations:
Here: 17.7% city: 15.1%
- Percentage of females in sales and office occupations:
Here: 27.6% city: 21.8%
Education in this neighborhood (subdivision or community):
- Percentage of people 3 years and older in K-12 schools:
West Linda Mar: 30.9% Pacifica: 14.7%
- Percentage of people 3 years and older in undergraduate colleges:
West Linda Mar: 11.7% Pacifica: 5.6%
- Percentage of people 3 years and older in grad. or professional schools:
West Linda Mar: 0.9% Pacifica: 1.1%
- Percentage of students K-12 enrolled in private schools:
West Linda Mar: 29.2% Pacifica: 16.2%
Percentage of population below poverty level:
| West Linda Mar: | 6.1% |
| Pacifica: | 5.6% |
Median year owner moved in (as recorded in 2022):
| West Linda Mar: | 2004 |
| Pacifica: | 2002 |
Percentage of married-couple families with both working:
| West Linda Mar: | 103.2% |
| Pacifica: | 76.9% |

- 75.8%Utility gas
- 12.8%Electricity
- 8.3%No fuel used
- 1.7%Bottled, tank, or LP gas
- 1.4%Solar energy
Highways in this neighborhood:
Cabrillo Hwy (Coast Hwy, State Hwy 1)
Length: 0.65 miles
Directions: N-S, SE-NW, SW-NE
Address range: 4900 to 5599
Directions: N-S, SE-NW, SW-NE
Address range: 4900 to 5599
Roads and streets:
Linda Mar Blvd
Length: 0.89 miles
Directions: E-W, N-S, SE-NW
Address range: 400 to 998
Directions: E-W, N-S, SE-NW
Address range: 400 to 998
Crespi Dr
Length: 0.88 miles
Directions: E-W, N-S, SE-NW, SW-NE
Address range: 500 to 916
Directions: E-W, N-S, SE-NW, SW-NE
Address range: 500 to 916
Arguello Blvd
Length: 0.78 miles
Directions: E-W, N-S, SE-NW, SW-NE
Address range: 500 to 899
Directions: E-W, N-S, SE-NW, SW-NE
Address range: 500 to 899
de Solo Dr
Length: 0.68 miles
Directions: E-W, N-S, SE-NW, SW-NE
Address range: 1100 to 1499
Directions: E-W, N-S, SE-NW, SW-NE
Address range: 1100 to 1499
State Hwy 1
Length: 0.64 miles
Directions: N-S, SE-NW, SW-NE
Directions: N-S, SE-NW, SW-NE
Adobe Dr
Length: 0.61 miles
Directions: E-W, N-S, SW-NE
Address range: 1300 to 1799
Directions: E-W, N-S, SW-NE
Address range: 1300 to 1799
San Pedro Terrace Rd
Length: 0.61 miles
Directions: E-W, N-S, SE-NW, SW-NE
Address range: 500 to 799
Directions: E-W, N-S, SE-NW, SW-NE
Address range: 500 to 799
Montezuma Dr
Length: 0.59 miles
Directions: E-W, SE-NW
Address range: 600 to 899
Directions: E-W, SE-NW
Address range: 600 to 899
Peralta Rd
Length: 0.44 miles
Direction: SW-NE
Address range: 100 to 1399
Direction: SW-NE
Address range: 100 to 1399
Escalero Ave
Length: 0.43 miles
Directions: E-W, N-S, SE-NW, SW-NE
Address range: 1100 to 1299
Directions: E-W, N-S, SE-NW, SW-NE
Address range: 1100 to 1299
Seville Dr
Length: 0.42 miles
Directions: E-W, N-S, SW-NE
Address range: 1100 to 1299
Directions: E-W, N-S, SW-NE
Address range: 1100 to 1299
Flores Dr
Length: 0.40 miles
Directions: E-W, N-S, SE-NW, SW-NE
Address range: 1300 to 1599
Directions: E-W, N-S, SE-NW, SW-NE
Address range: 1300 to 1599
Anza Dr
Length: 0.35 miles
Directions: E-W, N-S, SE-NW, SW-NE
Address range: 900 to 1199
Directions: E-W, N-S, SE-NW, SW-NE
Address range: 900 to 1199
Hermosa Ave
Length: 0.30 miles
Directions: E-W, N-S, SE-NW, SW-NE
Address range: 1200 to 1399
Directions: E-W, N-S, SE-NW, SW-NE
Address range: 1200 to 1399
Marvilla Cir
Length: 0.28 miles
Directions: E-W, N-S, SE-NW, SW-NE
Address range: 200 to 299
Directions: E-W, N-S, SE-NW, SW-NE
Address range: 200 to 299
Fernandez Way
Length: 0.24 miles
Directions: N-S, SW-NE
Address range: 1100 to 1199
Directions: N-S, SW-NE
Address range: 1100 to 1199
Standish Rd
Length: 0.24 miles
Directions: N-S, SE-NW, SW-NE
Address range: 800 to 899
Directions: N-S, SE-NW, SW-NE
Address range: 800 to 899
Bower Rd
Length: 0.20 miles
Direction: SE-NW
Address range: 800 to 999
Direction: SE-NW
Address range: 800 to 999
Dell Rd
Length: 0.19 miles
Directions: E-W, SE-NW, SW-NE
Address range: 800 to 899
Directions: E-W, SE-NW, SW-NE
Address range: 800 to 899
Noriega Way
Length: 0.17 miles
Direction: SE-NW
Address range: 700 to 799
Direction: SE-NW
Address range: 700 to 799
Cervantes Way
Length: 0.16 miles
Direction: SW-NE
Address range: 1100 to 1199
Direction: SW-NE
Address range: 1100 to 1199
Encanto Way
Length: 0.16 miles
Directions: E-W, SW-NE
Address range: 1100 to 1199
Directions: E-W, SW-NE
Address range: 1100 to 1199
Rosita Rd
Length: 0.16 miles
Directions: E-W, SE-NW
Address range: 800 to 964
Directions: E-W, SE-NW
Address range: 800 to 964
Balboa Way
Length: 0.14 miles
Direction: SW-NE
Address range: 1100 to 1199
Direction: SW-NE
Address range: 1100 to 1199
Vista Montara Cir
Length: 0.13 miles
Directions: E-W, N-S, SE-NW, SW-NE
Address range: 827 to 899
Directions: E-W, N-S, SE-NW, SW-NE
Address range: 827 to 899
Navarre Dr
Length: 0.11 miles
Direction: SE-NW
Address range: 600 to 699
Direction: SE-NW
Address range: 600 to 699
Higgins Way
Length: 0.09 miles
Direction: SE-NW
Address range: 1500 to 1599
Direction: SE-NW
Address range: 1500 to 1599
Cadiz St (Cadiz Ct)
Length: 0.08 miles
Directions: N-S, SW-NE
Address range: 1 to 99
Directions: N-S, SW-NE
Address range: 1 to 99
Silvia Ct
Length: 0.07 miles
Direction: SW-NE
Address range: 800 to 899
Direction: SW-NE
Address range: 800 to 899
Marvilla Pl
Length: 0.05 miles
Direction: SW-NE
Direction: SW-NE
Chico Ct
Length: 0.03 miles
Directions: N-S, SW-NE
Address range: 1 to 99
Directions: N-S, SW-NE
Address range: 1 to 99
Lisa Ct
Length: 0.03 miles
Direction: SW-NE
Address range: 800 to 899
Direction: SW-NE
Address range: 800 to 899
Standish Ct
Length: 0.03 miles
Direction: SW-NE
Address range: 877 to 899
Direction: SW-NE
Address range: 877 to 899
Other features:
San Pedro Crk
Length: 0.89 miles
Directions: E-W, N-S, SE-NW
Directions: E-W, N-S, SE-NW