West Main neighborhood in Peoria, Illinois (IL), 61606 detailed profile
Settings
X


Business Search - 14 Million verified businesses
Area: 0.104 square miles
Population: 578
Population density:
| West Main: | 5,549 people per square mile |
| Peoria: | 2,460 people per square mile |

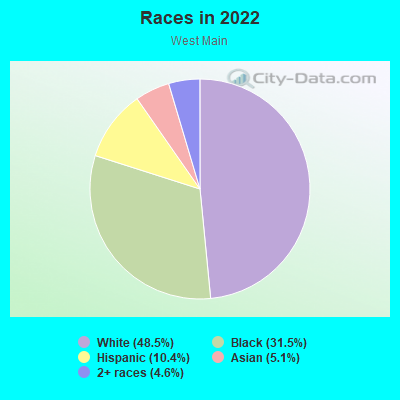
- 28548.5%White
- 18531.5%Black
- 6110.4%Hispanic or Latino
- 305.1%Asian
- 274.6%Two or more races
Distribution of median household income
![Distribution of median household income]()
- 61Less than $10,000
- 75$10,000 to $19,999
- 29$20,000 to $29,999
- 41$30,000 to $39,999
- 16$40,000 to $49,999
- 26$50,000 to $59,999
- 31$60,000 to $74,999
- 19$75,000 to $99,999
- 10$100,000 to $124,999
- 26$125,000 to $149,999
- 6$150,000 to $199,999
- 9$200,000 or more

Distribution of owner-occupied house/condo value
![Distribution of owner-occupied house/condo value]()
- 51Less than $50,000
- 77$50,000 to $99,999
- 18$100,000 to $149,999
- 27$150,000 to $199,999
- 19$200,000 to $249,999
- 6$250,000 to $299,999
- 7$300,000 to $399,999
- 7$400,000 to $499,999

Distribution of rent paid by renters
![Distribution of rent paid by renters]()
- 7$100 to $199
- 10$200 to $299
- 10$300 to $399
- 21$400 to $499
- 33$500 to $599
- 72$600 to $699
- 35$700 to $799
- 39$800 to $899
- 15$900 to $999
- 7$1,000 to $1,249
- 5$1,250 to $1,499
- 25$1,500 to $1,999

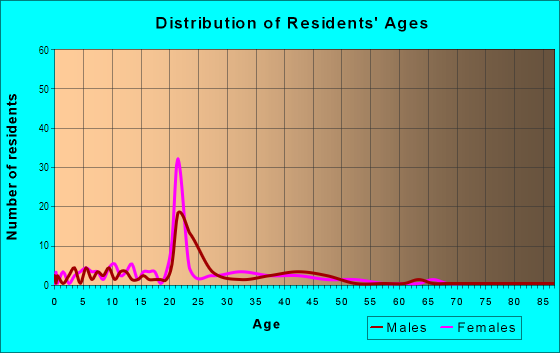
| Males: | 313 |
| Females: | 265 |
Males:
| This neighborhood: | 26.3 years |
| Whole city: | 33.8 years |
| This neighborhood: | 31.5 years |
| Whole city: | 36.0 years |
Average household size:
| West Main: | 2.2 people |
| Peoria: | 2.2 people |
Percentage of family households:
| West Main: | 36.1% |
| Peoria: | 41.0% |
| Here: | 22.1% |
| Peoria: | 33.8% |
Percentage of married-couple families with children (among all households):
| West Main: | 21.5% |
| Peoria: | 22.1% |
Percentage of single-mother households (among all households):
| West Main: | 23.4% |
| Peoria: | 16.8% |
Percentage of never married males 15 years old and over:
Percentage of never married females 15 years old and over:
| West Main: | 35.8% |
| Peoria: | 19.6% |
Percentage of never married females 15 years old and over:
| West Main: | 26.9% |
| city: | 19.0% |
Percentage of people that speak English not well or not at all:
| West Main: | 2.9% |
| Peoria: | 1.6% |
Percentage of people born in this state:
Percentage of people born in another U.S. state:
Percentage of native residents but born outside the U.S.:
Percentage of foreign born residents:
| Here: | 67.3% |
| Peoria: | 72.0% |
Percentage of people born in another U.S. state:
| West Main: | 23.9% |
| Peoria: | 18.8% |
Percentage of native residents but born outside the U.S.:
| Here: | 1.3% |
| city: | 1.4% |
Percentage of foreign born residents:
| Here: | 7.6% |
| Peoria: | 7.8% |
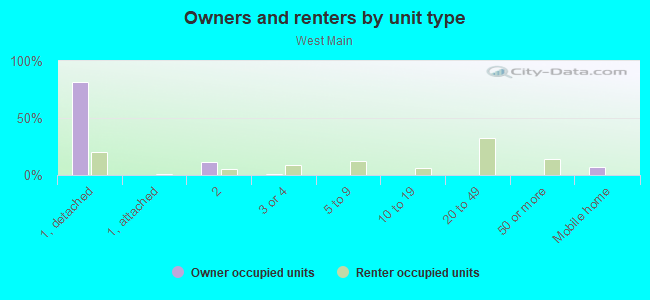
Owner-occupied
Renter-occupied

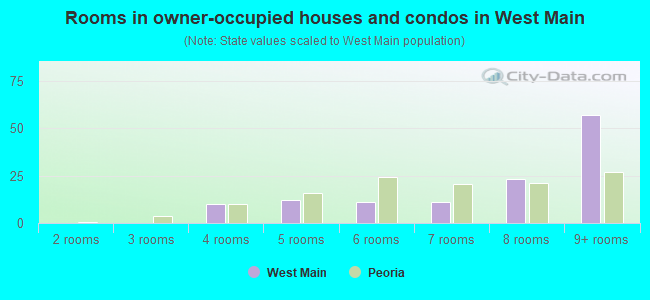
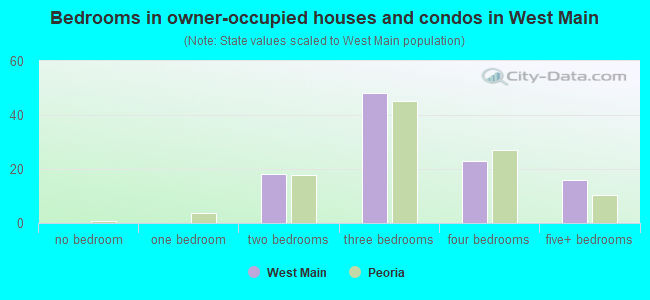
- Rooms in owner-occupied houses and condos in West Main
- 01 room
- 02 rooms
- 03 rooms
- 104 rooms
- 125 rooms
- 116 rooms
- 117 rooms
- 238 rooms
- 579+ rooms
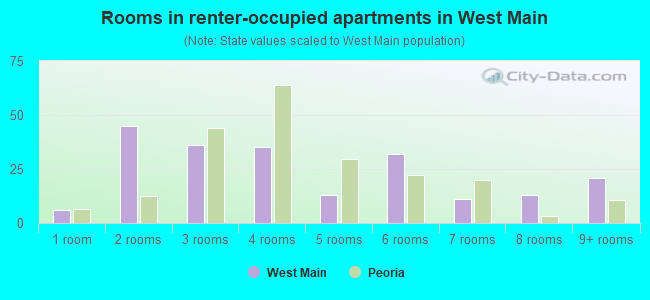
- Rooms in renter-occupied apartments in West Main
- 61 room
- 452 rooms
- 363 rooms
- 354 rooms
- 135 rooms
- 326 rooms
- 117 rooms
- 138 rooms
- 219+ rooms
Owner-occupied
Renter-occupied
- Bedrooms in owner-occupied houses and condos in West Main
- 0no bedroom
- 01 bedroom
- 182 bedrooms
- 483 bedrooms
- 234 bedrooms
- 165+ bedrooms
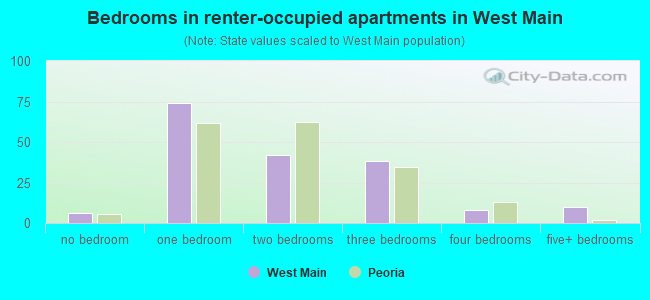
- Bedrooms in renter-occupied apartments in West Main
- 6no bedroom
- 741 bedroom
- 422 bedrooms
- 383 bedrooms
- 84 bedrooms
- 105+ bedrooms
Average number of cars or other vehicles available in houses/condos:
Average number of cars or other vehicles available in apartments:
| This neighborhood: | 1.6 |
| Peoria: | 1.8 |
Average number of cars or other vehicles available in apartments:
| Here: | 1.0 |
| city: | 1.1 |
Percentage of units with a mortgage:
| West Main: | 71.8% |
| Peoria: | 63.0% |
Average estimated value of detached houses in 2022 (46.2% of all units):
| West Main: | $86,758 |
| Peoria: | $191,429 |
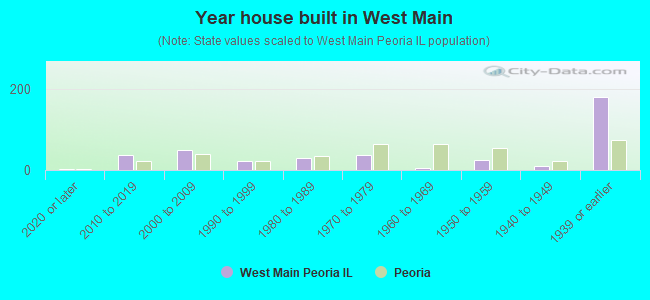
- Year house built in West Main
- 22020 or later
- 362010 to 2019
- 492000 to 2009
- 231990 to 1999
- 291980 to 1989
- 371970 to 1979
- 61960 to 1969
- 251950 to 1959
- 111940 to 1949
- 1791939 or earlier
City-data.com crime index for city in 2020 (higher means more crime):
| City: | 443.5 |
| U.S. average: | 219.5 |
Travel time to work (commute)
![Travel time to work (commute)]()
- 28Less than 5 minutes
- 525 to 9 minutes
- 8410 to 14 minutes
- 2315 to 19 minutes
- 2620 to 24 minutes
- 225 to 29 minutes
- 2630 to 34 minutes
- 845 to 59 minutes
- 360 to 89 minutes
- 890 or more minutes

Means of transportation to work
![Means of transportation to work]()
- 69.4%194Drove a car alone
- 7.5%21Carpooled
- 1.4%4Bus
- 0.4%1Taxi
- 2.5%7Bicycle
- 18.3%51Walked
- 8.9%25Worked at home

Time leaving home to go to work
![Time leaving home to go to work]()
- 812:00 a.m. to 4:59 a.m.
- 65:00 a.m. to 5:29 a.m.
- 335:30 a.m. to 5:59 a.m.
- 56:00 a.m. to 6:29 a.m.
- 86:30 a.m. to 6:59 a.m.
- 107:00 a.m. to 7:29 a.m.
- 377:30 a.m. to 7:59 a.m.
- 188:00 a.m. to 8:29 a.m.
- 138:30 a.m. to 8:59 a.m.
- 1010:00 a.m. to 10:59 a.m.
- 211:00 a.m. to 11:59 a.m.
- 4312:00 p.m. to 3:59 p.m.
- 564:00 p.m. to 11:59 p.m.

Occupations of males:
- Percentage of males in management occupations (except farmers):
Here: 12.6% city: 11.1%
- Percentage of males in business and financial operations occupations:
Here: 5.1% city: 4.5%
- Percentage of males in architecture and engineering occupations:
Here: 4.1% city: 9.0%
- Percentage of males in community and social services occupations:
Here: 6.8% city: 1.3%
- Percentage of males in education, training, and library occupations:
Here: 3.5% city: 3.7%
- Percentage of males in arts, design, entertainment, sports, and media occupations:
Here: 1.2% city: 1.9%
- Percentage of males in healthcare practitioners and technical occupations:
Here: 5.4% city: 4.7%
- Percentage of males in service occupations:
Here: 13.8% city: 15.9%
- Percentage of males in sales and office occupations:
Here: 6.3% city: 12.1%
- Percentage of males in farming, fishing, and forestry occupations:
Here: 9.3% city: 1.0%
- Percentage of males in construction, extraction, and maintenance occupations:
Here: 4.3% city: 5.4%
- Percentage of males in production occupations:
Here: 12.9% city: 7.6%
- Percentage of males in transportation occupations:
Here: 6.9% city: 5.1%
- Percentage of males in material moving occupations:
Here: 7.0% city: 6.4%
Occupations of females:
- Percentage of females in business and financial operations occupations:
Here: 8.5% city: 3.9%
- Percentage of females in computer and mathematical occupations:
Here: 1.7% city: 1.2%
- Percentage of females in life, physical, and social science occupations:
Here: 1.8% city: 1.4%
- Percentage of females in community and social services occupations:
Here: 3.7% city: 3.4%
- Percentage of females in education, training, and library occupations:
Here: 8.7% city: 9.3%
- Percentage of females in healthcare practitioners and technical occupations:
Here: 6.0% city: 14.9%
- Percentage of females in service occupations:
Here: 29.1% city: 24.2%
- Percentage of females in sales and office occupations:
Here: 23.7% city: 23.2%
- Percentage of females in transportation occupations:
Here: 3.0% city: 0.4%
- Percentage of females in material moving occupations:
Here: 13.6% city: 2.4%
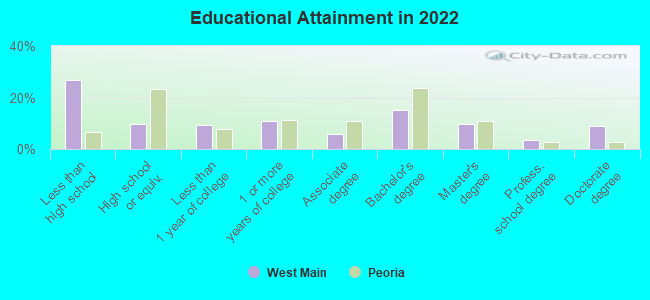
Education in this neighborhood (subdivision or community):
- Percentage of people 3 years and older in K-12 schools:
West Main: 33.0% Peoria: 17.8%
- Percentage of people 3 years and older in undergraduate colleges:
West Main: 18.2% Peoria: 7.5%
- Percentage of people 3 years and older in grad. or professional schools:
West Main: 5.8% Peoria: 2.5%
- Percentage of students K-12 enrolled in private schools:
West Main: 31.9% Peoria: 16.0%
Percentage of population below poverty level:
| West Main: | 33.3% |
| Peoria: | 17.4% |
Median year owner moved in (as recorded in 2022):
| West Main: | 2009 |
| Peoria: | 2013 |
Percentage of married-couple families with both working:
| West Main: | 62.5% |
| Peoria: | 71.4% |
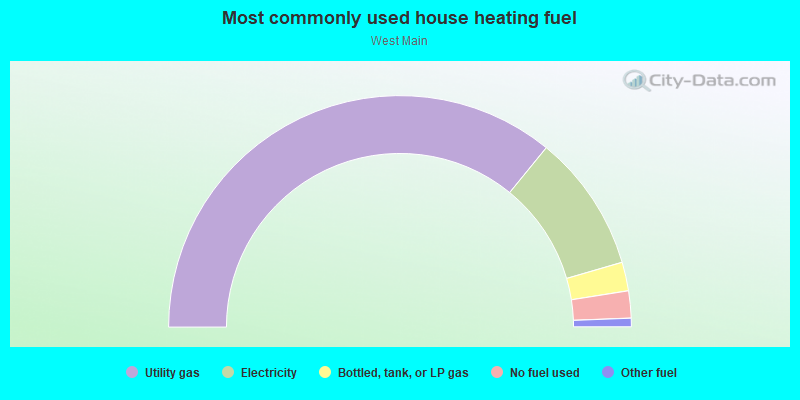
- 71.8%Utility gas
- 19.2%Electricity
- 4.0%Bottled, tank, or LP gas
- 3.8%No fuel used
- 1.2%Other fuel
Highways in this neighborhood:
W Main St (State Rte 8)
Length: 0.85 miles
Direction: E-W
Address range: 400 to 1199
Direction: E-W
Address range: 400 to 1199
N Bourland Ave (State Rte 8)
Length: 0.12 miles
Direction: N-S
Address range: 900 to 999
Direction: N-S
Address range: 900 to 999
Roads and streets:
W Windom St
Length: 0.64 miles
Direction: E-W
Address range: 700 to 1251
Direction: E-W
Address range: 700 to 1251
University St
Length: 0.10 miles
Directions: E-W, SE-NW
Directions: E-W, SE-NW
N Underhill St
Length: 0.08 miles
Direction: N-S
Address range: 912 to 999
Direction: N-S
Address range: 912 to 999
N Frink St
Length: 0.06 miles
Direction: N-S
Address range: 915 to 999
Direction: N-S
Address range: 915 to 999
N Orange St
Length: 0.06 miles
Direction: N-S
Address range: 918 to 999
Direction: N-S
Address range: 918 to 999
N Garfield Ave
Length: 0.06 miles
Direction: N-S
Address range: 917 to 999
Direction: N-S
Address range: 917 to 999
N Sheridan Rd
Length: 0.06 miles
Direction: N-S
Address range: 918 to 999
Direction: N-S
Address range: 918 to 999
N Douglas St
Length: 0.06 miles
Direction: N-S
Address range: 920 to 999
Direction: N-S
Address range: 920 to 999
N Ellis St
Length: 0.04 miles
Direction: N-S
Address range: 1000 to 1050
Direction: N-S
Address range: 1000 to 1050
W St James St
Length: 0.04 miles
Direction: E-W
Address range: 1100 to 1115
Direction: E-W
Address range: 1100 to 1115