West Park neighborhood in Ann Arbor, Michigan (MI), 48103 detailed profile
Settings
X


Business Search - 14 Million verified businesses
Area: 0.167 square miles
Population: 1,425
Population density:
| West Park: | 8,528 people per square mile |
| Ann Arbor: | 4,438 people per square mile |

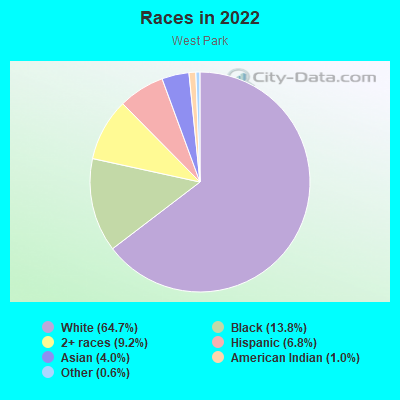
- 94864.7%White
- 20213.8%Black
- 1359.2%Two or more races
- 996.8%Hispanic or Latino
- 584.0%Asian
- 151.0%American Indian
- 90.6%Some other race
Median household income in 2022:
| West Park: | $98,120 |
| Ann Arbor: | $78,740 |
Distribution of median household income
![Distribution of median household income]()
- 87Less than $10,000
- 70$10,000 to $19,999
- 48$20,000 to $29,999
- 49$30,000 to $39,999
- 107$40,000 to $49,999
- 21$50,000 to $59,999
- 31$60,000 to $74,999
- 94$75,000 to $99,999
- 58$100,000 to $124,999
- 27$125,000 to $149,999
- 159$150,000 to $199,999
- 173$200,000 or more

Distribution of owner-occupied house/condo value
![Distribution of owner-occupied house/condo value]()
- 6$100,000 to $149,999
- 18$200,000 to $249,999
- 33$250,000 to $299,999
- 59$300,000 to $399,999
- 58$400,000 to $499,999
- 60$500,000 to $749,999
- 52$750,000 to $999,999
- 54$1,000,000 or more

Distribution of rent paid by renters
![Distribution of rent paid by renters]()
- 22$200 to $299
- 11$300 to $399
- 81$400 to $499
- 34$500 to $599
- 30$600 to $699
- 40$700 to $799
- 40$800 to $899
- 51$900 to $999
- 67$1,000 to $1,249
- 56$1,250 to $1,499
- 64$1,500 to $1,999
- 122$2,000 or more

Median rent in 2022:
| West Park: | $1,392 |
| Ann Arbor: | $1,381 |
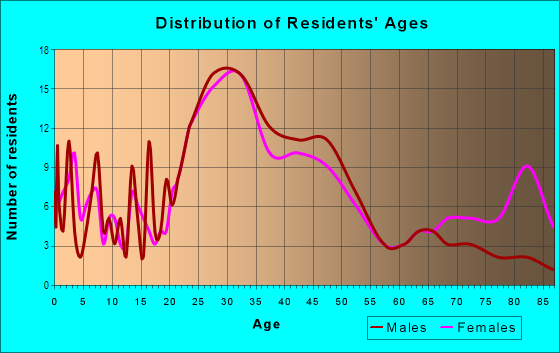
| Males: | 709 |
| Females: | 716 |
Males:
| This neighborhood: | 31.6 years |
| Whole city: | 25.8 years |
| This neighborhood: | 35.5 years |
| Whole city: | 26.4 years |
Average household size:
| West Park: | 6.3 people |
| Ann Arbor: | 2.2 people |
Percentage of family households:
| West Park: | 25.2% |
| Ann Arbor: | 30.6% |
| Here: | 29.1% |
| Ann Arbor: | 33.8% |
Percentage of married-couple families with children (among all households):
| West Park: | 46.4% |
| Ann Arbor: | 33.4% |
Percentage of single-mother households (among all households):
| West Park: | 10.5% |
| Ann Arbor: | 5.6% |
Percentage of never married males 15 years old and over:
Percentage of never married females 15 years old and over:
| West Park: | 28.4% |
| Ann Arbor: | 30.5% |
Percentage of never married females 15 years old and over:
| West Park: | 18.8% |
| city: | 27.5% |
Percentage of people that speak English not well or not at all:
| West Park: | 0.2% |
| Ann Arbor: | 1.5% |
Percentage of people born in this state:
Percentage of people born in another U.S. state:
Percentage of native residents but born outside the U.S.:
Percentage of foreign born residents:
| Here: | 50.7% |
| Ann Arbor: | 45.8% |
Percentage of people born in another U.S. state:
| West Park: | 45.6% |
| Ann Arbor: | 34.9% |
Percentage of native residents but born outside the U.S.:
| Here: | 0.6% |
| city: | 1.6% |
Percentage of foreign born residents:
| Here: | 3.1% |
| Ann Arbor: | 17.7% |
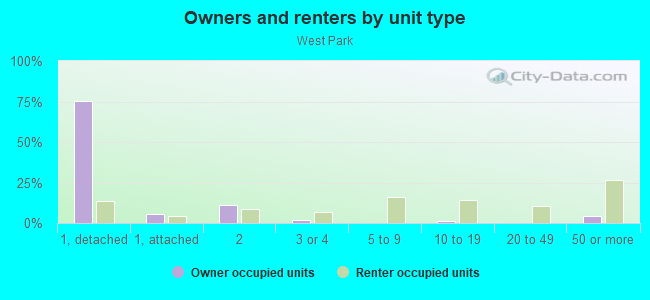
Owner-occupied
Renter-occupied

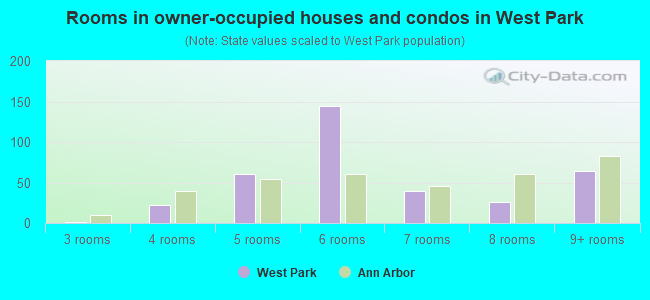
- Rooms in owner-occupied houses and condos in West Park
- 01 room
- 02 rooms
- 13 rooms
- 224 rooms
- 605 rooms
- 1446 rooms
- 397 rooms
- 268 rooms
- 649+ rooms
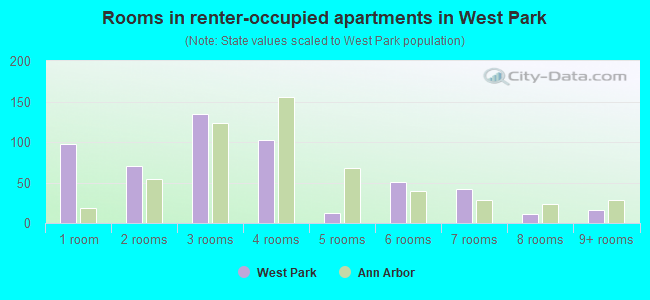
- Rooms in renter-occupied apartments in West Park
- 981 room
- 702 rooms
- 1353 rooms
- 1034 rooms
- 125 rooms
- 516 rooms
- 427 rooms
- 118 rooms
- 169+ rooms
Owner-occupied
Renter-occupied
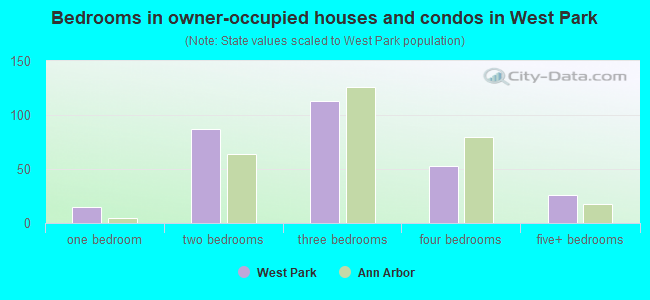
- Bedrooms in owner-occupied houses and condos in West Park
- 0no bedroom
- 151 bedroom
- 872 bedrooms
- 1133 bedrooms
- 534 bedrooms
- 265+ bedrooms
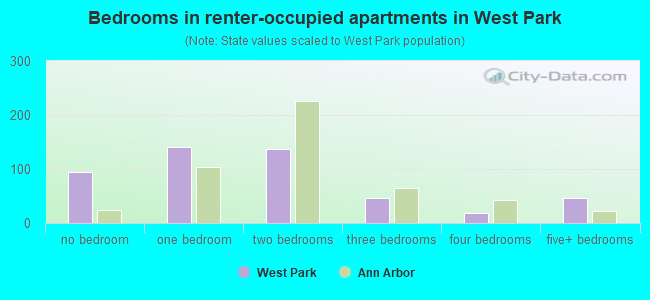
- Bedrooms in renter-occupied apartments in West Park
- 94no bedroom
- 1401 bedroom
- 1372 bedrooms
- 473 bedrooms
- 194 bedrooms
- 475+ bedrooms
Average number of cars or other vehicles available in houses/condos:
Average number of cars or other vehicles available in apartments:
| This neighborhood: | 1.9 |
| Ann Arbor: | 1.7 |
Average number of cars or other vehicles available in apartments:
| Here: | 0.9 |
| city: | 1.3 |
Percentage of units with a mortgage:
| West Park: | 57.3% |
| Ann Arbor: | 62.6% |
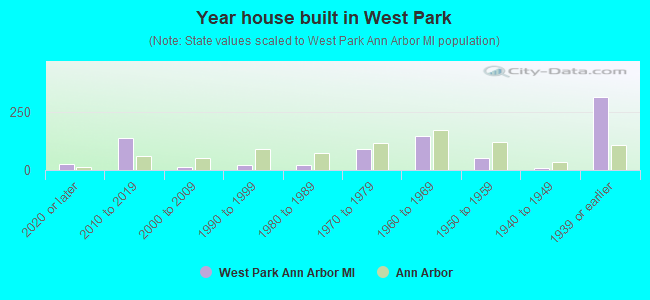
- Year house built in West Park
- 242020 or later
- 1382010 to 2019
- 142000 to 2009
- 221990 to 1999
- 231980 to 1989
- 911970 to 1979
- 1471960 to 1969
- 521950 to 1959
- 101940 to 1949
- 3131939 or earlier
City-data.com crime index for city in 2020 (higher means more crime):
| City: | 137.0 |
| U.S. average: | 219.5 |
Travel time to work (commute)
![Travel time to work (commute)]()
- 15Less than 5 minutes
- 1275 to 9 minutes
- 17710 to 14 minutes
- 16615 to 19 minutes
- 9120 to 24 minutes
- 7125 to 29 minutes
- 9330 to 34 minutes
- 435 to 39 minutes
- 740 to 44 minutes
- 2045 to 59 minutes
- 760 to 89 minutes

Means of transportation to work
![Means of transportation to work]()
- 34.9%293Drove a car alone
- 5.7%48Carpooled
- 14.4%121Bus
- 1.4%12Subway or elevated rail
- 6.2%52Bicycle
- 17.5%147Walked
- 25.4%213Worked at home

Time leaving home to go to work
![Time leaving home to go to work]()
- 1412:00 a.m. to 4:59 a.m.
- 45:00 a.m. to 5:29 a.m.
- 45:30 a.m. to 5:59 a.m.
- 326:00 a.m. to 6:29 a.m.
- 166:30 a.m. to 6:59 a.m.
- 587:00 a.m. to 7:29 a.m.
- 1257:30 a.m. to 7:59 a.m.
- 1728:00 a.m. to 8:29 a.m.
- 1488:30 a.m. to 8:59 a.m.
- 1059:00 a.m. to 9:59 a.m.
- 11010:00 a.m. to 10:59 a.m.
- 2511:00 a.m. to 11:59 a.m.
- 3412:00 p.m. to 3:59 p.m.
- 84:00 p.m. to 11:59 p.m.

Occupations of males:
- Percentage of males in management occupations (except farmers):
Here: 9.4% city: 10.3%
- Percentage of males in business and financial operations occupations:
Here: 4.0% city: 4.5%
- Percentage of males in computer and mathematical occupations:
Here: 4.5% city: 9.0%
- Percentage of males in architecture and engineering occupations:
Here: 2.5% city: 7.8%
- Percentage of males in life, physical, and social science occupations:
Here: 8.4% city: 5.8%
- Percentage of males in community and social services occupations:
Here: 2.1% city: 1.6%
- Percentage of males in legal occupations:
Here: 6.4% city: 2.2%
- Percentage of males in education, training, and library occupations:
Here: 30.7% city: 19.2%
- Percentage of males in arts, design, entertainment, sports, and media occupations:
Here: 9.0% city: 2.4%
- Percentage of males in healthcare practitioners and technical occupations:
Here: 1.5% city: 6.9%
- Percentage of males in service occupations:
Here: 8.2% city: 8.2%
- Percentage of males in sales and office occupations:
Here: 7.9% city: 10.4%
- Percentage of males in construction, extraction, and maintenance occupations:
Here: 1.3% city: 1.9%
- Percentage of males in production occupations:
Here: 4.2% city: 4.6%
Occupations of females:
- Percentage of females in management occupations (except farmers):
Here: 8.3% city: 8.5%
- Percentage of females in business and financial operations occupations:
Here: 5.5% city: 5.3%
- Percentage of females in architecture and engineering occupations:
Here: 1.2% city: 1.7%
- Percentage of females in community and social services occupations:
Here: 1.8% city: 3.5%
- Percentage of females in education, training, and library occupations:
Here: 38.1% city: 20.2%
- Percentage of females in arts, design, entertainment, sports, and media occupations:
Here: 2.1% city: 4.6%
- Percentage of females in healthcare practitioners and technical occupations:
Here: 12.2% city: 11.9%
- Percentage of females in service occupations:
Here: 11.8% city: 15.5%
- Percentage of females in sales and office occupations:
Here: 13.4% city: 17.0%
- Percentage of females in material moving occupations:
Here: 4.5% city: 1.0%
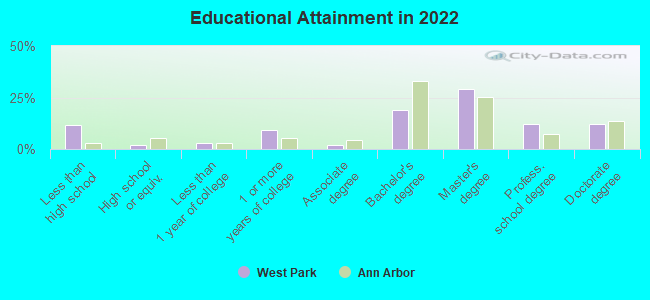
Education in this neighborhood (subdivision or community):
- Percentage of people 3 years and older in K-12 schools:
West Park: 10.4% Ann Arbor: 8.7%
- Percentage of people 3 years and older in undergraduate colleges:
West Park: 17.0% Ann Arbor: 25.6%
- Percentage of people 3 years and older in grad. or professional schools:
West Park: 18.0% Ann Arbor: 10.8%
- Percentage of students K-12 enrolled in private schools:
West Park: 30.8% Ann Arbor: 12.9%
Percentage of population below poverty level:
| West Park: | 34.6% |
| Ann Arbor: | 23.1% |
Median year renter moved in (as recorded in 2022):
| West Park: | 2018 |
| Ann Arbor: | 2022 |
Percentage of married-couple families with both working:
| West Park: | 81.2% |
| Ann Arbor: | 72.2% |
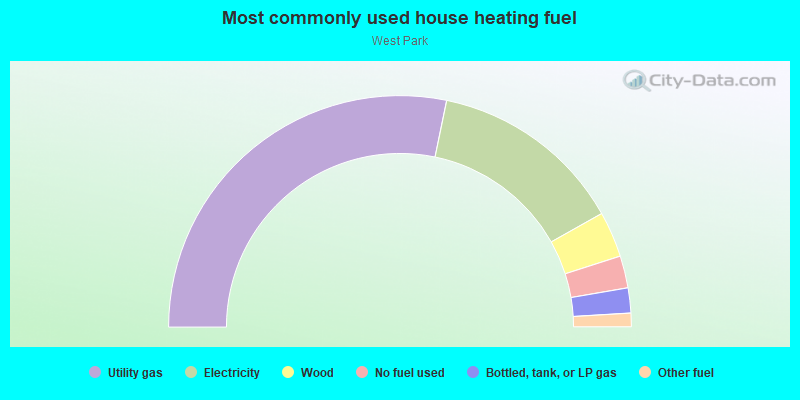
- 56.5%Utility gas
- 27.2%Electricity
- 6.4%Wood
- 4.5%No fuel used
- 3.5%Bottled, tank, or LP gas
- 1.9%Other fuel
Limited-access highways (interstate or state) in this neighborhood:
I- 94 Bus (W Huron St)
Length: 0.32 miles
Direction: E-W
Address range: 500 to 899
Direction: E-W
Address range: 500 to 899
Roads and streets:
Miller Ave
Length: 0.31 miles
Direction: E-W
Address range: 501 to 798
Direction: E-W
Address range: 501 to 798
Felch St
Length: 0.30 miles
Direction: E-W
Address range: 500 to 799
Direction: E-W
Address range: 500 to 799
Hiscock St
Length: 0.30 miles
Direction: E-W
Address range: 500 to 799
Direction: E-W
Address range: 500 to 799
W Washington St
Length: 0.21 miles
Direction: E-W
Address range: 500 to 799
Direction: E-W
Address range: 500 to 799
Fountain St
Length: 0.20 miles
Direction: N-S
Address range: 400 to 699
Direction: N-S
Address range: 400 to 699
Chapin St
Length: 0.18 miles
Direction: SW-NE
Address range: 100 to 299
Direction: SW-NE
Address range: 100 to 299
Miner St
Length: 0.16 miles
Directions: N-S, SW-NE
Address range: 500 to 699
Directions: N-S, SW-NE
Address range: 500 to 699
Spring St
Length: 0.14 miles
Direction: N-S
Address range: 452 to 699
Direction: N-S
Address range: 452 to 699
Gott St
Length: 0.12 miles
Direction: N-S
Address range: 500 to 699
Direction: N-S
Address range: 500 to 699
Cherry St
Length: 0.11 miles
Direction: E-W
Address range: 500 to 599
Direction: E-W
Address range: 500 to 599
3rd St
Length: 0.07 miles
Direction: N-S
Address range: 100 to 199
Direction: N-S
Address range: 100 to 199
Parkview Pl
Length: 0.07 miles
Directions: N-S, SE-NW
Address range: 1 to 199
Directions: N-S, SE-NW
Address range: 1 to 199