Western South Hill neighborhood in Ithaca, New York (NY), 14850 detailed profile
Settings
X


Business Search - 14 Million verified businesses
Area: 0.250 square miles
Population: 1,885
Population density:
| Western South Hill: | 7,533 people per square mile |
| Ithaca: | 5,740 people per square mile |

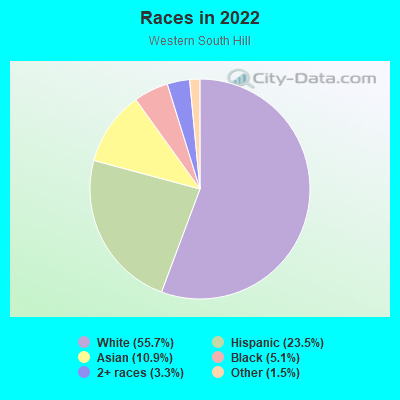
- 1,37055.7%White
- 57823.5%Hispanic or Latino
- 26910.9%Asian
- 1265.1%Black
- 803.3%Two or more races
- 361.5%Some other race
Median household income in 2022:
| Western South Hill: | $81,719 |
| Ithaca: | $45,468 |
Distribution of median household income
![Distribution of median household income]()
- 27Less than $10,000
- 169$10,000 to $19,999
- 38$20,000 to $29,999
- 52$30,000 to $39,999
- 108$40,000 to $49,999
- 60$50,000 to $59,999
- 63$60,000 to $74,999
- 95$75,000 to $99,999
- 140$100,000 to $124,999
- 18$125,000 to $149,999
- 76$150,000 to $199,999
- 71$200,000 or more

Distribution of owner-occupied house/condo value
![Distribution of owner-occupied house/condo value]()
- 134Less than $50,000
- 38$50,000 to $99,999
- 33$100,000 to $149,999
- 44$150,000 to $199,999
- 34$200,000 to $249,999
- 80$250,000 to $299,999
- 106$300,000 to $399,999
- 54$400,000 to $499,999
- 29$500,000 to $749,999
- 25$750,000 to $999,999

Distribution of rent paid by renters
![Distribution of rent paid by renters]()
- 2$100 to $199
- 1$200 to $299
- 2$300 to $399
- 63$600 to $699
- 139$700 to $799
- 56$800 to $899
- 205$900 to $999
- 39$1,000 to $1,249
- 71$1,250 to $1,499
- 200$1,500 to $1,999
- 32$2,000 or more

Median rent in 2022:
| Western South Hill: | $1,054 |
| Ithaca: | $1,274 |
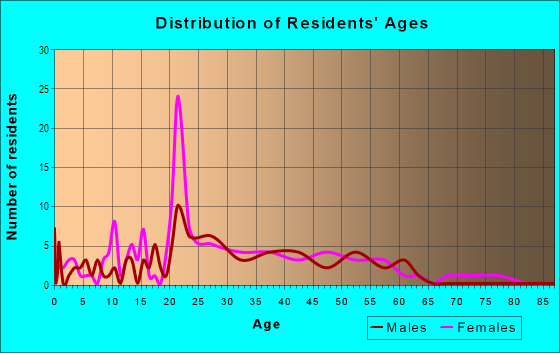
| Males: | 926 |
| Females: | 958 |
Males:
| This neighborhood: | 30.3 years |
| Whole city: | 22.9 years |
| This neighborhood: | 28.2 years |
| Whole city: | 22.7 years |
Average household size:
| Western South Hill: | 2.3 people |
| Ithaca: | 1.8 people |
Percentage of family households:
| Western South Hill: | 37.7% |
| Ithaca: | 21.1% |
| Here: | 40.7% |
| Ithaca: | 21.1% |
Percentage of married-couple families with children (among all households):
| Western South Hill: | 16.9% |
| Ithaca: | 26.0% |
Percentage of single-mother households (among all households):
| Western South Hill: | 24.7% |
| Ithaca: | 12.6% |
Percentage of never married males 15 years old and over:
Percentage of never married females 15 years old and over:
| Western South Hill: | 30.0% |
| Ithaca: | 37.7% |
Percentage of never married females 15 years old and over:
| Western South Hill: | 20.5% |
| city: | 34.4% |
Percentage of people that speak English not well or not at all:
| Western South Hill: | 0.0% |
| Ithaca: | 1.0% |
Percentage of people born in this state:
Percentage of people born in another U.S. state:
Percentage of native residents but born outside the U.S.:
Percentage of foreign born residents:
| Here: | 45.9% |
| Ithaca: | 40.5% |
Percentage of people born in another U.S. state:
| Western South Hill: | 42.6% |
| Ithaca: | 37.5% |
Percentage of native residents but born outside the U.S.:
| Here: | 0.5% |
| city: | 2.4% |
Percentage of foreign born residents:
| Here: | 11.0% |
| Ithaca: | 19.7% |
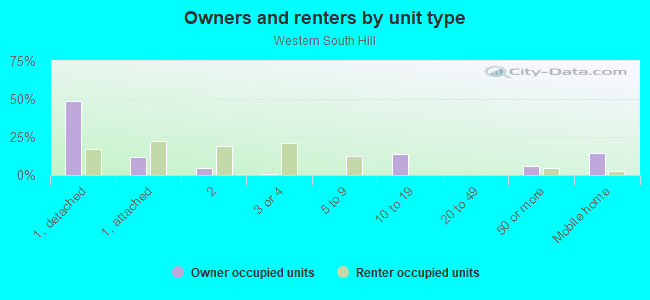
Owner-occupied
Renter-occupied

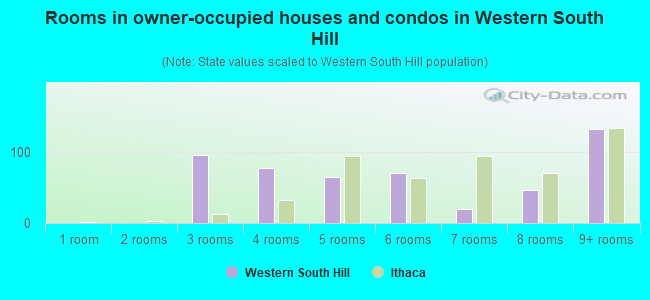
- Rooms in owner-occupied houses and condos in Western South Hill
- 01 room
- 02 rooms
- 963 rooms
- 774 rooms
- 655 rooms
- 706 rooms
- 207 rooms
- 468 rooms
- 1329+ rooms
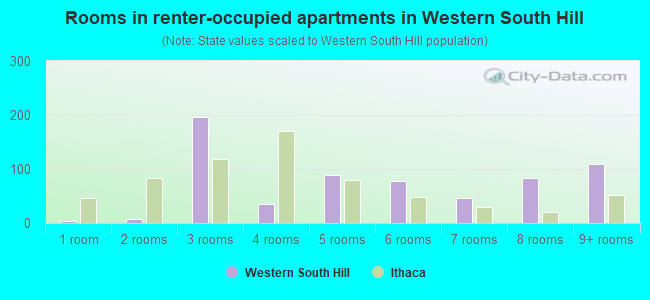
- Rooms in renter-occupied apartments in Western South Hill
- 31 room
- 82 rooms
- 1973 rooms
- 364 rooms
- 885 rooms
- 786 rooms
- 467 rooms
- 838 rooms
- 1099+ rooms
Owner-occupied
Renter-occupied
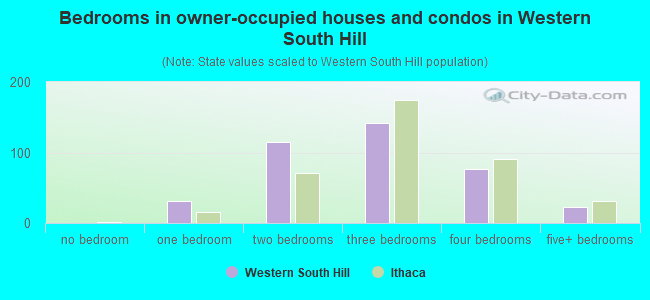
- Bedrooms in owner-occupied houses and condos in Western South Hill
- 0no bedroom
- 311 bedroom
- 1152 bedrooms
- 1423 bedrooms
- 764 bedrooms
- 225+ bedrooms
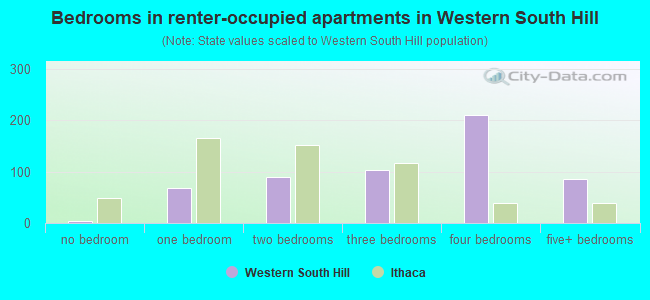
- Bedrooms in renter-occupied apartments in Western South Hill
- 3no bedroom
- 691 bedroom
- 892 bedrooms
- 1043 bedrooms
- 2104 bedrooms
- 865+ bedrooms
Average number of cars or other vehicles available in houses/condos:
Average number of cars or other vehicles available in apartments:
| This neighborhood: | 1.8 |
| Ithaca: | 1.6 |
Average number of cars or other vehicles available in apartments:
| Here: | 1.6 |
| city: | 1.0 |
Percentage of units with a mortgage:
| Western South Hill: | 50.0% |
| Ithaca: | 57.6% |
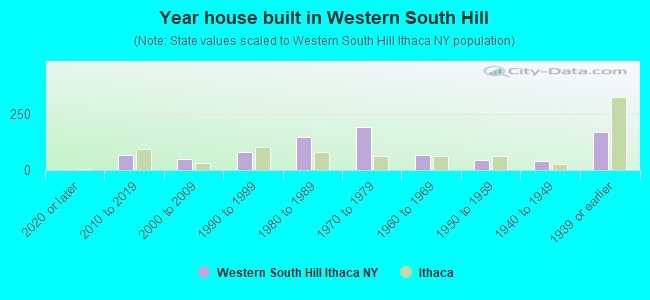
- Year house built in Western South Hill
- 02020 or later
- 682010 to 2019
- 472000 to 2009
- 821990 to 1999
- 1461980 to 1989
- 1931970 to 1979
- 681960 to 1969
- 441950 to 1959
- 421940 to 1949
- 1681939 or earlier
City-data.com crime index for city in 2020 (higher means more crime):
| City: | 265.9 |
| U.S. average: | 219.5 |
Travel time to work (commute)
![Travel time to work (commute)]()
- 2Less than 5 minutes
- 35 to 9 minutes
- 1210 to 14 minutes
- 1515 to 19 minutes
- 320 to 24 minutes
- 325 to 29 minutes
- 230 to 34 minutes
- 3245 to 59 minutes
- 290 or more minutes

Means of transportation to work
![Means of transportation to work]()
- 54.8%516Drove a car alone
- 10.0%94Carpooled
- 26.2%247Bus
- 4.6%43Motorcycle
- 6.4%60Walked
- 10.0%94Other means
- 14.0%132Worked at home

Time leaving home to go to work
![Time leaving home to go to work]()
- 112:00 a.m. to 4:59 a.m.
- 66:00 a.m. to 6:29 a.m.
- 127:00 a.m. to 7:29 a.m.
- 57:30 a.m. to 7:59 a.m.
- 98:00 a.m. to 8:29 a.m.
- 18:30 a.m. to 8:59 a.m.
- 79:00 a.m. to 9:59 a.m.
- 112:00 p.m. to 3:59 p.m.
- 34:00 p.m. to 11:59 p.m.

Occupations of males:
- Percentage of males in management occupations (except farmers):
Here: 6.4% city: 6.8%
- Percentage of males in business and financial operations occupations:
Here: 3.4% city: 4.4%
- Percentage of males in computer and mathematical occupations:
Here: 3.0% city: 6.5%
- Percentage of males in architecture and engineering occupations:
Here: 2.1% city: 3.1%
- Percentage of males in life, physical, and social science occupations:
Here: 8.3% city: 6.1%
- Percentage of males in community and social services occupations:
Here: 23.0% city: 1.4%
- Percentage of males in education, training, and library occupations:
Here: 16.9% city: 22.0%
- Percentage of males in arts, design, entertainment, sports, and media occupations:
Here: 1.6% city: 5.6%
- Percentage of males in healthcare practitioners and technical occupations:
Here: 2.4% city: 0.6%
- Percentage of males in service occupations:
Here: 8.6% city: 18.1%
- Percentage of males in sales and office occupations:
Here: 23.3% city: 13.8%
- Percentage of males in construction, extraction, and maintenance occupations:
Here: 9.3% city: 3.1%
- Percentage of males in transportation occupations:
Here: 6.5% city: 1.3%
- Percentage of males in material moving occupations:
Here: 6.3% city: 1.6%
Occupations of females:
- Percentage of females in management occupations (except farmers):
Here: 16.3% city: 6.2%
- Percentage of females in business and financial operations occupations:
Here: 13.9% city: 4.5%
- Percentage of females in computer and mathematical occupations:
Here: 7.1% city: 5.0%
- Percentage of females in life, physical, and social science occupations:
Here: 7.0% city: 8.1%
- Percentage of females in community and social services occupations:
Here: 1.1% city: 6.6%
- Percentage of females in education, training, and library occupations:
Here: 16.8% city: 22.2%
- Percentage of females in arts, design, entertainment, sports, and media occupations:
Here: 3.4% city: 4.7%
- Percentage of females in healthcare practitioners and technical occupations:
Here: 7.3% city: 3.5%
- Percentage of females in service occupations:
Here: 13.6% city: 19.5%
- Percentage of females in sales and office occupations:
Here: 8.3% city: 14.3%
- Percentage of females in production occupations:
Here: 1.7% city: 1.3%
- Percentage of females in material moving occupations:
Here: 2.9% city: 1.0%
Percentage of people 16-64 in Armed Forces:
| Western South Hill: | 1.1% |
| Ithaca: | 0.0% |
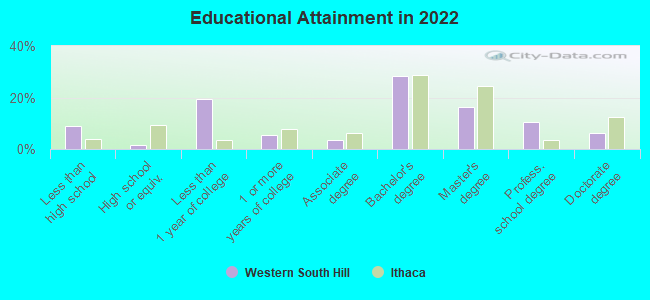
Education in this neighborhood (subdivision or community):
- Percentage of people 3 years and older in K-12 schools:
Western South Hill: 17.1% Ithaca: 5.1%
- Percentage of people 3 years and older in undergraduate colleges:
Western South Hill: 85.1% Ithaca: 42.7%
- Percentage of people 3 years and older in grad. or professional schools:
Western South Hill: 13.2% Ithaca: 12.4%
- Percentage of students K-12 enrolled in private schools:
Western South Hill: 0.6% Ithaca: 15.4%
Percentage of population below poverty level:
| Western South Hill: | 35.4% |
| Ithaca: | 33.1% |
Median year owner moved in (as recorded in 2022):
| Western South Hill: | 2009 |
| Ithaca: | 2007 |
Percentage of married-couple families with both working:
| Western South Hill: | 80.8% |
| Ithaca: | 83.1% |
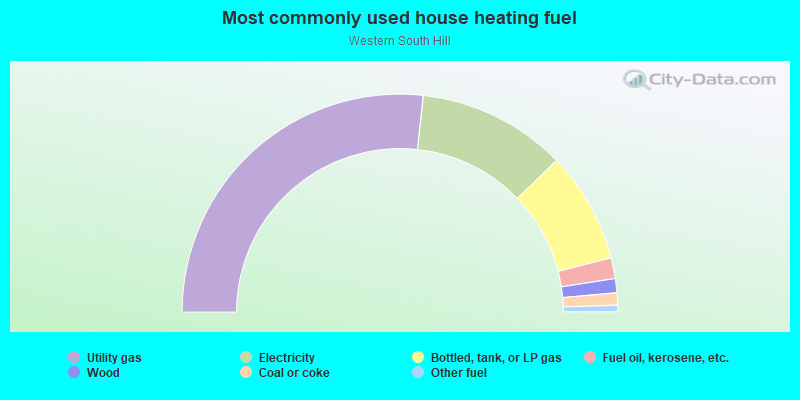
- 53.5%Utility gas
- 22.1%Electricity
- 16.5%Bottled, tank, or LP gas
- 3.1%Fuel oil, kerosene, etc.
- 2.1%Wood
- 1.8%Coal or coke
- 1.0%Other fuel
Roads and streets:
Spencer Rd
Length: 1.47 miles
Direction: SW-NE
Address range: 302 to 725
Direction: SW-NE
Address range: 302 to 725
S Hill Ter
Length: 0.22 miles
Directions: E-W, SW-NE
Address range: 100 to 299
Directions: E-W, SW-NE
Address range: 100 to 299
Stone Quarry Rd
Length: 0.21 miles
Direction: SW-NE
Direction: SW-NE
S Cayuga St
Length: 0.20 miles
Directions: N-S, SW-NE
Address range: 396 to 699
Directions: N-S, SW-NE
Address range: 396 to 699
Turner Pl
Length: 0.20 miles
Direction: N-S
Address range: 301 to 699
Direction: N-S
Address range: 301 to 699
Morris Heights Rd
Length: 0.18 miles
Directions: E-W, N-S, SE-NW, SW-NE
Address range: 100 to 119
Directions: E-W, N-S, SE-NW, SW-NE
Address range: 100 to 119
S Meadow St
Length: 0.12 miles
Direction: N-S
Address range: 800 to 899
Direction: N-S
Address range: 800 to 899
W Spencer St
Length: 0.12 miles
Direction: SW-NE
Address range: 300 to 316
Direction: SW-NE
Address range: 300 to 316
Hillview Pl
Length: 0.06 miles
Direction: E-W
Address range: 200 to 299
Direction: E-W
Address range: 200 to 299
Fountain St
Length: 0.04 miles
Direction: E-W
Direction: E-W
Pleasant St
Length: 0.02 miles
Direction: E-W
Direction: E-W