Westlake neighborhood in Seattle, Washington (WA), 98109 detailed profile
Settings
X


Business Search - 14 Million verified businesses
Area: 0.150 square miles
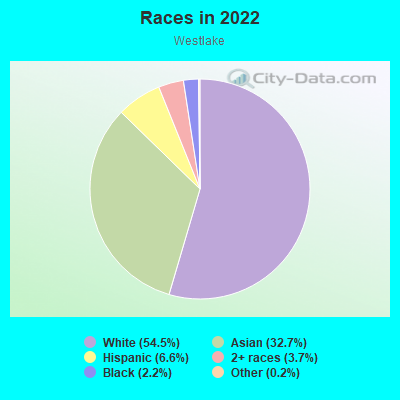
Population: 1,715
Population density:
| Westlake: | 11,466 people per square mile |
| Seattle: | 8,933 people per square mile |

- 93654.5%White
- 56232.7%Asian
- 1136.6%Hispanic or Latino
- 643.7%Two or more races
- 382.2%Black
- 40.2%Some other race
Median household income in 2022:
| Westlake: | $148,621 |
| Seattle: | $115,409 |
Distribution of median household income
![Distribution of median household income]()
- 13Less than $10,000
- 47$10,000 to $19,999
- 31$20,000 to $29,999
- 14$30,000 to $39,999
- 12$40,000 to $49,999
- 44$50,000 to $59,999
- 39$60,000 to $74,999
- 97$75,000 to $99,999
- 247$100,000 to $124,999
- 61$125,000 to $149,999
- 145$150,000 to $199,999
- 351$200,000 or more

Distribution of owner-occupied house/condo value
![Distribution of owner-occupied house/condo value]()
- 14Less than $50,000
- 21$100,000 to $149,999
- 15$250,000 to $299,999
- 53$400,000 to $499,999
- 86$500,000 to $749,999
- 158$750,000 to $999,999
- 177$1,000,000 or more

Distribution of rent paid by renters
![Distribution of rent paid by renters]()
- 11$300 to $399
- 47$800 to $899
- 18$900 to $999
- 20$1,000 to $1,249
- 11$1,250 to $1,499
- 233$1,500 to $1,999
- 272$2,000 or more

Median rent in 2022:
| Westlake: | $1,960 |
| Seattle: | $1,762 |
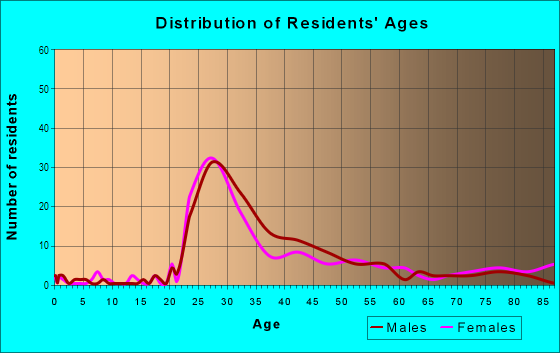
| Males: | 812 |
| Females: | 903 |
Males:
| This neighborhood: | 31.4 years |
| Whole city: | 35.7 years |
| This neighborhood: | 30.7 years |
| Whole city: | 36.2 years |
Average household size:
| Westlake: | 1.7 people |
| Seattle: | 2.0 people |
Percentage of family households:
| Westlake: | 18.8% |
| Seattle: | 30.9% |
| Here: | 25.0% |
| Seattle: | 33.2% |
Percentage of married-couple families with children (among all households):
| Westlake: | 59.8% |
| Seattle: | 36.5% |
Percentage of single-mother households (among all households):
| Westlake: | 16.0% |
| Seattle: | 9.3% |
Percentage of never married males 15 years old and over:
Percentage of never married females 15 years old and over:
| Westlake: | 22.8% |
| Seattle: | 24.9% |
Percentage of never married females 15 years old and over:
| Westlake: | 30.7% |
| city: | 22.3% |
Percentage of people that speak English not well or not at all:
| Westlake: | 0.0% |
| Seattle: | 3.2% |
Percentage of people born in this state:
Percentage of people born in another U.S. state:
Percentage of native residents but born outside the U.S.:
Percentage of foreign born residents:
| Here: | 24.7% |
| Seattle: | 34.6% |
Percentage of people born in another U.S. state:
| Westlake: | 58.2% |
| Seattle: | 42.9% |
Percentage of native residents but born outside the U.S.:
| Here: | 1.4% |
| city: | 2.2% |
Percentage of foreign born residents:
| Here: | 15.6% |
| Seattle: | 20.3% |
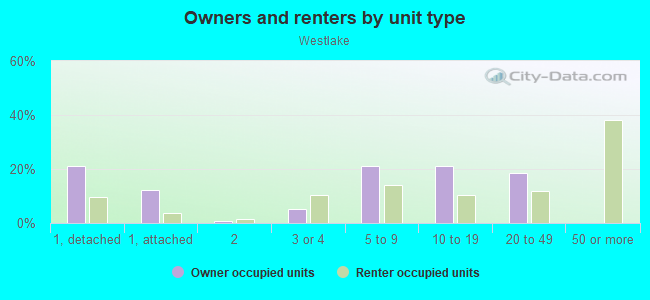
Owner-occupied
Renter-occupied

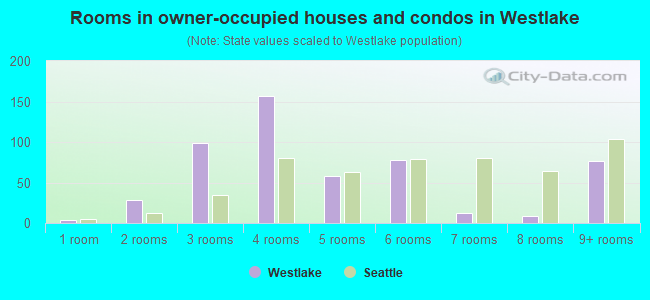
- Rooms in owner-occupied houses and condos in Westlake
- 41 room
- 292 rooms
- 993 rooms
- 1574 rooms
- 585 rooms
- 786 rooms
- 127 rooms
- 98 rooms
- 769+ rooms
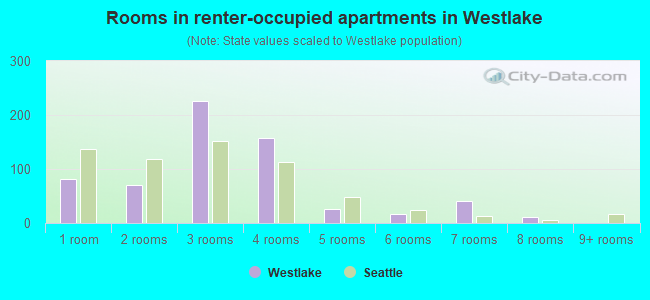
- Rooms in renter-occupied apartments in Westlake
- 821 room
- 712 rooms
- 2263 rooms
- 1574 rooms
- 265 rooms
- 166 rooms
- 407 rooms
- 118 rooms
- 09+ rooms
Owner-occupied
Renter-occupied
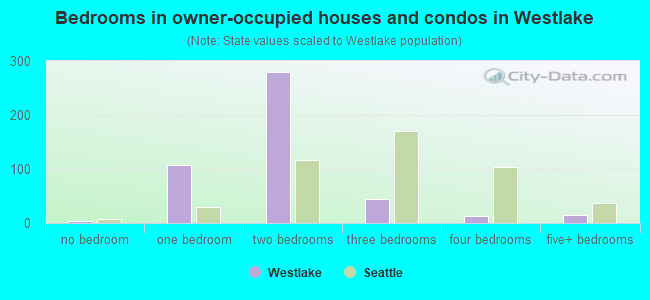
- Bedrooms in owner-occupied houses and condos in Westlake
- 4no bedroom
- 1071 bedroom
- 2802 bedrooms
- 443 bedrooms
- 134 bedrooms
- 145+ bedrooms
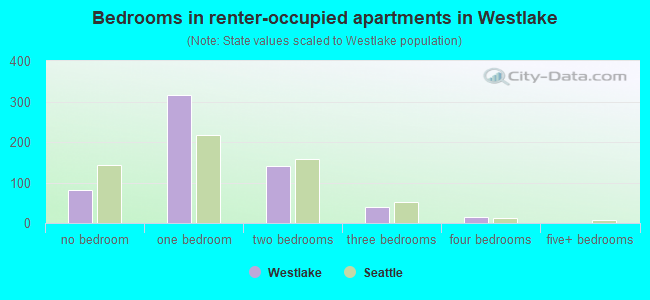
- Bedrooms in renter-occupied apartments in Westlake
- 82no bedroom
- 3151 bedroom
- 1402 bedrooms
- 403 bedrooms
- 164 bedrooms
- 05+ bedrooms
Average number of cars or other vehicles available in houses/condos:
Average number of cars or other vehicles available in apartments:
| This neighborhood: | 1.4 |
| Seattle: | 1.7 |
Average number of cars or other vehicles available in apartments:
| Here: | 1.1 |
| city: | 0.9 |
Percentage of units with a mortgage:
| Westlake: | 84.5% |
| Seattle: | 70.4% |
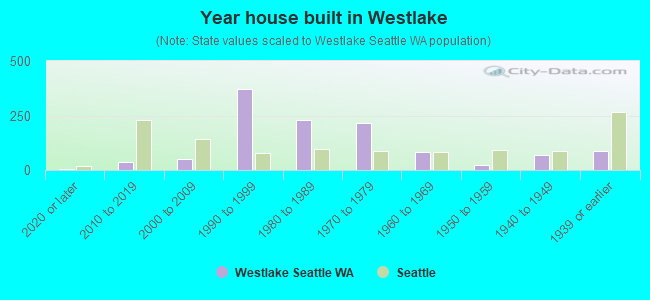
- Year house built in Westlake
- 62020 or later
- 352010 to 2019
- 512000 to 2009
- 3701990 to 1999
- 2301980 to 1989
- 2151970 to 1979
- 831960 to 1969
- 241950 to 1959
- 681940 to 1949
- 891939 or earlier
City-data.com crime index for city in 2020 (higher means more crime):
| City: | 440.8 |
| U.S. average: | 219.5 |
Travel time to work (commute)
![Travel time to work (commute)]()
- 14Less than 5 minutes
- 265 to 9 minutes
- 12510 to 14 minutes
- 14815 to 19 minutes
- 12820 to 24 minutes
- 4625 to 29 minutes
- 16430 to 34 minutes
- 3535 to 39 minutes
- 4640 to 44 minutes
- 4545 to 59 minutes
- 3660 to 89 minutes
- 790 or more minutes

Means of transportation to work
![Means of transportation to work]()
- 52.9%686Drove a car alone
- 6.8%88Carpooled
- 8.2%106Bus
- 0.8%10Taxi
- 1.7%22Bicycle
- 3.5%45Walked
- 4.5%58Other means
- 22.3%289Worked at home

Time leaving home to go to work
![Time leaving home to go to work]()
- 3512:00 a.m. to 4:59 a.m.
- 135:00 a.m. to 5:29 a.m.
- 66:00 a.m. to 6:29 a.m.
- 616:30 a.m. to 6:59 a.m.
- 437:00 a.m. to 7:29 a.m.
- 1607:30 a.m. to 7:59 a.m.
- 1428:00 a.m. to 8:29 a.m.
- 1028:30 a.m. to 8:59 a.m.
- 1059:00 a.m. to 9:59 a.m.
- 5310:00 a.m. to 10:59 a.m.
- 911:00 a.m. to 11:59 a.m.
- 5112:00 p.m. to 3:59 p.m.
- 284:00 p.m. to 11:59 p.m.

Occupations of males:
- Percentage of males in management occupations (except farmers):
Here: 16.0% city: 16.0%
- Percentage of males in business and financial operations occupations:
Here: 8.8% city: 7.6%
- Percentage of males in computer and mathematical occupations:
Here: 18.1% city: 18.5%
- Percentage of males in architecture and engineering occupations:
Here: 3.0% city: 5.6%
- Percentage of males in life, physical, and social science occupations:
Here: 3.5% city: 2.5%
- Percentage of males in legal occupations:
Here: 4.8% city: 2.0%
- Percentage of males in education, training, and library occupations:
Here: 1.8% city: 4.1%
- Percentage of males in arts, design, entertainment, sports, and media occupations:
Here: 4.6% city: 3.8%
- Percentage of males in healthcare practitioners and technical occupations:
Here: 1.2% city: 3.6%
- Percentage of males in service occupations:
Here: 18.7% city: 10.5%
- Percentage of males in sales and office occupations:
Here: 20.8% city: 12.0%
- Percentage of males in production occupations:
Here: 1.9% city: 2.6%
- Percentage of males in material moving occupations:
Here: 1.2% city: 1.9%
Occupations of females:
- Percentage of females in management occupations (except farmers):
Here: 10.4% city: 14.2%
- Percentage of females in business and financial operations occupations:
Here: 8.0% city: 9.8%
- Percentage of females in computer and mathematical occupations:
Here: 4.3% city: 6.6%
- Percentage of females in architecture and engineering occupations:
Here: 3.8% city: 2.1%
- Percentage of females in life, physical, and social science occupations:
Here: 2.3% city: 3.0%
- Percentage of females in community and social services occupations:
Here: 1.4% city: 3.2%
- Percentage of females in legal occupations:
Here: 2.9% city: 2.5%
- Percentage of females in education, training, and library occupations:
Here: 3.3% city: 8.7%
- Percentage of females in arts, design, entertainment, sports, and media occupations:
Here: 4.6% city: 5.0%
- Percentage of females in healthcare practitioners and technical occupations:
Here: 3.3% city: 9.6%
- Percentage of females in service occupations:
Here: 22.6% city: 13.7%
- Percentage of females in sales and office occupations:
Here: 36.7% city: 17.7%
- Percentage of females in construction, extraction, and maintenance occupations:
Here: 2.1% city: 0.2%
- Percentage of females in transportation occupations:
Here: 6.3% city: 0.8%
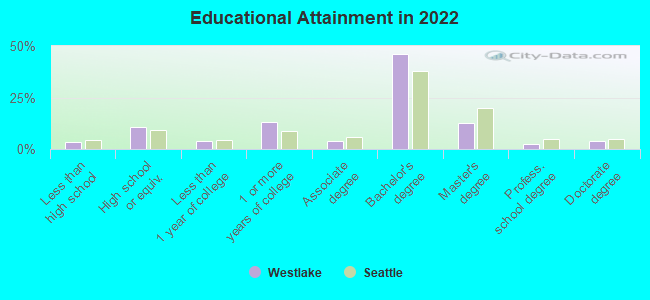
Education in this neighborhood (subdivision or community):
- Percentage of people 3 years and older in K-12 schools:
Westlake: 4.6% Seattle: 9.8%
- Percentage of people 3 years and older in undergraduate colleges:
Westlake: 5.2% Seattle: 6.3%
- Percentage of people 3 years and older in grad. or professional schools:
Westlake: 1.7% Seattle: 3.0%
- Percentage of students K-12 enrolled in private schools:
Westlake: 67.5% Seattle: 17.3%
Percentage of population below poverty level:
| Westlake: | 8.3% |
| Seattle: | 10.1% |
Median year owner moved in (as recorded in 2022):
Median year renter moved in (as recorded in 2022):
| Westlake: | 2017 |
| Seattle: | 2013 |
Median year renter moved in (as recorded in 2022):
| Westlake: | 2018 |
| Seattle: | 2021 |
Percentage of married-couple families with both working:
| Westlake: | 56.9% |
| Seattle: | 74.4% |
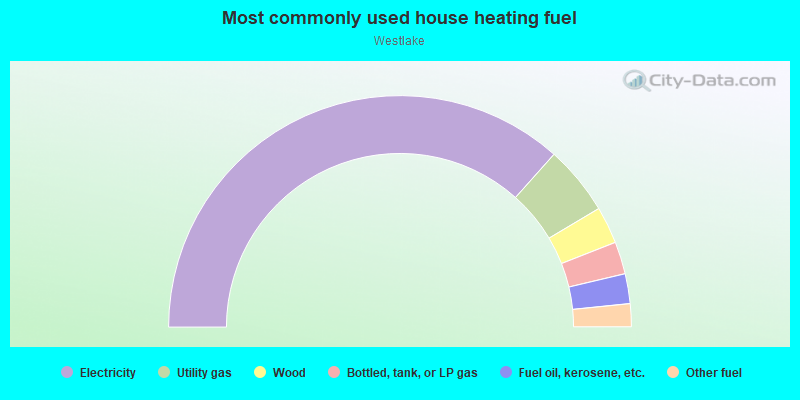
- 73.2%Electricity
- 9.7%Utility gas
- 5.2%Wood
- 4.5%Bottled, tank, or LP gas
- 4.2%Fuel oil, kerosene, etc.
- 3.2%Other fuel
Highways in this neighborhood:
Aurora Ave N (State Rte 99)
Length: 0.55 miles
Directions: N-S, SE-NW
Address range: 1100 to 2315
Directions: N-S, SE-NW
Address range: 1100 to 2315
Roads and streets:
Westlake Ave N
Length: 0.56 miles
Directions: N-S, SE-NW
Address range: 1101 to 2001
Directions: N-S, SE-NW
Address range: 1101 to 2001
Dexter Ave N
Length: 0.54 miles
Directions: N-S, SE-NW
Address range: 1070 to 1999
Directions: N-S, SE-NW
Address range: 1070 to 1999
8th Ave N
Length: 0.20 miles
Directions: E-W, N-S, SE-NW
Address range: 1514 to 1999
Directions: E-W, N-S, SE-NW
Address range: 1514 to 1999
Newton St
Length: 0.12 miles
Direction: E-W
Address range: 750 to 899
Direction: E-W
Address range: 750 to 899
Highland Dr
Length: 0.11 miles
Direction: E-W
Address range: 700 to 799
Direction: E-W
Address range: 700 to 799
Garfield St
Length: 0.09 miles
Direction: E-W
Address range: 746 to 799
Direction: E-W
Address range: 746 to 799
Hayes St
Length: 0.08 miles
Direction: E-W
Address range: 752 to 799
Direction: E-W
Address range: 752 to 799
Prospect St
Length: 0.08 miles
Direction: E-W
Address range: 700 to 749
Direction: E-W
Address range: 700 to 749
Howe St
Length: 0.06 miles
Direction: E-W
Direction: E-W
Lee St
Length: 0.06 miles
Direction: E-W
Direction: E-W
Galer St
Length: 0.05 miles
Direction: E-W
Address range: 700 to 749
Direction: E-W
Address range: 700 to 749
Comstock St
Length: 0.05 miles
Direction: E-W
Address range: 700 to 749
Direction: E-W
Address range: 700 to 749
Dexter Ct N
Length: 0.04 miles
Direction: N-S
Address range: 1200 to 1299
Direction: N-S
Address range: 1200 to 1299