Westridge neighborhood in Salinas, California (CA), 93907 detailed profile
Settings
X


Business Search - 14 Million verified businesses
Area: 0.295 square miles
Population: 97
Population density:
| Westridge: | 329 people per square mile |
| Salinas: | 8,472 people per square mile |

- 7256.2%Hispanic or Latino
- 2217.2%Some other race
- 129.4%Asian
- 118.6%Black
- 97.0%White
- 21.6%Two or more races

Median household income in 2022:
| Westridge: | $85,560 |
| Salinas: | $80,560 |
Distribution of median household income
![Distribution of median household income]()
- 1Less than $10,000
- 1$10,000 to $19,999
- 2$20,000 to $29,999
- 3$30,000 to $39,999
- 4$40,000 to $49,999
- 60$50,000 to $59,999
- 3$60,000 to $74,999
- 10$75,000 to $99,999
- 5$100,000 to $124,999
- 3$125,000 to $149,999
- 3$150,000 to $199,999
- 2$200,000 or more

Distribution of owner-occupied house/condo value
![Distribution of owner-occupied house/condo value]()
- 2Less than $50,000
- 1$50,000 to $99,999
- 1$200,000 to $249,999
- 2$250,000 to $299,999
- 5$300,000 to $399,999
- 1$400,000 to $499,999
- 6$500,000 to $749,999
- 1$750,000 to $999,999
- 17$1,000,000 or more

Distribution of rent paid by renters
![Distribution of rent paid by renters]()
- 10$200 to $299
- 1$400 to $499
- 1$500 to $599
- 3$600 to $699
- 1$700 to $799
- 1$900 to $999
- 57$1,000 to $1,249
- 2$1,250 to $1,499
- 8$1,500 to $1,999
- 5$2,000 or more

Median rent in 2022:
| Westridge: | $1,632 |
| Salinas: | $1,713 |
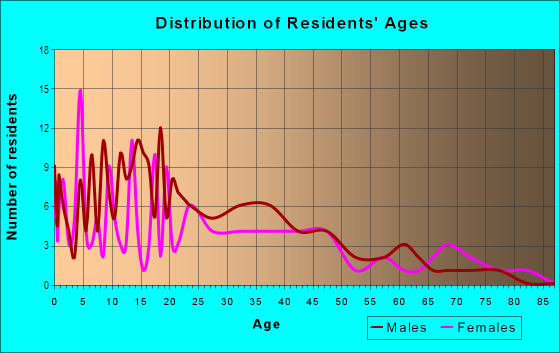
| Males: | 42 |
| Females: | 55 |
Males:
| This neighborhood: | 31.9 years |
| Whole city: | 33.7 years |
| This neighborhood: | 35.3 years |
| Whole city: | 33.8 years |
Average household size:
| Westridge: | 3.1 people |
| Salinas: | 3.5 people |
Percentage of family households:
| Westridge: | 48.9% |
| Salinas: | 58.3% |
| Here: | 47.2% |
| Salinas: | 48.7% |
Percentage of married-couple families with children (among all households):
| Westridge: | 19.9% |
| Salinas: | 16.8% |
Percentage of single-mother households (among all households):
| Westridge: | 7.1% |
| Salinas: | 8.2% |
Percentage of never married males 15 years old and over:
Percentage of never married females 15 years old and over:
| Westridge: | 20.5% |
| Salinas: | 23.7% |
Percentage of never married females 15 years old and over:
| Westridge: | 25.7% |
| city: | 20.8% |
Percentage of people that speak English not well or not at all:
| Westridge: | 10.7% |
| Salinas: | 24.2% |
Percentage of people born in this state:
Percentage of people born in another U.S. state:
Percentage of native residents but born outside the U.S.:
Percentage of foreign born residents:
| Here: | 57.0% |
| Salinas: | 55.1% |
Percentage of people born in another U.S. state:
| Westridge: | 8.5% |
| Salinas: | 5.9% |
Percentage of native residents but born outside the U.S.:
| Here: | 2.7% |
| city: | 1.3% |
Percentage of foreign born residents:
| Here: | 31.8% |
| Salinas: | 37.7% |

Owner-occupied
Renter-occupied


- Rooms in owner-occupied houses and condos in Westridge
- 281 room
- 02 rooms
- 03 rooms
- 34 rooms
- 45 rooms
- 36 rooms
- 07 rooms
- 148 rooms
- 269+ rooms

- Rooms in renter-occupied apartments in Westridge
- 01 room
- 02 rooms
- 23 rooms
- 34 rooms
- 65 rooms
- 46 rooms
- 07 rooms
- 138 rooms
- 09+ rooms
Owner-occupied
Renter-occupied

- Bedrooms in owner-occupied houses and condos in Westridge
- 28no bedroom
- 01 bedroom
- 32 bedrooms
- 73 bedrooms
- 04 bedrooms
- 25+ bedrooms

- Bedrooms in renter-occupied apartments in Westridge
- 0no bedroom
- 21 bedroom
- 52 bedrooms
- 103 bedrooms
- 134 bedrooms
- 05+ bedrooms
Average number of cars or other vehicles available in houses/condos:
Average number of cars or other vehicles available in apartments:
| This neighborhood: | 2.3 |
| Salinas: | 2.5 |
Average number of cars or other vehicles available in apartments:
| Here: | 2.0 |
| city: | 1.9 |
Percentage of units with a mortgage:
| Westridge: | 72.5% |
| Salinas: | 61.3% |
Housing prices:
- Average estimated value of detached houses in 2022 (34.4% of all units):
Westridge: $593,748 California: $988,808
- Average estimated value of townhouses or other attached units in 2022 (31.2% of all units):
This neighborhood: $435,403 California: $838,546
- Average estimated '22 value of housing units in 3-to-4-unit structures (15.6% of all units):
Westridge: $262,183 California: $824,253

- Year house built in Westridge
- 32020 or later
- 02010 to 2019
- 12000 to 2009
- 31990 to 1999
- 101980 to 1989
- 61970 to 1979
- 41960 to 1969
- 31950 to 1959
- 21940 to 1949
- 261939 or earlier

City-data.com crime index for city in 2020 (higher means more crime):
| City: | 289.6 |
| U.S. average: | 219.5 |
Travel time to work (commute)
![Travel time to work (commute)]()
- 2Less than 5 minutes
- 65 to 9 minutes
- 510 to 14 minutes
- 815 to 19 minutes
- 1420 to 24 minutes
- 425 to 29 minutes
- 330 to 34 minutes
- 335 to 39 minutes
- 240 to 44 minutes
- 245 to 59 minutes
- 160 to 89 minutes
- 290 or more minutes

Means of transportation to work
![Means of transportation to work]()
- 82.6%39Drove a car alone
- 8.5%4Carpooled
- 88.9%42Bus
- 2.1%1Walked
- 29.6%14Other means
- 2.1%1Worked at home

Time leaving home to go to work
![Time leaving home to go to work]()
- 612:00 a.m. to 4:59 a.m.
- 45:00 a.m. to 5:29 a.m.
- 15:30 a.m. to 5:59 a.m.
- 76:00 a.m. to 6:29 a.m.
- 66:30 a.m. to 6:59 a.m.
- 77:00 a.m. to 7:29 a.m.
- 47:30 a.m. to 7:59 a.m.
- 68:00 a.m. to 8:29 a.m.
- 29:00 a.m. to 9:59 a.m.
- 110:00 a.m. to 10:59 a.m.
- 211:00 a.m. to 11:59 a.m.
- 312:00 p.m. to 3:59 p.m.
- 24:00 p.m. to 11:59 p.m.

Occupations of males:
- Percentage of males in management occupations (except farmers):
Here: 4.0% city: 5.9%
- Percentage of males in business and financial operations occupations:
Here: 2.6% city: 2.3%
- Percentage of males in computer and mathematical occupations:
Here: 4.2% city: 1.0%
- Percentage of males in education, training, and library occupations:
Here: 7.7% city: 2.2%
- Percentage of males in arts, design, entertainment, sports, and media occupations:
Here: 5.9% city: 1.0%
- Percentage of males in healthcare practitioners and technical occupations:
Here: 1.7% city: 1.6%
- Percentage of males in service occupations:
Here: 21.3% city: 16.5%
- Percentage of males in sales and office occupations:
Here: 15.8% city: 12.2%
- Percentage of males in farming, fishing, and forestry occupations:
Here: 2.4% city: 15.3%
- Percentage of males in construction, extraction, and maintenance occupations:
Here: 13.0% city: 11.6%
- Percentage of males in production occupations:
Here: 4.4% city: 6.1%
- Percentage of males in transportation occupations:
Here: 4.0% city: 6.6%
- Percentage of males in material moving occupations:
Here: 2.1% city: 9.3%
Occupations of females:
- Percentage of females in management occupations (except farmers):
Here: 9.0% city: 7.5%
- Percentage of females in business and financial operations occupations:
Here: 3.2% city: 3.0%
- Percentage of females in architecture and engineering occupations:
Here: 2.6% city: 0.6%
- Percentage of females in life, physical, and social science occupations:
Here: 1.8% city: 0.4%
- Percentage of females in community and social services occupations:
Here: 2.9% city: 1.9%
- Percentage of females in arts, design, entertainment, sports, and media occupations:
Here: 5.7% city: 1.0%
- Percentage of females in healthcare practitioners and technical occupations:
Here: 11.0% city: 6.2%
- Percentage of females in service occupations:
Here: 17.6% city: 23.3%
- Percentage of females in sales and office occupations:
Here: 41.1% city: 28.4%
- Percentage of females in farming, fishing, and forestry occupations:
Here: 6.5% city: 11.0%
- Percentage of females in production occupations:
Here: 1.9% city: 2.5%
- Percentage of females in transportation occupations:
Here: 1.1% city: 1.1%
Percentage of people 16-64 in Armed Forces:
| Westridge: | 0.4% |
| Salinas: | 0.1% |
Education in this neighborhood (subdivision or community):
- Percentage of people 3 years and older in K-12 schools:
Westridge: 20.0% Salinas: 20.2%
- Percentage of people 3 years and older in undergraduate colleges:
Westridge: 4.2% Salinas: 4.8%
- Percentage of people 3 years and older in grad. or professional schools:
Westridge: 33.7% Salinas: 0.8%
- Percentage of students K-12 enrolled in private schools:
Westridge: 5.3% Salinas: 2.5%
Percentage of population below poverty level:
| Westridge: | 9.8% |
| Salinas: | 12.6% |
Median year owner moved in (as recorded in 2022):
Median year renter moved in (as recorded in 2022):
| Westridge: | 2004 |
| Salinas: | 2007 |
Median year renter moved in (as recorded in 2022):
| Westridge: | 2010 |
| Salinas: | 2018 |
Percentage of married-couple families with both working:
| Westridge: | 87.7% |
| Salinas: | 70.1% |

- 50.4%Utility gas
- 47.2%Electricity
- 1.3%Bottled, tank, or LP gas
- 1.2%No fuel used
Highways in this neighborhood:
el Camino Real (US Hwy 101)
Length: 0.31 miles
Directions: N-S, SE-NW
Directions: N-S, SE-NW
Roads and streets:
el Rancho Way
Length: 0.50 miles
Directions: E-W, N-S, SE-NW, SW-NE
Address range: 16800 to 17489
Directions: E-W, N-S, SE-NW, SW-NE
Address range: 16800 to 17489
Westridge Pkwy
Length: 0.45 miles
Directions: E-W, SE-NW, SW-NE
Address range: 1100 to 1199
Directions: E-W, SE-NW, SW-NE
Address range: 1100 to 1199
Boronda Rd
Length: 0.36 miles
Direction: SW-NE
Address range: 400 to 429
Direction: SW-NE
Address range: 400 to 429
Hyland Dr
Length: 0.31 miles
Direction: SW-NE
Address range: 400 to 499
Direction: SW-NE
Address range: 400 to 499
Virginia Ave
Length: 0.28 miles
Directions: E-W, N-S, SE-NW, SW-NE
Address range: 400 to 499
Directions: E-W, N-S, SE-NW, SW-NE
Address range: 400 to 499
Milano St
Length: 0.15 miles
Direction: E-W
Direction: E-W
Higuera Ln
Length: 0.12 miles
Direction: E-W
Address range: 1 to 99
Direction: E-W
Address range: 1 to 99
Canario St
Length: 0.12 miles
Directions: N-S, SE-NW, SW-NE
Directions: N-S, SE-NW, SW-NE
Brooks Rd
Length: 0.11 miles
Directions: E-W, SW-NE
Address range: 1 to 43
Directions: E-W, SW-NE
Address range: 1 to 43
Cranford Rd
Length: 0.11 miles
Direction: E-W
Address range: 400 to 499
Direction: E-W
Address range: 400 to 499