Woodland Heights neighborhood in Novato, California (CA), 94947, 94949 detailed profile
Settings
X


Business Search - 14 Million verified businesses
Area: 0.145 square miles
Population: 525
Population density:
| Woodland Heights: | 3,621 people per square mile |
| Novato: | 1,915 people per square mile |

- 23244.4%Hispanic or Latino
- 15930.4%White
- 5710.9%Asian
- 417.8%Black
- 193.6%Two or more races
- 152.9%Some other race

Median household income in 2022:
| Woodland Heights: | $102,163 |
| Novato: | $110,948 |
Distribution of median household income
![Distribution of median household income]()
- 19Less than $10,000
- 13$10,000 to $19,999
- 4$20,000 to $29,999
- 23$30,000 to $39,999
- 15$40,000 to $49,999
- 5$50,000 to $59,999
- 12$60,000 to $74,999
- 10$75,000 to $99,999
- 19$100,000 to $124,999
- 16$125,000 to $149,999
- 20$150,000 to $199,999
- 46$200,000 or more

Distribution of owner-occupied house/condo value
![Distribution of owner-occupied house/condo value]()
- 2Less than $50,000
- 14$50,000 to $99,999
- 4$300,000 to $399,999
- 27$400,000 to $499,999
- 36$500,000 to $749,999
- 20$750,000 to $999,999
- 15$1,000,000 or more

Distribution of rent paid by renters
![Distribution of rent paid by renters]()
- 5$1,250 to $1,499
- 44$1,500 to $1,999
- 40$2,000 or more

Median rent in 2022:
| Woodland Heights: | $1,942 |
| Novato: | $2,001 |
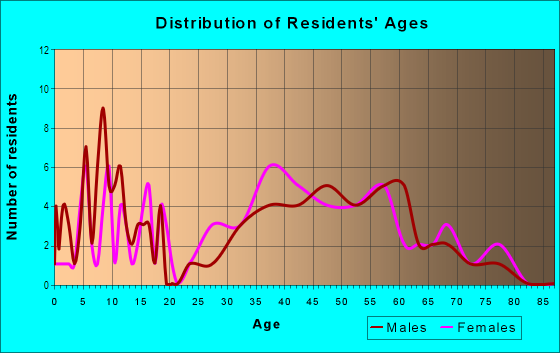
| Males: | 248 |
| Females: | 277 |
Males:
| This neighborhood: | 35.7 years |
| Whole city: | 48.1 years |
| This neighborhood: | 36.0 years |
| Whole city: | 49.5 years |
Average household size:
| Woodland Heights: | 2.8 people |
| Novato: | 2.5 people |
Percentage of family households:
| Woodland Heights: | 54.1% |
| Novato: | 40.9% |
| Here: | 35.1% |
| Novato: | 55.8% |
Percentage of married-couple families with children (among all households):
| Woodland Heights: | 14.5% |
| Novato: | 31.9% |
Percentage of single-mother households (among all households):
| Woodland Heights: | 20.8% |
| Novato: | 5.8% |
Percentage of never married males 15 years old and over:
Percentage of never married females 15 years old and over:
| Woodland Heights: | 22.9% |
| Novato: | 15.7% |
Percentage of never married females 15 years old and over:
| Woodland Heights: | 22.8% |
| city: | 12.8% |
Percentage of people that speak English not well or not at all:
| Woodland Heights: | 0.0% |
| Novato: | 5.4% |
Percentage of people born in this state:
Percentage of people born in another U.S. state:
Percentage of native residents but born outside the U.S.:
Percentage of foreign born residents:
| Here: | 49.8% |
| Novato: | 53.8% |
Percentage of people born in another U.S. state:
| Woodland Heights: | 25.6% |
| Novato: | 24.0% |
Percentage of native residents but born outside the U.S.:
| Here: | 0.6% |
| city: | 1.1% |
Percentage of foreign born residents:
| Here: | 24.0% |
| Novato: | 21.2% |

Owner-occupied
Renter-occupied


- Rooms in owner-occupied houses and condos in Woodland Heights
- 11 room
- 32 rooms
- 103 rooms
- 224 rooms
- 225 rooms
- 226 rooms
- 137 rooms
- 38 rooms
- 129+ rooms

- Rooms in renter-occupied apartments in Woodland Heights
- 01 room
- 32 rooms
- 213 rooms
- 204 rooms
- 155 rooms
- 156 rooms
- 07 rooms
- 08 rooms
- 19+ rooms
Owner-occupied
Renter-occupied

- Bedrooms in owner-occupied houses and condos in Woodland Heights
- 1no bedroom
- 31 bedroom
- 372 bedrooms
- 703 bedrooms
- 104 bedrooms
- 05+ bedrooms

- Bedrooms in renter-occupied apartments in Woodland Heights
- 0no bedroom
- 111 bedroom
- 352 bedrooms
- 303 bedrooms
- 14 bedrooms
- 05+ bedrooms
Average number of cars or other vehicles available in houses/condos:
Average number of cars or other vehicles available in apartments:
| This neighborhood: | 1.8 |
| Novato: | 2.2 |
Average number of cars or other vehicles available in apartments:
| Here: | 1.6 |
| city: | 1.6 |
Percentage of units with a mortgage:
| Woodland Heights: | 55.7% |
| Novato: | 66.9% |

- Year house built in Woodland Heights
- 02020 or later
- 02010 to 2019
- 112000 to 2009
- 61990 to 1999
- 471980 to 1989
- 1031970 to 1979
- 261960 to 1969
- 281950 to 1959
- 81940 to 1949
- 01939 or earlier

City-data.com crime index for city in 2020 (higher means more crime):
| City: | 173.9 |
| U.S. average: | 219.5 |
Travel time to work (commute)
![Travel time to work (commute)]()
- 4Less than 5 minutes
- 105 to 9 minutes
- 1810 to 14 minutes
- 2215 to 19 minutes
- 2020 to 24 minutes
- 625 to 29 minutes
- 2430 to 34 minutes
- 2035 to 39 minutes
- 540 to 44 minutes
- 2945 to 59 minutes
- 960 to 89 minutes
- 390 or more minutes

Means of transportation to work
![Means of transportation to work]()
- 76.5%200Drove a car alone
- 2.7%7Carpooled
- 3.8%10Bus
- 0.4%1Ferryboat
- 0.4%1Walked
- 5.0%13Other means
- 10.3%27Worked at home

Time leaving home to go to work
![Time leaving home to go to work]()
- 512:00 a.m. to 4:59 a.m.
- 35:00 a.m. to 5:29 a.m.
- 75:30 a.m. to 5:59 a.m.
- 136:00 a.m. to 6:29 a.m.
- 266:30 a.m. to 6:59 a.m.
- 317:00 a.m. to 7:29 a.m.
- 227:30 a.m. to 7:59 a.m.
- 88:00 a.m. to 8:29 a.m.
- 28:30 a.m. to 8:59 a.m.
- 119:00 a.m. to 9:59 a.m.
- 510:00 a.m. to 10:59 a.m.
- 211:00 a.m. to 11:59 a.m.
- 1112:00 p.m. to 3:59 p.m.
- 114:00 p.m. to 11:59 p.m.

Occupations of males:
- Percentage of males in management occupations (except farmers):
Here: 8.9% city: 17.8%
- Percentage of males in business and financial operations occupations:
Here: 2.5% city: 5.6%
- Percentage of males in computer and mathematical occupations:
Here: 2.4% city: 5.1%
- Percentage of males in architecture and engineering occupations:
Here: 1.2% city: 3.6%
- Percentage of males in life, physical, and social science occupations:
Here: 4.7% city: 1.2%
- Percentage of males in community and social services occupations:
Here: 2.0% city: 2.6%
- Percentage of males in legal occupations:
Here: 4.3% city: 1.2%
- Percentage of males in education, training, and library occupations:
Here: 1.2% city: 4.2%
- Percentage of males in arts, design, entertainment, sports, and media occupations:
Here: 1.5% city: 2.4%
- Percentage of males in healthcare practitioners and technical occupations:
Here: 1.6% city: 4.4%
- Percentage of males in service occupations:
Here: 42.4% city: 16.2%
- Percentage of males in sales and office occupations:
Here: 12.1% city: 15.7%
- Percentage of males in farming, fishing, and forestry occupations:
Here: 1.3% city: 0.4%
- Percentage of males in construction, extraction, and maintenance occupations:
Here: 12.1% city: 7.9%
- Percentage of males in transportation occupations:
Here: 2.0% city: 3.3%
- Percentage of males in material moving occupations:
Here: 6.3% city: 2.6%
Occupations of females:
- Percentage of females in management occupations (except farmers):
Here: 7.8% city: 12.5%
- Percentage of females in business and financial operations occupations:
Here: 5.7% city: 6.0%
- Percentage of females in computer and mathematical occupations:
Here: 2.8% city: 1.3%
- Percentage of females in life, physical, and social science occupations:
Here: 2.4% city: 1.7%
- Percentage of females in legal occupations:
Here: 8.8% city: 1.4%
- Percentage of females in education, training, and library occupations:
Here: 2.9% city: 9.4%
- Percentage of females in arts, design, entertainment, sports, and media occupations:
Here: 5.0% city: 4.6%
- Percentage of females in healthcare practitioners and technical occupations:
Here: 8.1% city: 5.9%
- Percentage of females in service occupations:
Here: 26.3% city: 18.4%
- Percentage of females in sales and office occupations:
Here: 21.4% city: 31.8%
- Percentage of females in production occupations:
Here: 2.3% city: 0.7%
- Percentage of females in transportation occupations:
Here: 5.0% city: 0.9%
- Percentage of females in material moving occupations:
Here: 3.8% city: 1.6%
Education in this neighborhood (subdivision or community):
- Percentage of people 3 years and older in K-12 schools:
Woodland Heights: 23.3% Novato: 15.3%
- Percentage of people 3 years and older in undergraduate colleges:
Woodland Heights: 5.1% Novato: 4.0%
- Percentage of people 3 years and older in grad. or professional schools:
Woodland Heights: 1.0% Novato: 1.0%
- Percentage of students K-12 enrolled in private schools:
Woodland Heights: 2.5% Novato: 14.4%
Percentage of population below poverty level:
| Woodland Heights: | 18.6% |
| Novato: | 8.8% |
Median year owner moved in (as recorded in 2022):
Median year renter moved in (as recorded in 2022):
| Woodland Heights: | 2013 |
| Novato: | 2004 |
Median year renter moved in (as recorded in 2022):
| Woodland Heights: | 2014 |
| Novato: | 2015 |
Percentage of married-couple families with both working:
| Woodland Heights: | 78.7% |
| Novato: | 70.3% |

- 67.6%Utility gas
- 32.0%Electricity
Roads and streets:
Arlington Cir
Length: 0.48 miles
Directions: E-W, SW-NE
Address range: 500 to 899
Directions: E-W, SW-NE
Address range: 500 to 899
Terry Cir
Length: 0.39 miles
Directions: E-W, SE-NW, SW-NE
Address range: 1 to 99
Directions: E-W, SE-NW, SW-NE
Address range: 1 to 99
Stone Dr
Length: 0.34 miles
Directions: E-W, SW-NE
Address range: 400 to 599
Directions: E-W, SW-NE
Address range: 400 to 599
Oak View Ct
Length: 0.32 miles
Directions: E-W, N-S, SE-NW, SW-NE
Address range: 1 to 899
Directions: E-W, N-S, SE-NW, SW-NE
Address range: 1 to 899
Cambridge St
Length: 0.32 miles
Directions: N-S, SE-NW
Address range: 1001 to 1199
Directions: N-S, SE-NW
Address range: 1001 to 1199
Woodland Ct
Length: 0.11 miles
Directions: E-W, N-S, SE-NW
Address range: 1 to 99
Directions: E-W, N-S, SE-NW
Address range: 1 to 99
Novato Blvd (S Novato Blvd)
Length: 0.08 miles
Directions: N-S, SE-NW
Directions: N-S, SE-NW
Shari Ct
Length: 0.05 miles
Directions: E-W, SE-NW
Address range: 1 to 99
Directions: E-W, SE-NW
Address range: 1 to 99
Arlington Ct
Length: 0.02 miles
Direction: N-S
Address range: 1 to 99
Direction: N-S
Address range: 1 to 99